New: NextGenTemplates Academy - video courses on Excel formulas with AI and Pivot Tables & dashboards. Early-bird: 20% off with code EARLYBIRD20 - first 20 orders only. See the courses →
  • Learn Excel (Free Course)
    • 1. Shortcut Keys
    • 2. Fill & Flash Fill
    • 3. Find & Replace
    • 4. Sort & Filter
    • 5. Formulas & Functions
    • 6. Data Validation
    • 7. Conditional Formatting
    • 8. Basic Charts
    • 9. Advanced Charts
    • 10. Pivot Tables
    • 11. Excel Dashboards
    • 12. VBA Course
    • 13. Excel Formulas with AI
  • Templates
  • Tutorials
    • Charts and Visualization
    • VBA
    • Excel Tips and Tricks
    • Excel Dashboards
    • Power Pivot & DAX
  • Power BI
  • Template Store
    • Ready to Use Templates
  • Courses
  • Academy
    • Excel + AI Mastery: 100 Formulas
    • Excel Pivot Tables & Dashboards
  • About Us
  • Contact Us

PK: An Excel Expert

Transforming Data into Decisions

Tag: sales channel analysis

Celebrity Merchandising Dashboard in Power BI
Dashboard Power BI

Celebrity Merchandising Dashboard in Power BI

March 28, 2026March 28, 2026 PKComments Off on Celebrity Merchandising Dashboard in Power BI
Celebrity merchandising is a fast-moving business. Trends change quickly, fan demand shifts overnight, and product performance can vary from one celebrity category to another. Because of this, businesses need a
Read More
Dashboard Power BI

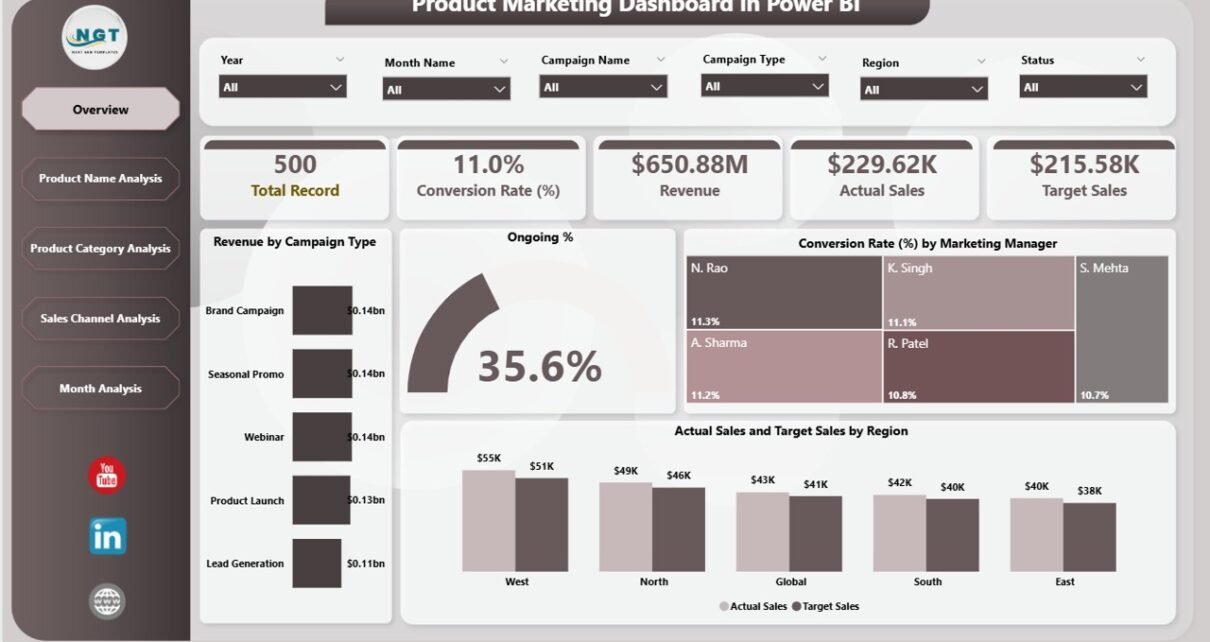
Product Marketing Dashboard in Power BI

February 10, 2026February 10, 2026 PKComments Off on Product Marketing Dashboard in Power BI
Marketing today moves fast. Campaigns launch every week. Products compete for attention. Teams spend budgets across channels. However, without clear data, even the best marketing strategy can fail. So, how
Read More
Dashboard

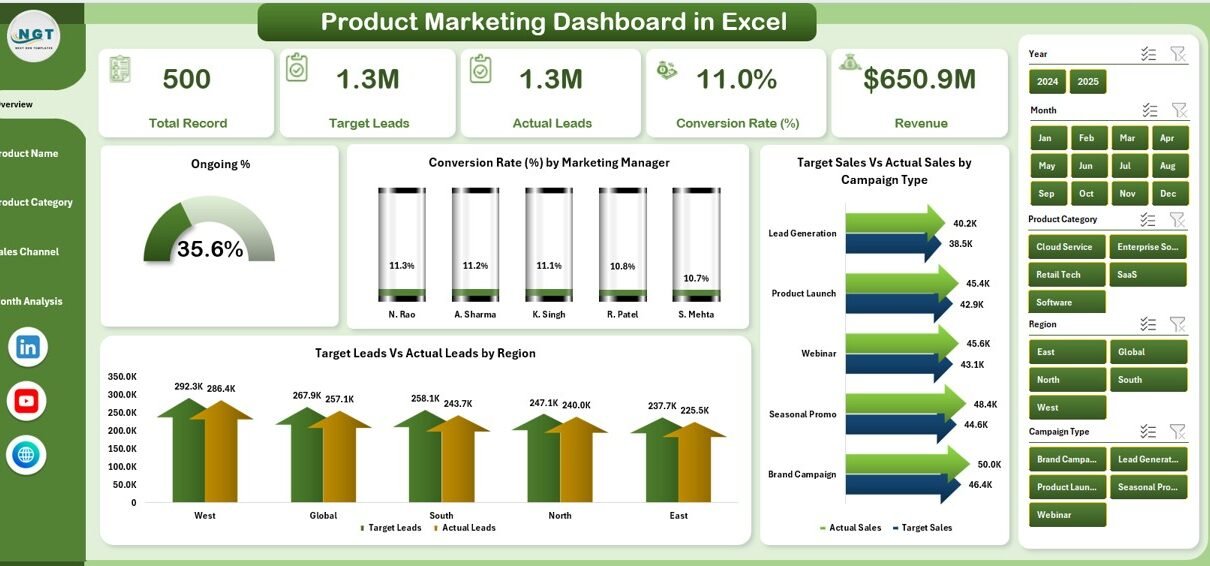
Product Marketing Dashboard in Excel

February 10, 2026February 10, 2026 PKComments Off on Product Marketing Dashboard in Excel
In today’s competitive market, companies must track campaigns, leads, revenue, and conversion rates in real time. However, many marketing teams still rely on scattered Excel sheets. As a result, managers
Read More
Dashboard Power BI

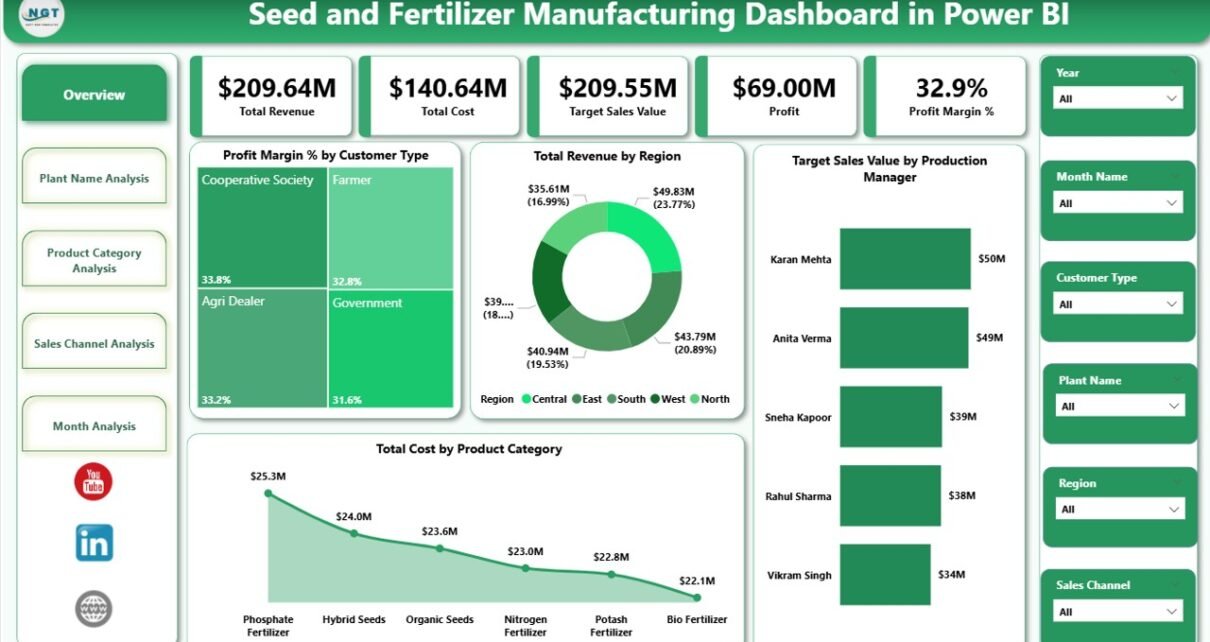
Seed and Fertilizer Manufacturing Dashboard in Power BI

February 8, 2026February 8, 2026 PKComments Off on Seed and Fertilizer Manufacturing Dashboard in Power BI
The agriculture industry moves fast. Demand changes with seasons. Raw material prices fluctuate often. Production targets shift frequently. Therefore, manufacturers must track revenue, cost, profit margin, plant performance, and sales
Read More
Dashboard Power BI

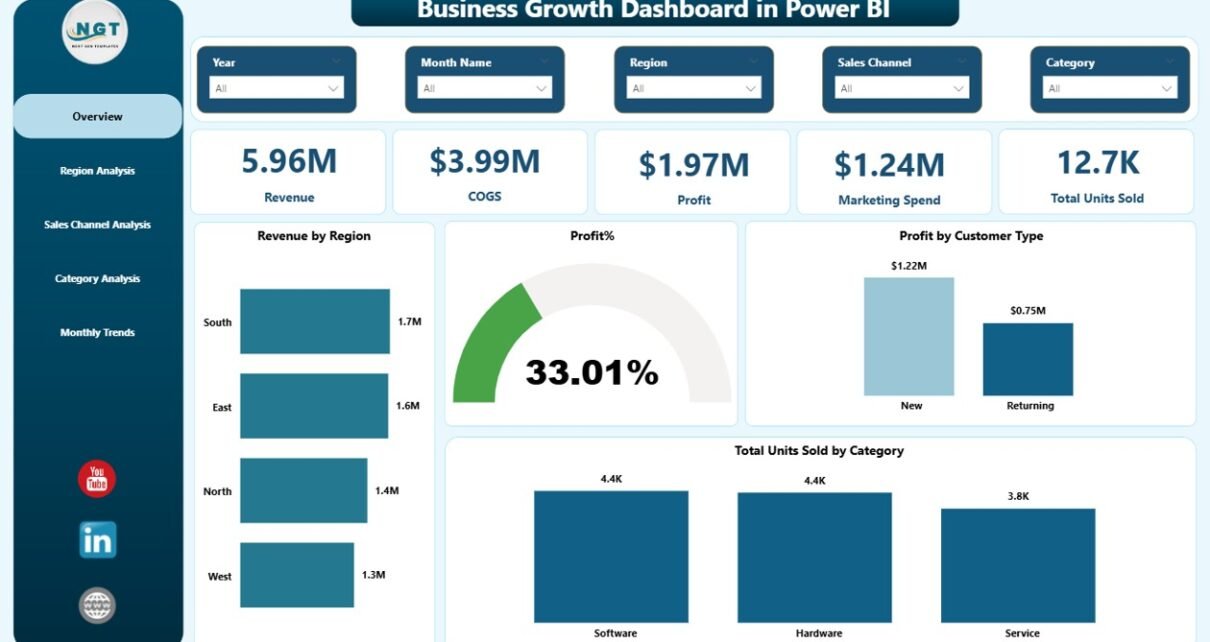
Business Growth Dashboard in Power BI

February 8, 2026February 8, 2026 PKComments Off on Business Growth Dashboard in Power BI
In today’s competitive market, businesses must move fast. Markets change quickly. Customer preferences shift constantly. Costs rise unexpectedly. Therefore, companies must track performance in real time. However, many organizations still
Read More
Dashboard Power BI

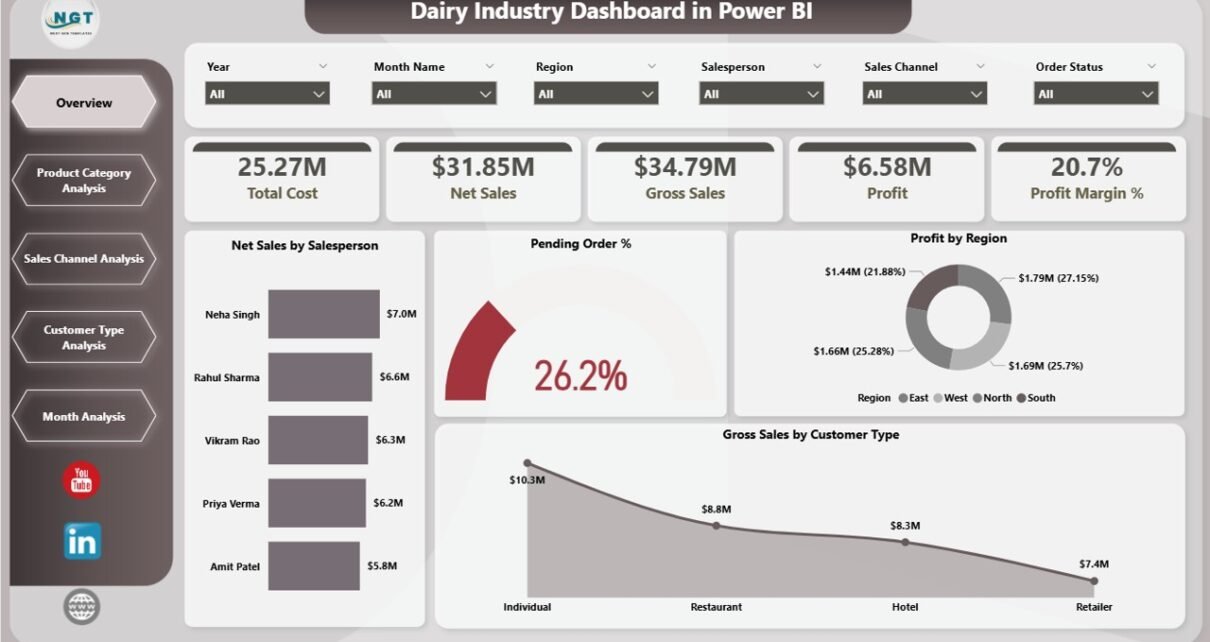
Dairy Industry Dashboard in Power BI

February 7, 2026February 7, 2026 PKComments Off on Dairy Industry Dashboard in Power BI
The dairy industry moves fast. Demand changes daily. Prices fluctuate weekly. Customer expectations grow every season. Therefore, dairy companies must track sales, profit, cost, customer trends, and product performance in
Read More
Dashboard Power BI

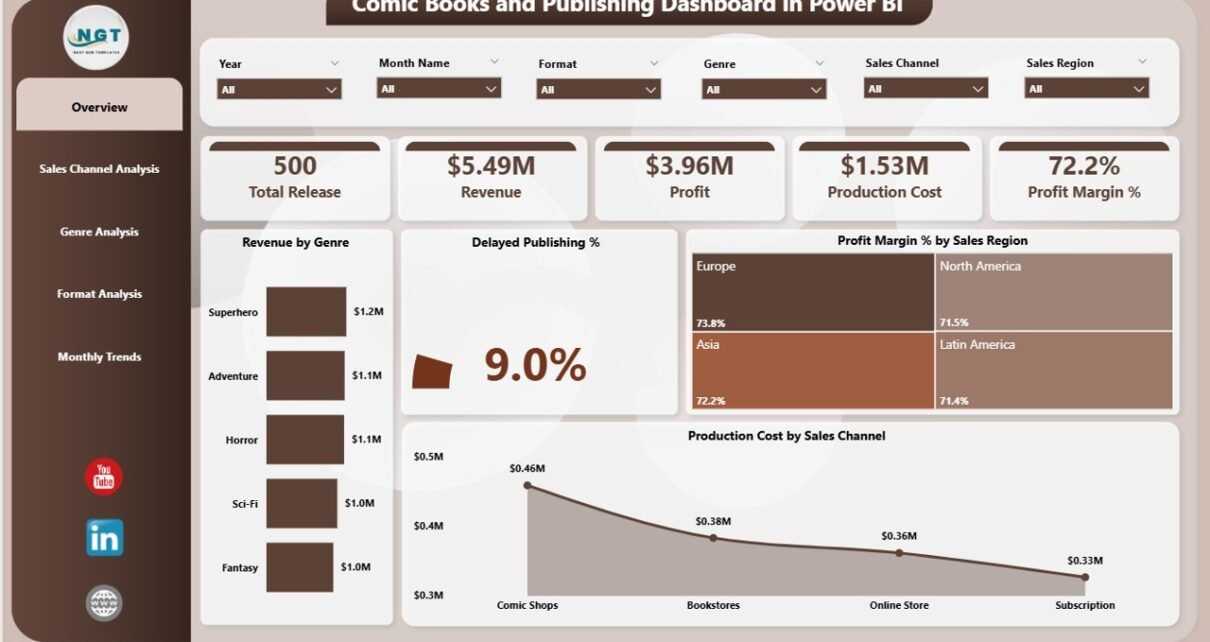
Comic Books and Publishing Dashboard in Power BI

February 5, 2026February 5, 2026 PKComments Off on Comic Books and Publishing Dashboard in Power BI
The comic books and publishing industry continues to grow rapidly. At the same time, competition keeps increasing, production costs keep rising, and reader preferences keep changing. Therefore, comic publishers, studios,
Read More
Dashboard Power BI

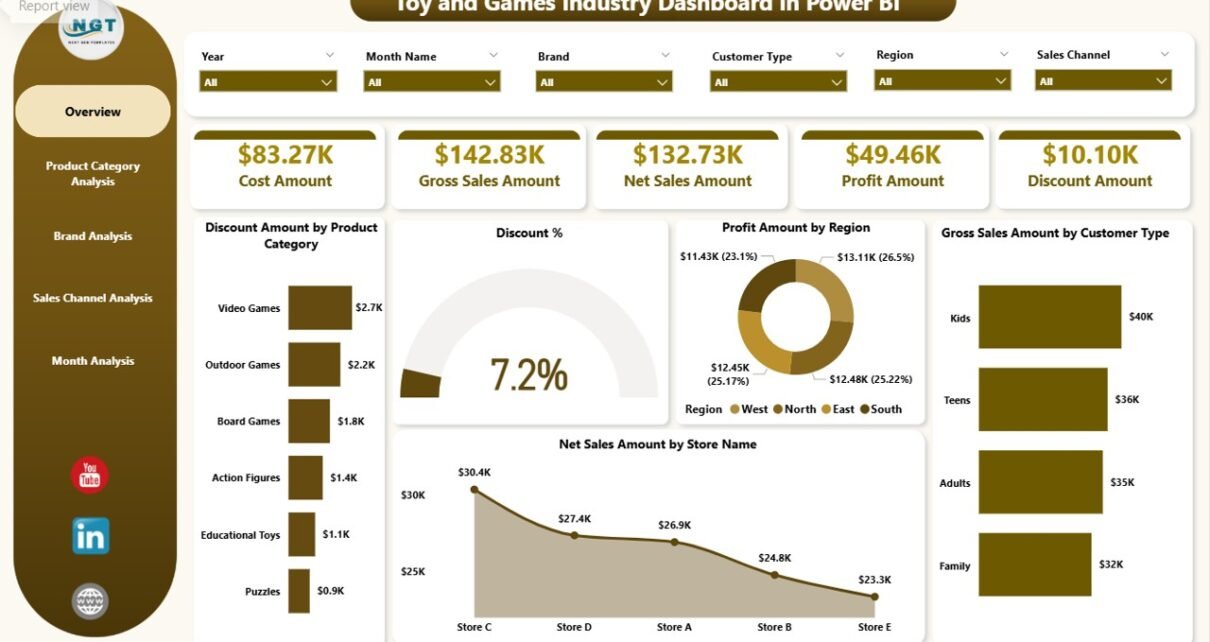
Toy and Games Industry Dashboard in Power BI

January 29, 2026January 29, 2026 PKComments Off on Toy and Games Industry Dashboard in Power BI
The toy and games industry thrives on creativity, trends, and seasonal demand. However, without clear data visibility, even the most innovative toy businesses struggle to grow. That is exactly where
Read More
Power BI

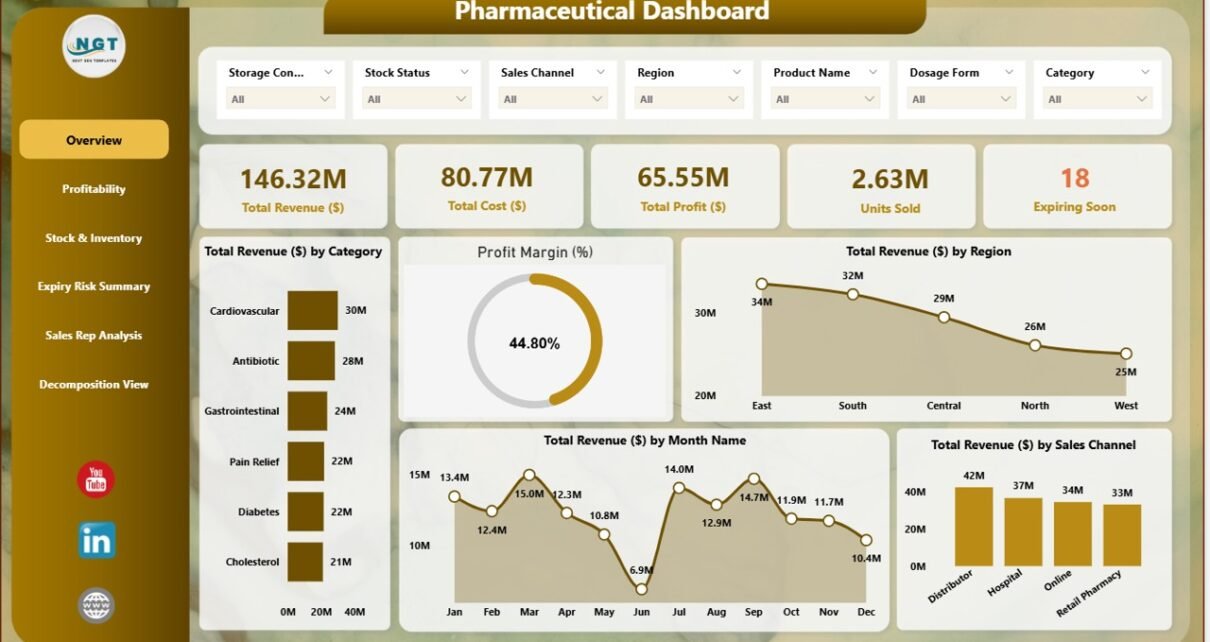
Pharmaceutical Dashboard in Power BI

July 23, 2025July 23, 2025 PKComments Off on Pharmaceutical Dashboard in Power BI
Effective tracking and analysis of pharmaceutical sales, profit margins, inventory, and other key performance indicators (KPIs) is essential for any business operating in the healthcare industry. The Pharmaceutical Dashboard in
Read More
  • Learn Excel (Free Course)
    • 1. Shortcut Keys
    • 2. Fill & Flash Fill
    • 3. Find & Replace
    • 4. Sort & Filter
    • 5. Formulas & Functions
    • 6. Data Validation
    • 7. Conditional Formatting
    • 8. Basic Charts
    • 9. Advanced Charts
    • 10. Pivot Tables
    • 11. Excel Dashboards
    • 12. VBA Course
    • 13. Excel Formulas with AI
  • Templates
  • Tutorials
    • Charts and Visualization
    • VBA
    • Excel Tips and Tricks
    • Excel Dashboards
    • Power Pivot & DAX
  • Power BI
  • Template Store
    • Ready to Use Templates
  • Courses
  • Academy
    • Excel + AI Mastery: 100 Formulas
    • Excel Pivot Tables & Dashboards
  • About Us
  • Contact Us
Copyright © 2023 PK-AnExcelExpert.com - Privacy Policy