The comic books and publishing industry continues to grow rapidly. At the same time, competition keeps increasing, production costs keep rising, and reader preferences keep changing. Therefore, comic publishers, studios, and independent creators must track their performance carefully. However, many teams still rely on scattered Excel sheets, manual reports, and delayed analysis.
That approach creates confusion instead of clarity.
This is exactly where a Comic Books and Publishing Dashboard in Power BI delivers real value. It transforms raw publishing data into powerful visual insights. As a result, publishers can track revenue, monitor production costs, analyze profitability, and identify delays in real time.
In this detailed guide, you will learn what a Comic Books and Publishing Dashboard in Power BI is, how it works, why it matters, its dashboard pages, key features, advantages, best practices, and frequently asked questions. By the end, you will clearly understand how this dashboard helps comic publishers make faster and smarter decisions.
Click to Purchases Comic Books and Publishing Dashboard in Power BI
What Is a Comic Books and Publishing Dashboard in Power BI?
A Comic Books and Publishing Dashboard in Power BI is an interactive analytics solution designed specifically for comic book publishers, studios, and publishing houses.
Instead of reviewing static reports, this dashboard allows teams to:
-
Track revenue across genres, formats, and sales channels
-
Monitor production costs and profit margins
-
Identify delayed publishing issues early
-
Compare monthly, regional, and format-level performance
-
Make data-driven publishing and marketing decisions
Moreover, Power BI connects seamlessly with Excel and other data sources. Therefore, publishers can update data easily and see insights instantly.
Why Do Comic Book Publishers Need a Power BI Dashboard?
Comic publishing involves creativity, planning, printing, marketing, and distribution. However, without proper analytics, even the best stories can struggle financially.
That is why publishers need a centralized dashboard.
Common Challenges Without a Dashboard
-
Scattered sales and cost data
-
No clear view of profit margins
-
Delayed identification of publishing issues
-
Difficulty comparing genres, formats, and channels
-
Slow decision-making
How Power BI Solves These Problems
A Comic Books and Publishing Dashboard in Power BI solves these issues by providing:
-
Centralized data visibility
-
Real-time performance tracking
-
Interactive slicers for quick filtering
-
Visual insights instead of raw numbers
-
Easy comparison across multiple dimensions
As a result, publishers gain control over both creative and financial performance.
How Does a Comic Books and Publishing Dashboard in Power BI Work?
The dashboard works by connecting publishing data to Power BI. Typically, this data comes from Excel files or databases.
Data Usually Includes
-
Genre-wise revenue
-
Sales channel performance
-
Production costs
-
Profit margins
-
Publishing delays
-
Monthly trends
Once the data loads into Power BI, visuals, charts, and cards automatically update based on selected slicers.
Therefore, users can filter data by genre, format, month, or sales channel within seconds.
What Are the Key Pages in a Comic Books and Publishing Dashboard in Power BI?
This dashboard includes 5 powerful analytical pages, each designed to answer specific business questions.
Let us explore each page in detail.
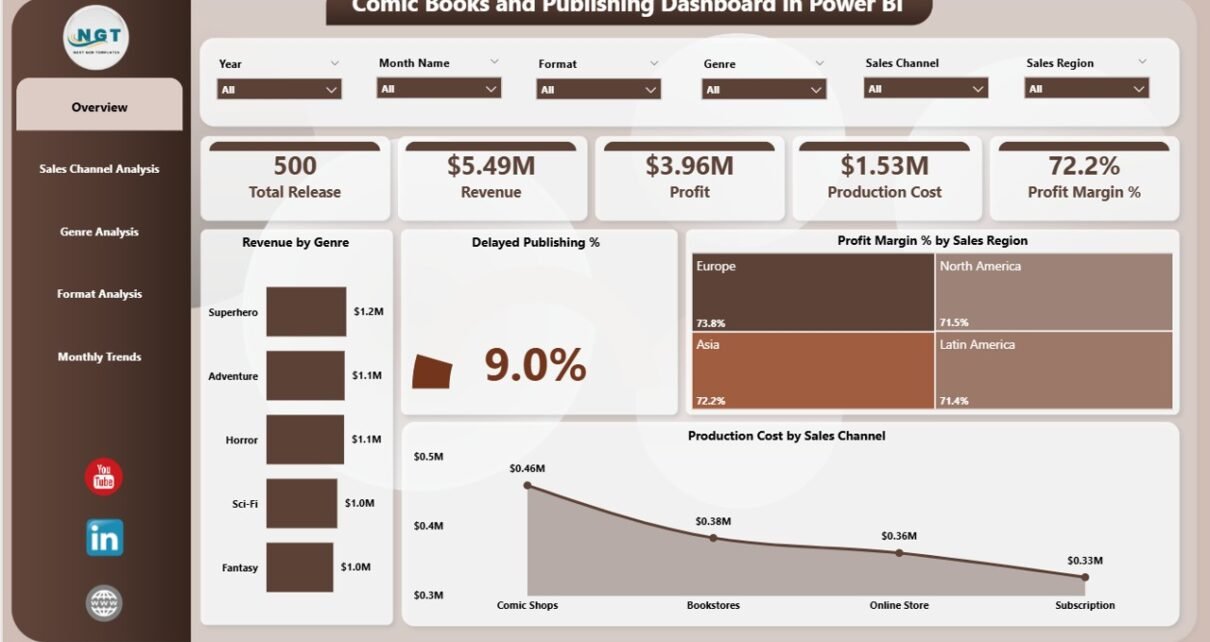
1. Overview Page: How Can Publishers Get a High-Level Performance Snapshot?
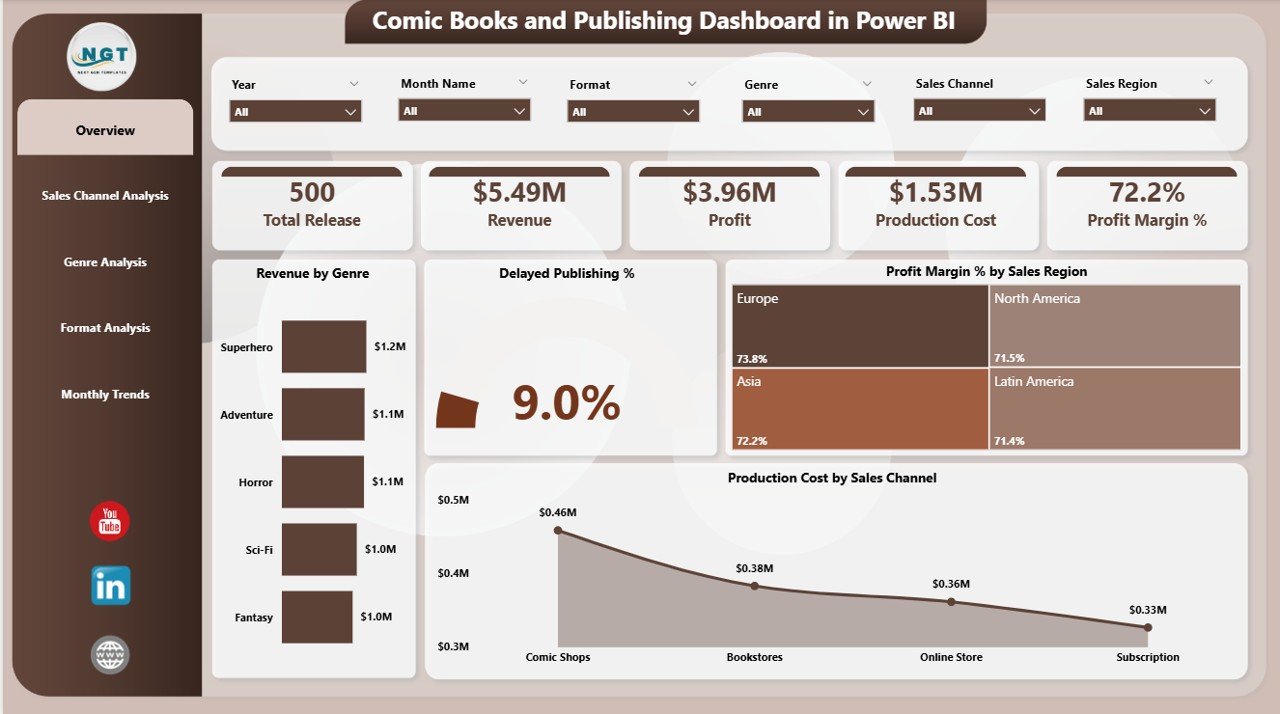
The Overview Page serves as the main landing page of the dashboard. It provides a quick summary of overall publishing performance.
Key Features of the Overview Page
-
Interactive slicers for easy filtering
-
High-level KPI cards
-
Visual summaries of revenue, cost, and profitability
KPI Cards and Charts on the Overview Page
-
Revenue by Genre
Shows which genres generate the highest income. -
Delayed Publishing %
Highlights the percentage of publishing delays. -
Profit Margin % by Sales Region
Helps compare regional profitability. -
Production Cost by Sales Channel
Displays cost distribution across channels.
Because this page provides a complete snapshot, decision-makers can instantly understand overall performance.
2. Sales Channel Analysis: Which Sales Channels Perform the Best?
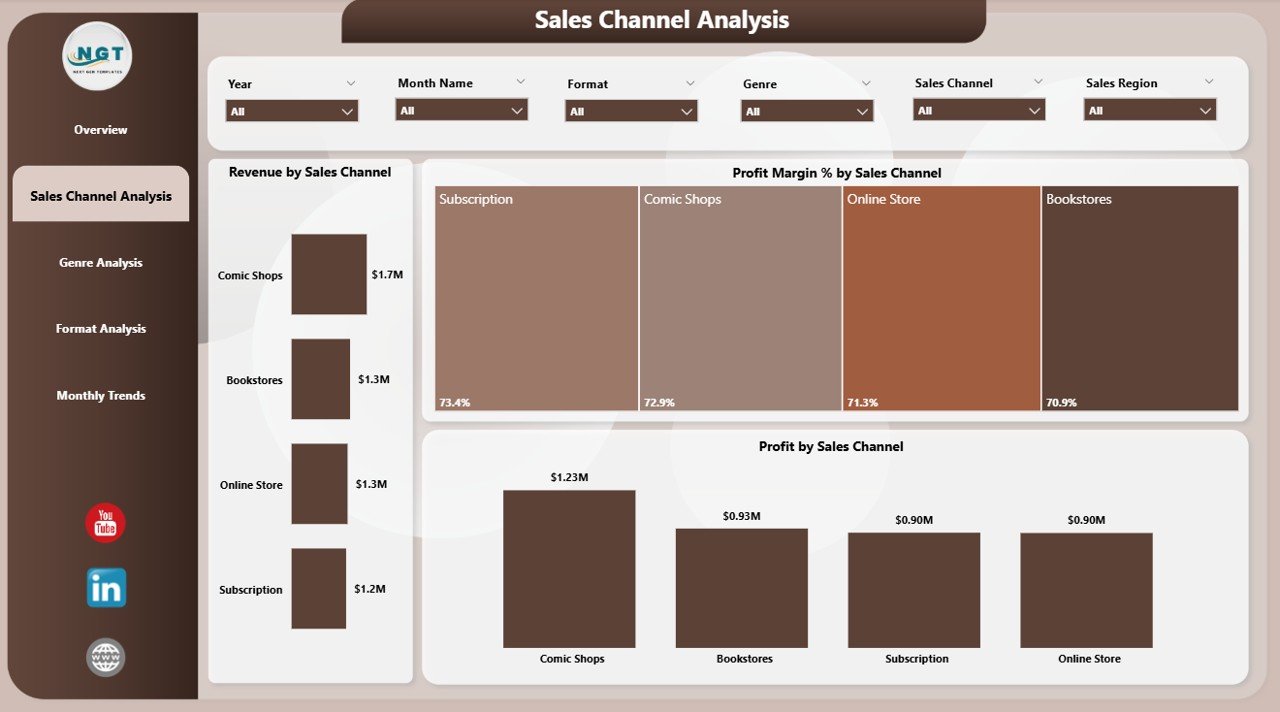
The Sales Channel Analysis Page focuses entirely on how different sales channels contribute to revenue and profit.
Why Sales Channel Analysis Matters
Different channels behave differently. For example, online platforms may generate higher volume, while retail stores may deliver higher margins.
This page helps publishers identify those differences clearly.
Charts Available on the Sales Channel Analysis Page
-
Revenue by Sales Channel
Compares income generated by each channel. -
Profit Margin % by Sales Channel
Highlights the most profitable channels. -
Profit by Sales Channel
Shows actual profit values per channel.
As a result, publishers can optimize marketing budgets and distribution strategies.
3. Genre Analysis: Which Comic Genres Drive Profitability?
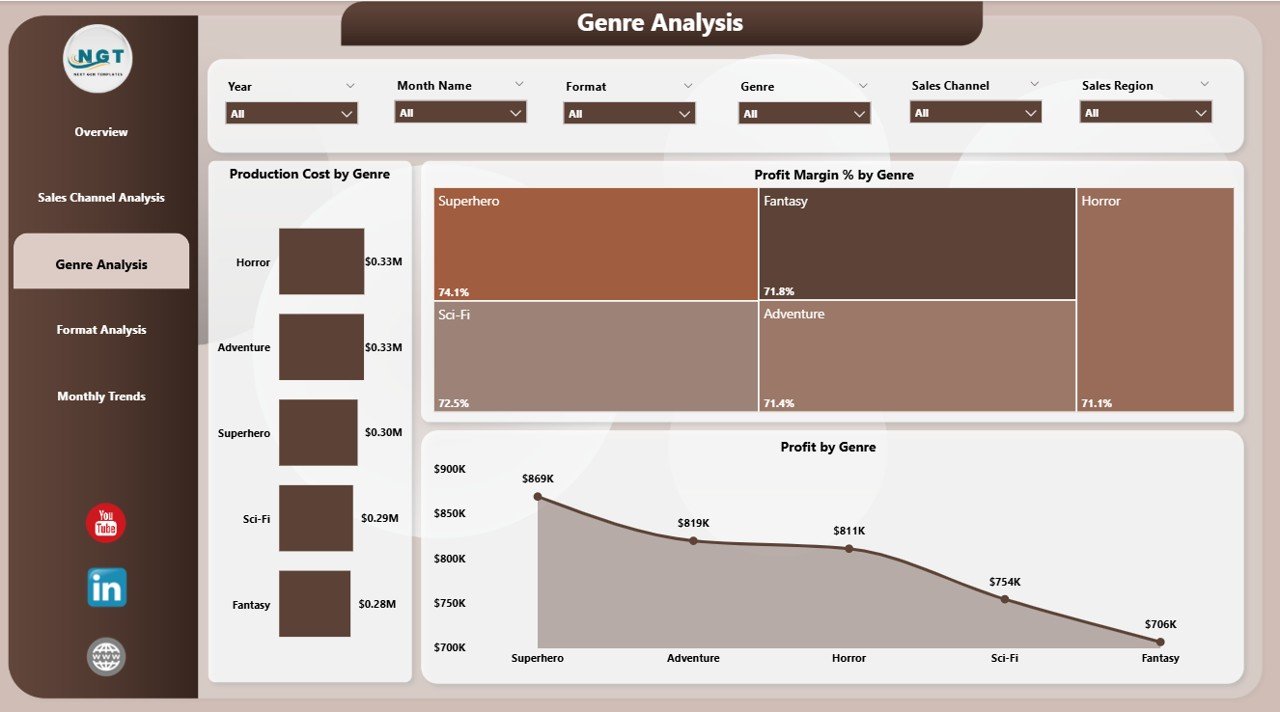
The Genre Analysis Page helps publishers understand how different comic genres perform financially.
Why Genre Analysis Is Important
Every genre attracts a different audience. Therefore, not all genres perform equally in terms of revenue or profit.
This page helps publishers invest wisely.
Charts on the Genre Analysis Page
-
Production Cost by Genre
Displays cost incurred for each genre. -
Profit Margin % by Genre
Shows which genres deliver higher margins. -
Profit by Genre
Highlights net profit generated by each genre.
Because of this analysis, publishers can prioritize high-performing genres and rework underperforming ones.
4. Format Analysis: Which Comic Formats Deliver the Best Results?
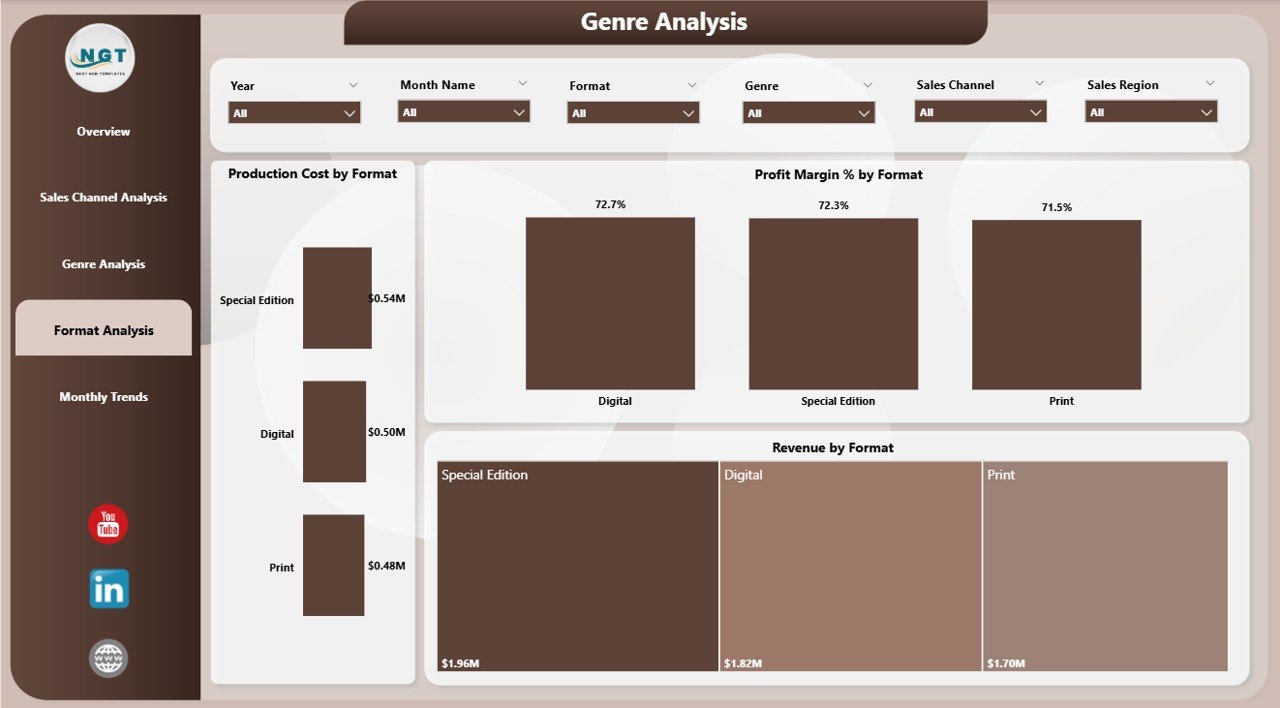
The Format Analysis Page focuses on different publishing formats such as print, digital, or special editions.
Why Format Analysis Helps Publishers
Each format has different production costs, pricing strategies, and customer demand.
This page helps publishers balance format investments.
Charts Available on the Format Analysis Page
-
Production Cost by Format
Compares cost across formats. -
Profit Margin % by Format
Shows which formats deliver better margins. -
Revenue by Format
Highlights revenue contribution by each format.
With these insights, publishers can decide whether to expand digital publishing or invest more in print.
5. Month Analysis: How Does Performance Change Over Time?
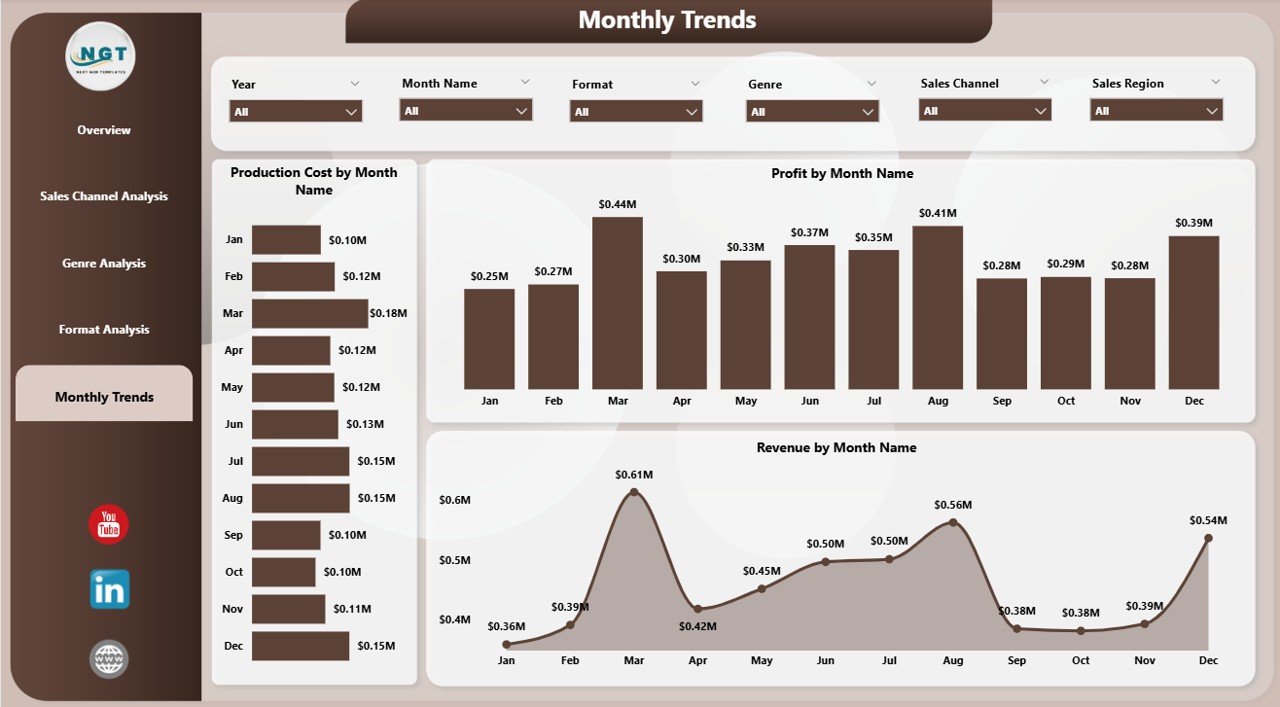
The Month Analysis Page tracks trends over time.
Why Monthly Analysis Matters
Publishing performance often changes seasonally. Therefore, monthly insights help with planning and forecasting.
Charts on the Month Analysis Page
-
Production Cost by Month
Tracks cost trends across months. -
Profit Margin % by Month
Shows profitability changes over time. -
Revenue by Month
Highlights monthly sales performance.
As a result, publishers can plan releases, promotions, and budgets more effectively.
Click to Purchases Comic Books and Publishing Dashboard in Power BI
What Are the Key Features of a Comic Books and Publishing Dashboard in Power BI?
This dashboard offers several powerful features that make it easy to use and highly effective.
Key Features at a Glance
-
Interactive slicers for instant filtering
-
Visually rich charts and KPI cards
-
Real-time data updates
-
Easy comparison across genres, formats, and channels
-
User-friendly Power BI interface
-
Scalable design for future expansion
Because of these features, even non-technical users can analyze data easily.
Advantages of Comic Books and Publishing Dashboard in Power BI
Using this dashboard offers multiple business advantages.
1. Improves Decision-Making
The dashboard provides clear visual insights. Therefore, publishers can make faster and smarter decisions.
2. Increases Profitability
By identifying high-margin genres and channels, publishers can optimize resources.
3. Reduces Publishing Delays
The delayed publishing percentage helps teams identify issues early.
4. Enhances Financial Control
Tracking production costs and profits improves budget control.
5. Saves Time
Automated dashboards eliminate manual reporting and save hours of work.
How Does This Dashboard Help Different Stakeholders?
Different teams benefit in different ways.
For Publishers and Owners
-
Clear financial visibility
-
Profit-focused decision-making
-
Long-term planning support
For Finance Teams
-
Accurate cost and profit tracking
-
Reduced reporting effort
-
Better forecasting
For Editors and Production Teams
-
Visibility into delays
-
Better planning of resources
-
Improved production efficiency
Best Practices for the Comic Books and Publishing Dashboard in Power BI
To get maximum value, follow these best practices.
1. Keep Data Clean and Updated
Always update sales and cost data regularly. Clean data ensures accurate insights.
2. Use Consistent Naming Conventions
Maintain consistent names for genres, formats, and channels.
3. Focus on Actionable KPIs
Track metrics that directly impact revenue and profit.
4. Limit Visual Clutter
Avoid too many visuals on one page. Keep charts clear and meaningful.
5. Train Users
Ensure users understand slicers, filters, and drill-down features.
How Can This Dashboard Support Business Growth?
This dashboard supports growth by:
-
Identifying profitable opportunities
-
Reducing cost inefficiencies
-
Improving publishing timelines
-
Supporting strategic expansion
As a result, publishers can scale operations confidently.
Conclusion: Why Should Publishers Use a Comic Books and Publishing Dashboard in Power BI?
A Comic Books and Publishing Dashboard in Power BI is no longer optional. It has become essential for modern publishers.
This dashboard provides real-time insights into revenue, costs, profit margins, and delays. Moreover, it replaces manual reports with interactive visuals. As a result, publishers gain control, clarity, and confidence.
If you want to grow your publishing business, reduce risks, and improve profitability, this dashboard offers the perfect solution.
Frequently Asked Questions About Comic Books and Publishing Dashboard in Power BI
Click to Purchases Comic Books and Publishing Dashboard in Power BI
What data is required to build this dashboard?
You need sales data, production cost data, genre details, format information, sales channels, and monthly performance data.
Can beginners use this Power BI dashboard?
Yes, the dashboard uses simple visuals and slicers, making it beginner-friendly.
Can this dashboard handle large data volumes?
Yes, Power BI handles large datasets efficiently.
Can publishers customize the dashboard?
Yes, users can easily add new visuals, pages, or KPIs.
Does this dashboard support real-time updates?
Yes, Power BI refreshes data based on the configured schedule.
Is this dashboard suitable for small publishers?
Absolutely. Small and mid-sized publishers benefit greatly from centralized insights.
Visit our YouTube channel to learn step-by-step video tutorials