New: NextGenTemplates Academy - video courses on Excel formulas with AI and Pivot Tables & dashboards. Early-bird: 20% off with code EARLYBIRD20 - first 20 orders only.See the courses →
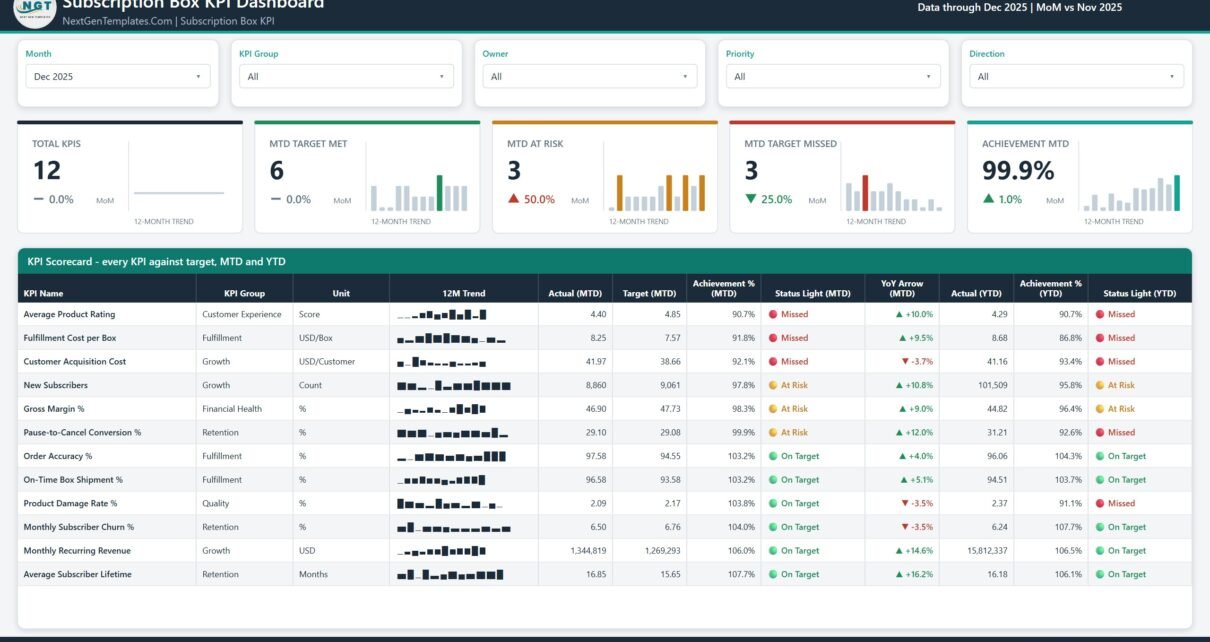
PKComments Off on Subscription Box KPI Dashboard in Power BI
Running a subscription box means watching the same handful of numbers every month: how many people joined, how many left, what a box costs to pack and ship, and whether
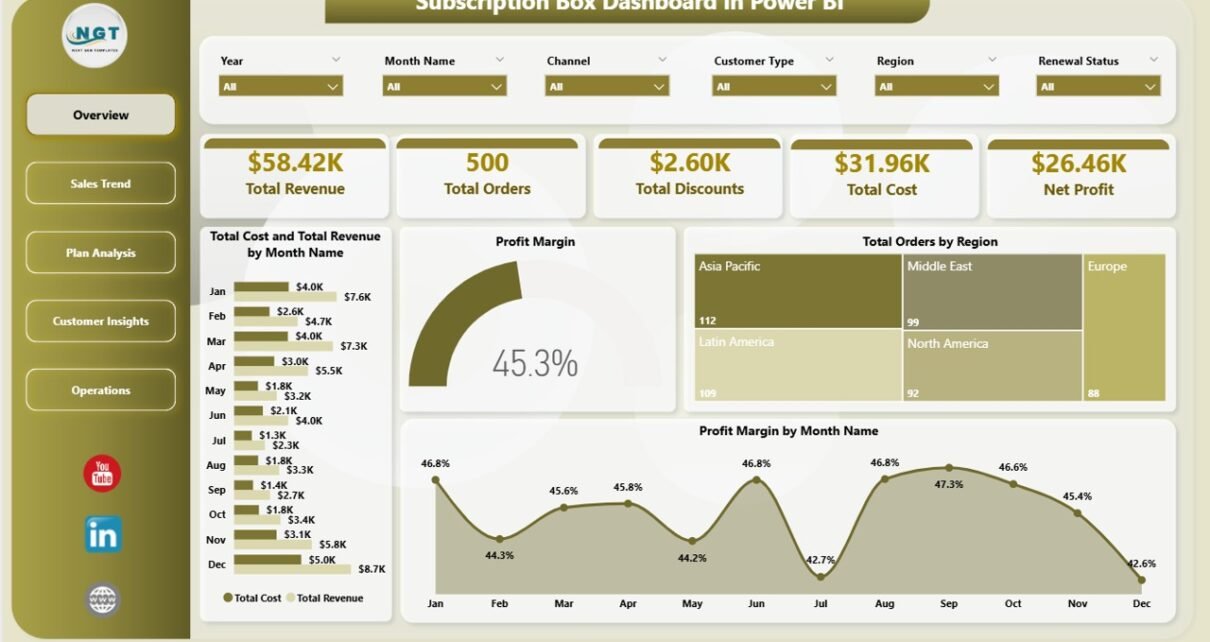
PKComments Off on Subscription Box Dashboard in Power BI
The Subscription Box Dashboard in Power BI packs 5 KPI cards, 16 charts, and 5 fully interactive pages into a single .pbix file priced at $17.99 — replacing $99-499/month vertical
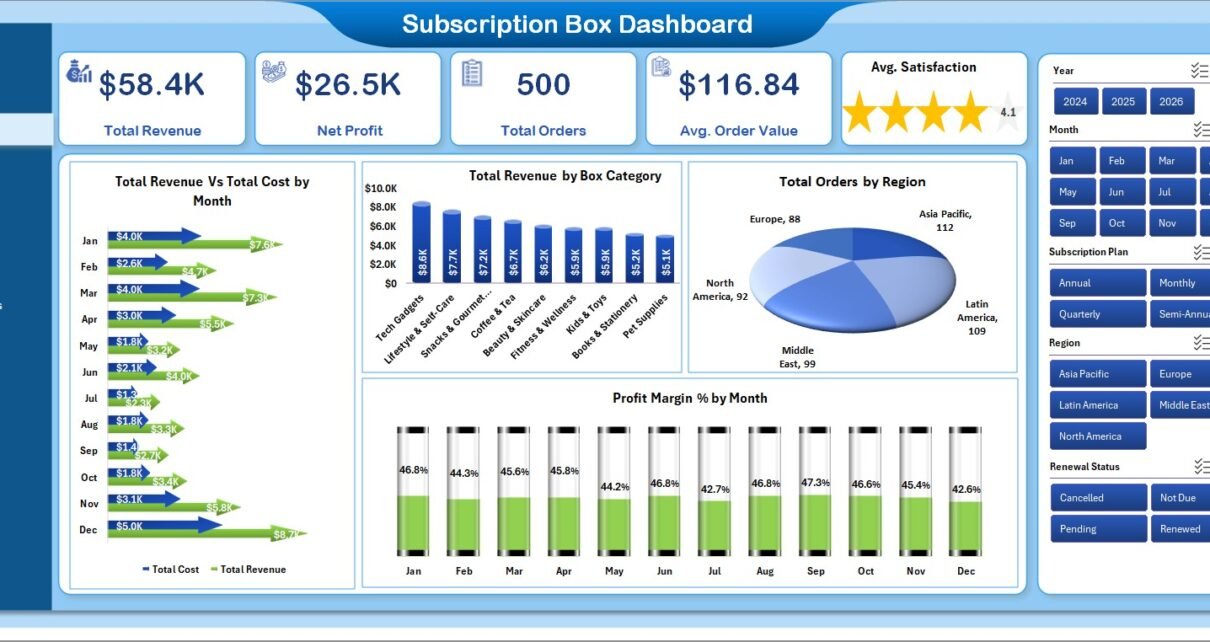
PKComments Off on Subscription Box Dashboard in Excel
Subscription box revenue is volatile. One quarter your "Quarterly Glow" plan crushes monthly margins, the next month a single bad fulfilment week wipes out three weeks of growth. If you
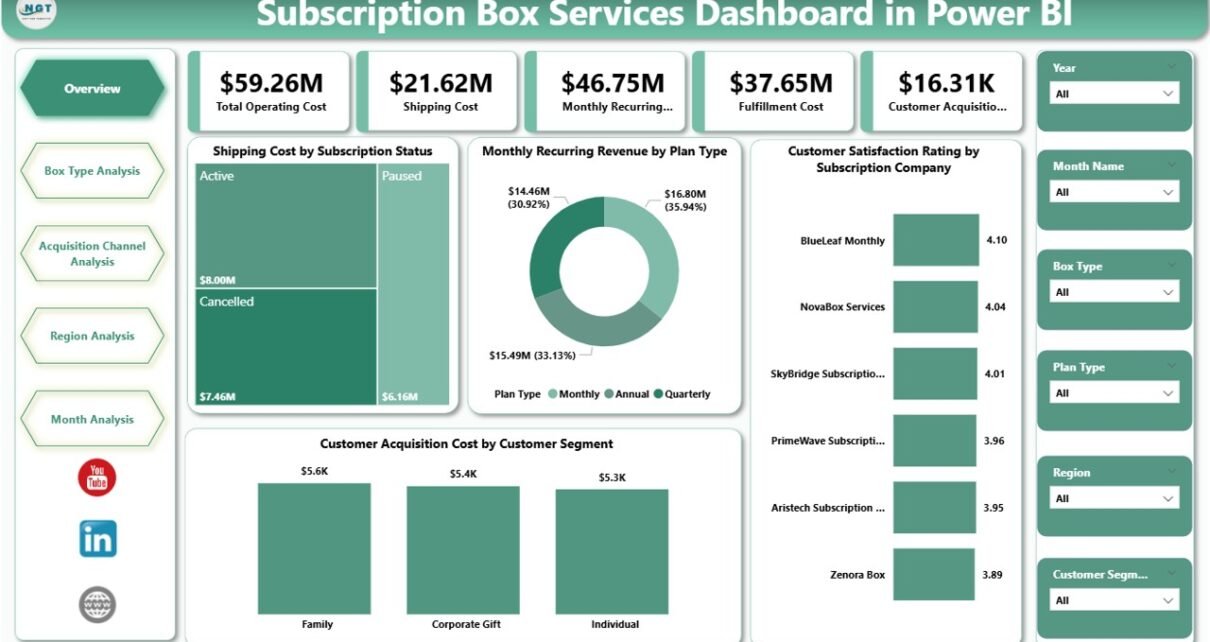
PKComments Off on Subscription Box Services Dashboard in Power BI
The subscription box industry continues to grow rapidly across food, beauty, fashion, wellness, and lifestyle segments. However, growth alone does not guarantee success. Companies must track costs, revenue, customer satisfaction,
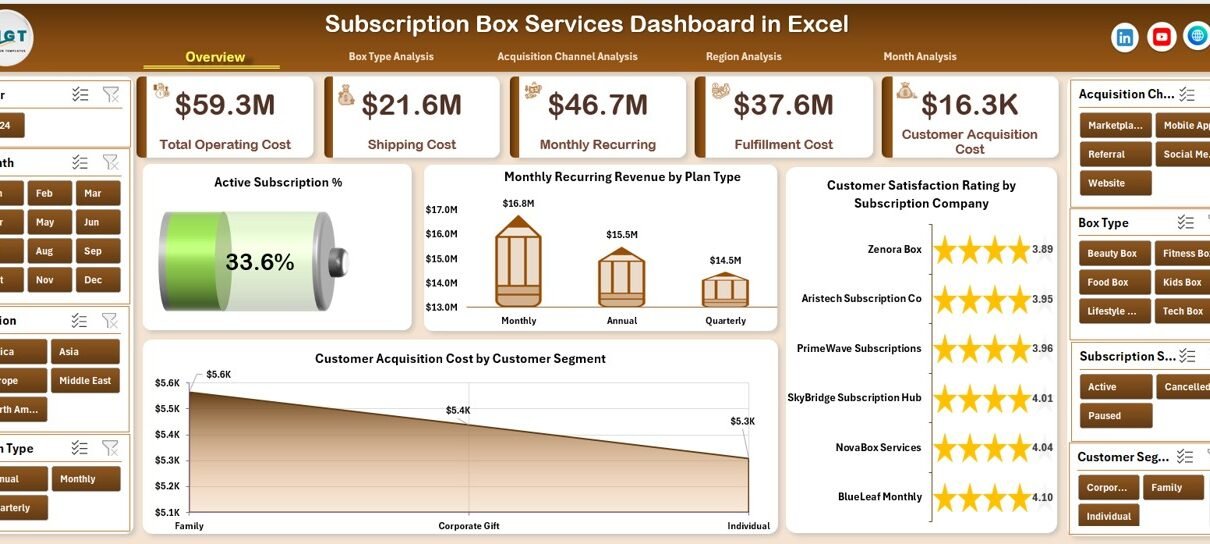
PKComments Off on Subscription Box Services Dashboard in Excel
Subscription box services continue to grow rapidly across industries such as beauty, food, fashion, wellness, books, and lifestyle products. Because customer expectations increase every month, subscription businesses must track performance
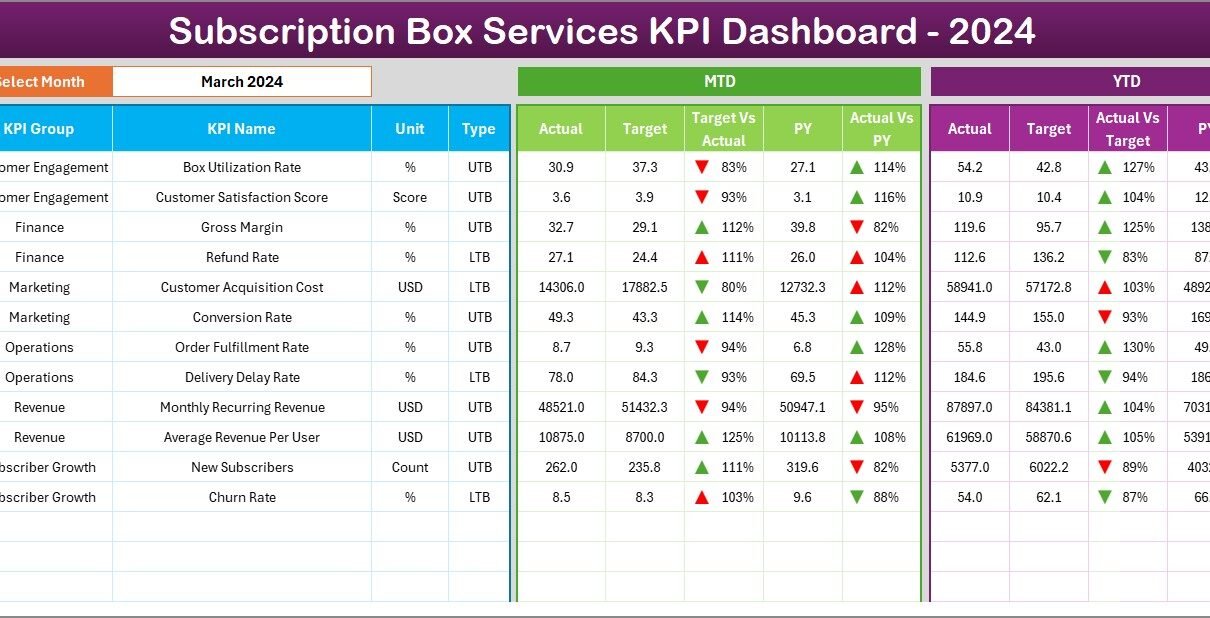
PKComments Off on Subscription Box Services KPI Dashboard in Excel
Subscription box businesses continue to grow rapidly across industries such as beauty, food, fitness, lifestyle, books, and digital services. However, as subscriber counts increase, managing performance using scattered spreadsheets becomes