New: NextGenTemplates Academy - video courses on Excel formulas with AI and Pivot Tables & dashboards. Early-bird: 20% off with code EARLYBIRD20 - first 20 orders only.See the courses →
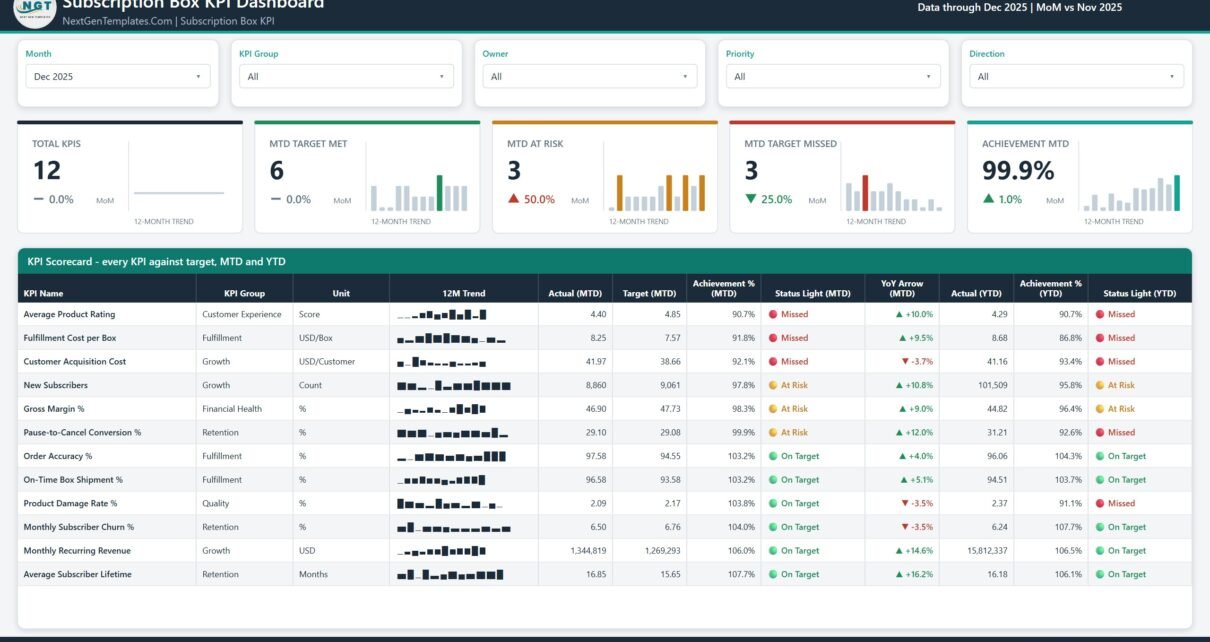
PKComments Off on Subscription Box KPI Dashboard in Power BI
Running a subscription box means watching the same handful of numbers every month: how many people joined, how many left, what a box costs to pack and ship, and whether
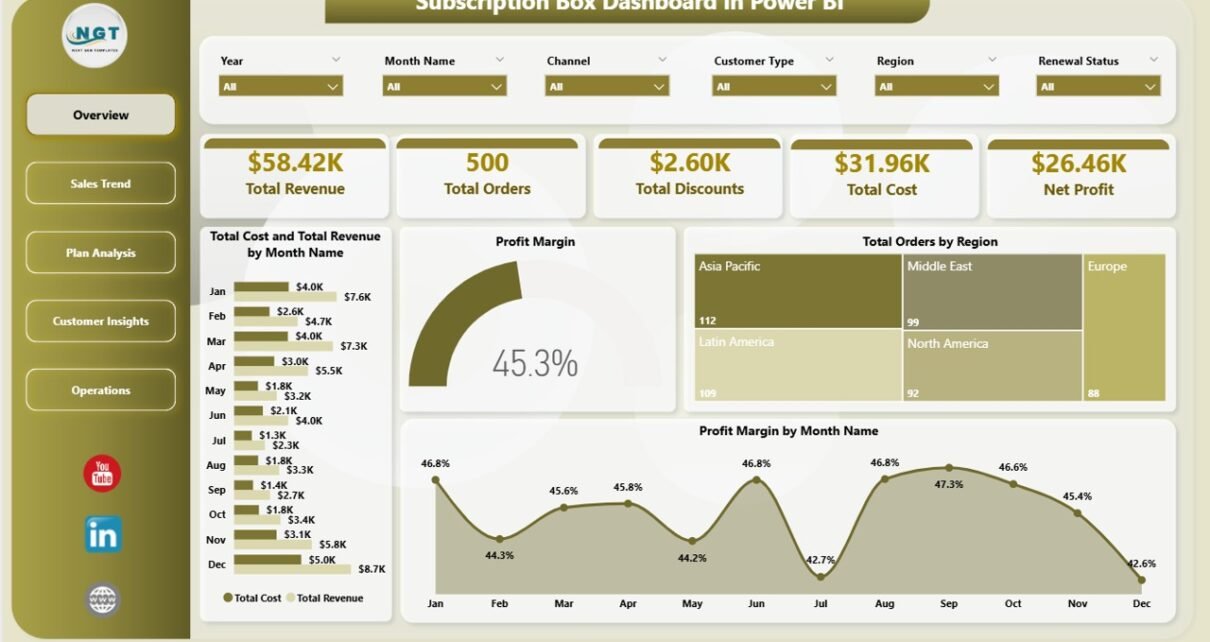
PKComments Off on Subscription Box Dashboard in Power BI
The Subscription Box Dashboard in Power BI packs 5 KPI cards, 16 charts, and 5 fully interactive pages into a single .pbix file priced at $17.99 — replacing $99-499/month vertical
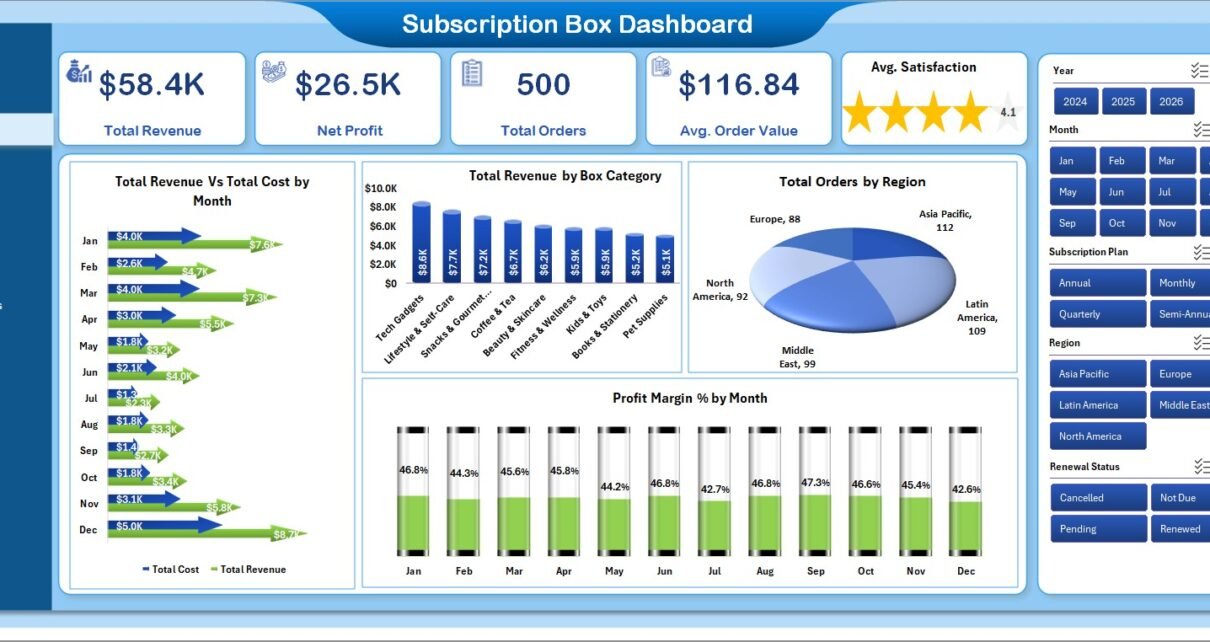
PKComments Off on Subscription Box Dashboard in Excel
Subscription box revenue is volatile. One quarter your "Quarterly Glow" plan crushes monthly margins, the next month a single bad fulfilment week wipes out three weeks of growth. If you
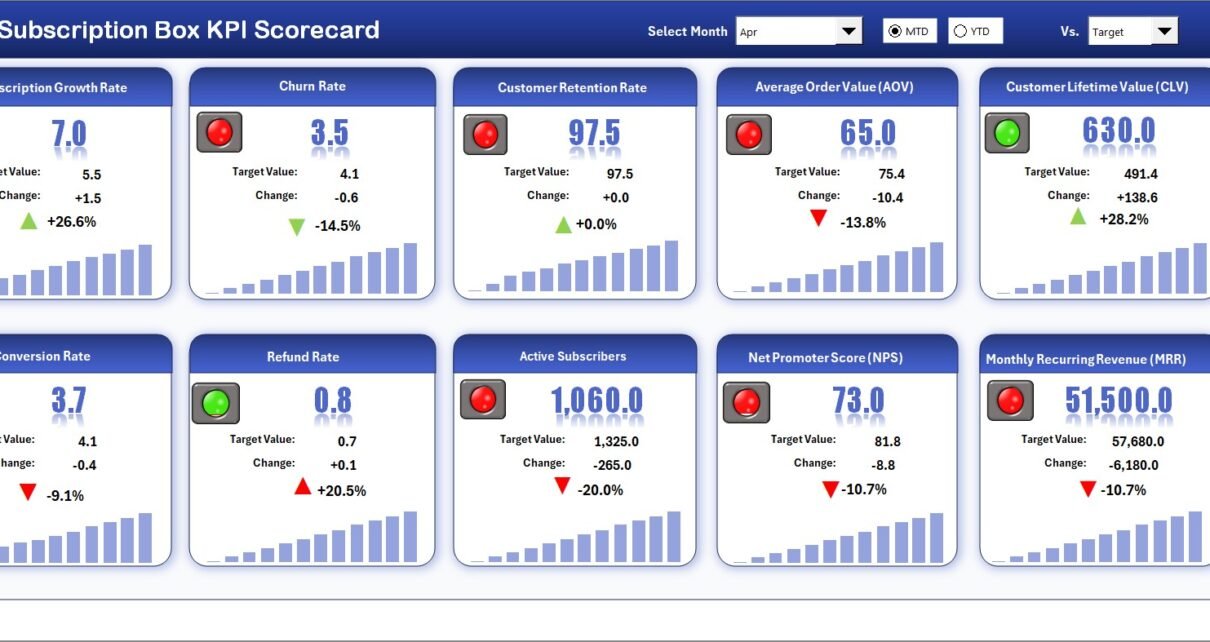
PKComments Off on Subscription Box KPI Scorecard in Excel
Introduction The Subscription Box industry is thriving, making it more important than ever to track key performance indicators (KPIs) efficiently. To help subscription box businesses monitor their progress, optimize operations,
PKComments Off on Subscription Box KPI Dashboard in Excel
The Subscription Box business model has seen exponential growth in recent years, and with the increased competition, it is more important than ever to have a well-structured approach to managing