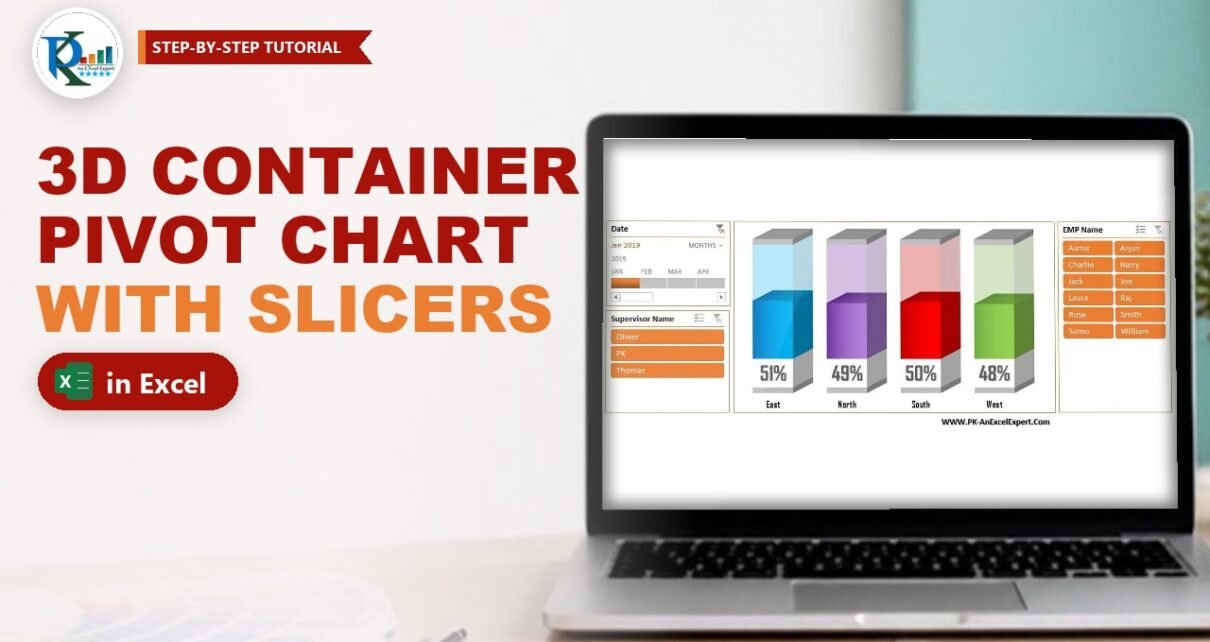
3D Container Pivot Chart in Excel with Slicer and Timeline
A 3D container pivot chart shows a percentage as a liquid level inside a glass-like box: the solid part is what you achieved and the see-through part is what is
Transforming Data into Decisions