Thrift stores continue to grow rapidly across the world. Customers now prefer sustainable shopping, affordable products, and recycled fashion. As a result, thrift store owners must manage donations, pricing, inventory, customer satisfaction, and regional sales performance at the same time. However, many thrift stores still rely on manual spreadsheets and disconnected reports. Consequently, decision-making becomes slow and inefficient.
Therefore, businesses need a structured analytics system that converts raw store data into meaningful insights. That is exactly why the Thrift Stores Dashboard in Excel becomes an essential solution.
In this detailed guide, you will learn everything about the Thrift Stores Dashboard in Excel, including its features, benefits, structure, analytics capabilities, best practices, and frequently asked questions.
Click to Purchases Thrift Stores Dashboard in Excel
What Is a Thrift Stores Dashboard in Excel?
A Thrift Stores Dashboard in Excel is an interactive reporting and analytics tool designed to monitor thrift store performance using a single Excel-based interface.
Instead of checking multiple reports, managers can track revenue, product categories, item conditions, discounts, and customer ratings in one centralized dashboard. Moreover, Excel automation allows users to analyze trends instantly.
In simple terms, the dashboard transforms daily thrift store transactions into visual insights that support faster decisions.
Why Do Thrift Stores Need a Dashboard?
Thrift stores handle unique operational challenges:
-
Donations arrive from different sources
-
Products vary in condition and pricing
-
Inventory changes frequently
-
Regional performance differs significantly
-
Discounts influence profitability
Because of these factors, managers must continuously monitor performance. Therefore, a dashboard helps them understand what works and what needs improvement.
Why Should You Use Excel for Thrift Store Analytics?
Excel remains one of the most powerful tools for business analytics. Furthermore, most organizations already use Excel, which makes adoption easy.
Key Reasons to Use Excel Dashboards
-
Easy data entry and updates
-
No additional software cost
-
Flexible customization
-
Interactive charts and slicers
-
Real-time performance tracking
-
Suitable for small and mid-sized thrift stores
Additionally, Excel allows users to scale analytics gradually without investing in complex BI tools.
Overview of the Thrift Stores Dashboard Structure
The Thrift Stores Dashboard in Excel comes as a ready-to-use solution designed for clarity and usability. The dashboard includes a Page Navigator located on the left side, allowing smooth navigation across analytical pages.
The Excel file contains five analytical pages, along with support and data sheets.
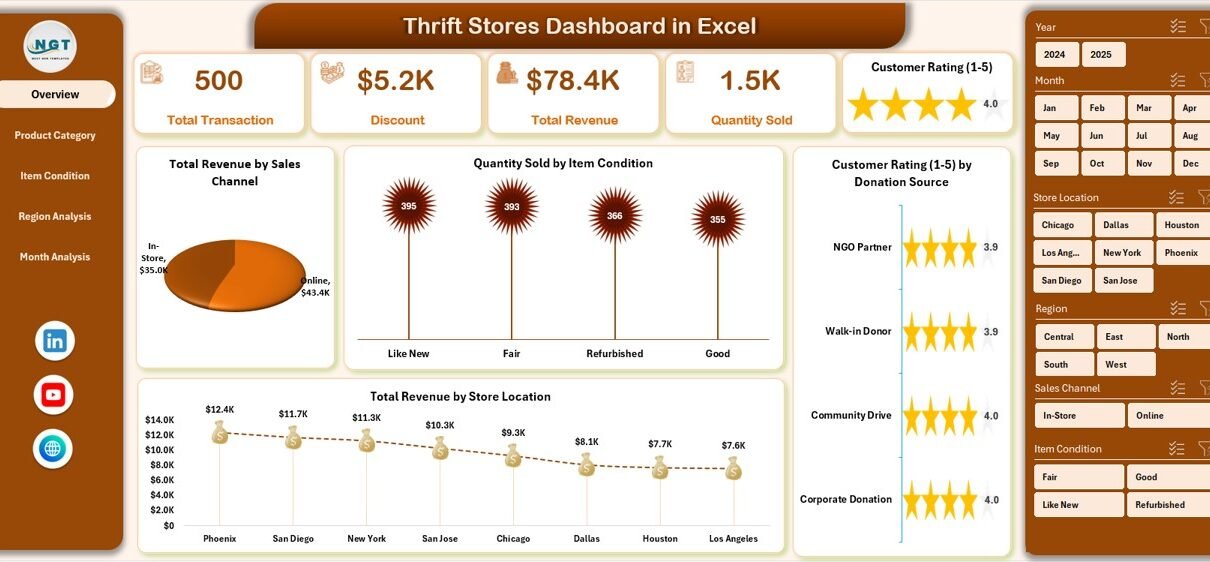
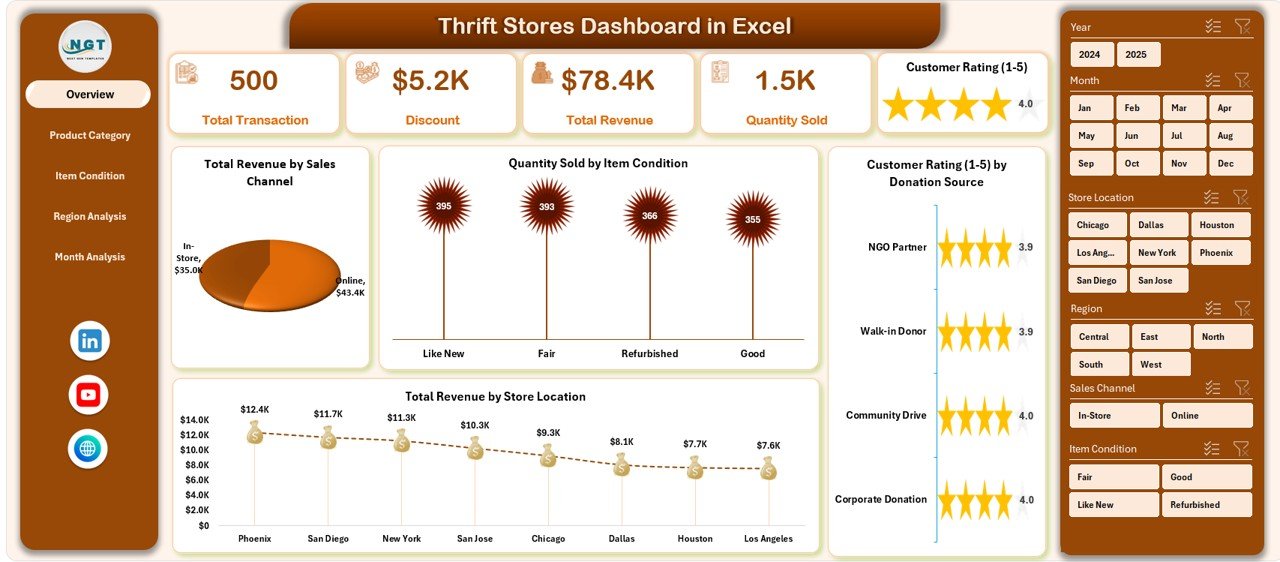
What Does the Overview Page Show?
The Overview Page acts as the command center of the dashboard. It provides a quick snapshot of overall thrift store performance.
Key Elements on the Overview Page
-
Right-side slicers for filtering data
-
Four KPI summary cards
-
Interactive visual charts
Charts Included
-
Total Revenue by Sales Channel
Shows revenue distribution across online, in-store, and other sales channels. -
Quantity Sold by Item Condition
Helps managers understand demand for new, gently used, or refurbished items. -
Customer Rating by Donation Source
Identifies which donation sources produce higher customer satisfaction. -
Total Revenue by Store Location
Compares performance across different thrift store branches.
Because this page provides high-level insights, managers quickly identify performance trends.
How Does Product Category Analysis Improve Decisions?
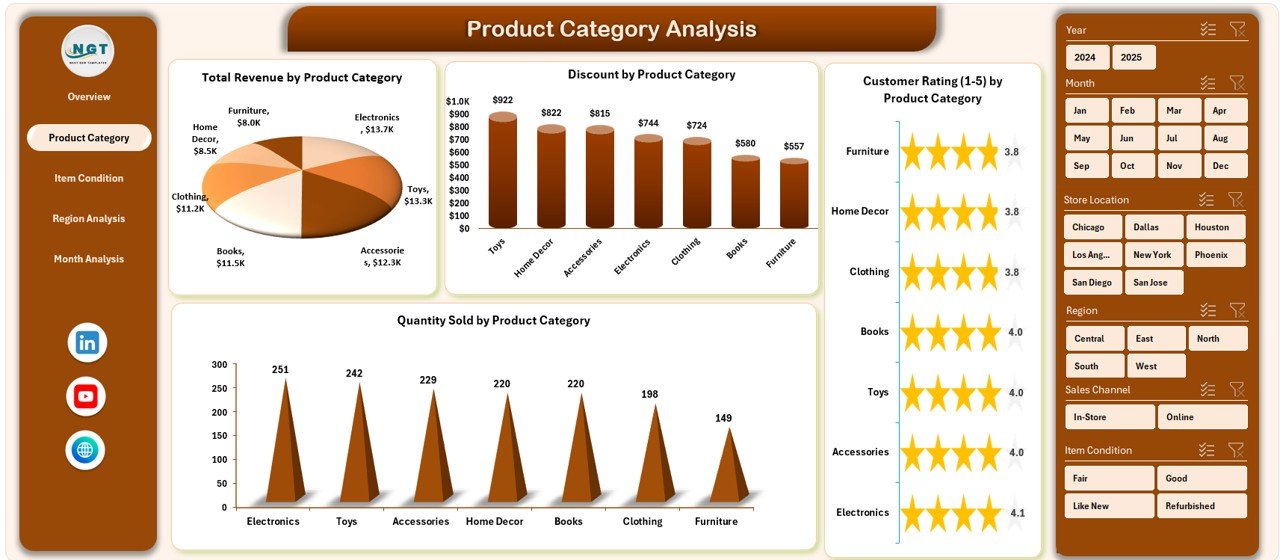
The Product Category Analysis Page focuses on product-level performance. Since thrift stores sell diverse items, category analysis becomes essential.
Visualizations Included
-
Total Revenue by Product Category
-
Quantity Sold by Product Category
-
Customer Rating by Donation Product Category
-
Revenue comparison across categories
-
Click to Purchases Thrift Stores Dashboard in Excel
Why This Page Matters
-
Identifies top-selling categories
-
Detects slow-moving inventory
-
Supports pricing decisions
-
Improves donation acceptance strategy
For example, if furniture generates higher revenue than clothing, managers can prioritize furniture donations.
What Insights Come from Item Condition Analysis?
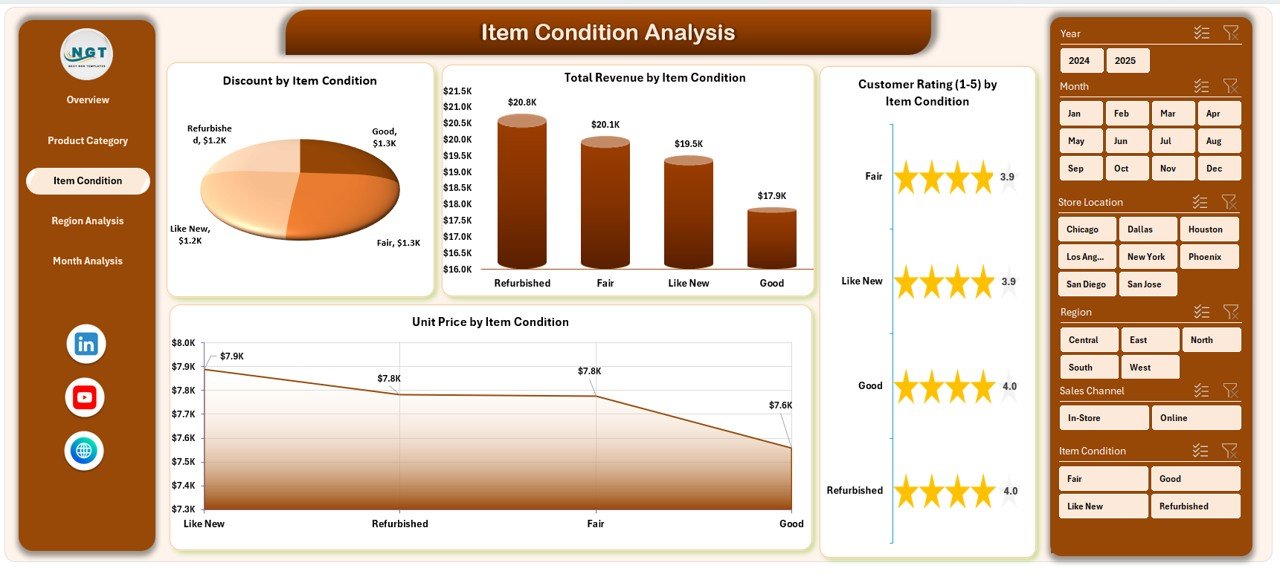
Item condition directly affects pricing and customer perception. Therefore, analyzing condition-based performance becomes critical.
Charts Included
-
Total Revenue by Item Condition
-
Unit Price by Item Condition
-
Customer Rating by Donation Item Condition
-
Revenue comparison by condition
Business Benefits
-
Understand customer preference for item quality
-
Optimize pricing strategies
-
Reduce unsold inventory
-
Improve refurbishment planning
Additionally, managers can decide whether repairing items increases profitability.
Click to Purchases Thrift Stores Dashboard in Excel
Why Is Region Analysis Important for Thrift Stores?
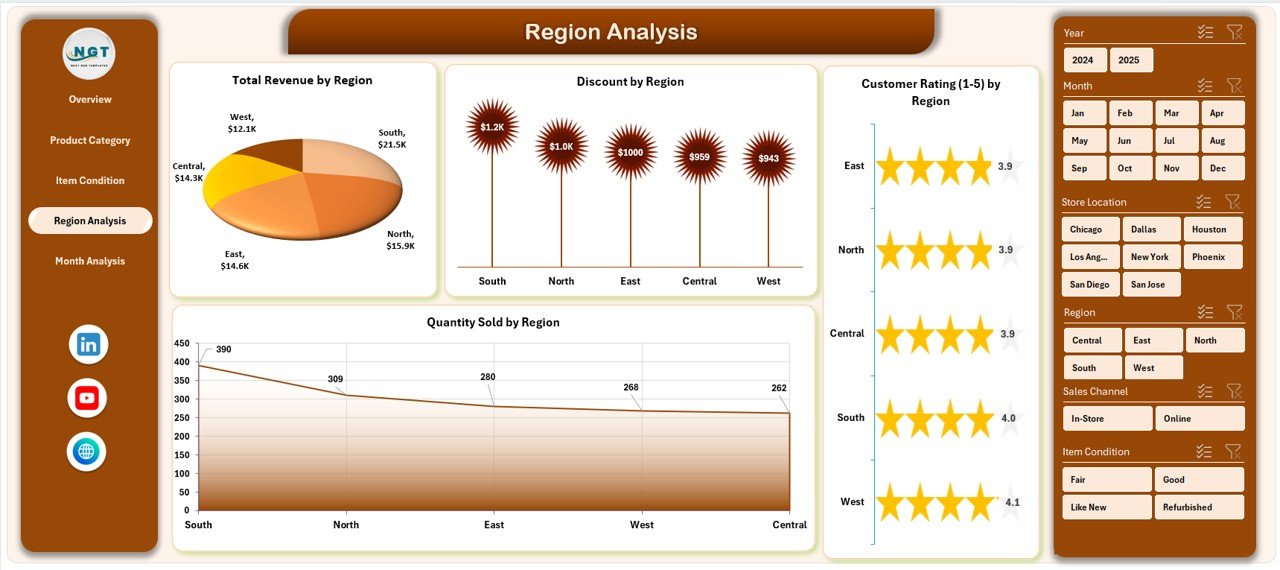
Different regions show different buying behaviors. Consequently, regional analytics help optimize operations.
Charts Included
-
Total Revenue by Region
-
Discount by Region
-
Customer Rating by Donation Region
-
Regional revenue comparison
Key Insights
-
Identify high-performing locations
-
Compare discount effectiveness
-
Evaluate customer satisfaction region-wise
-
Allocate inventory strategically
Because of regional analysis, businesses avoid overstocking low-performing areas.
How Does Month Analysis Help Track Trends?
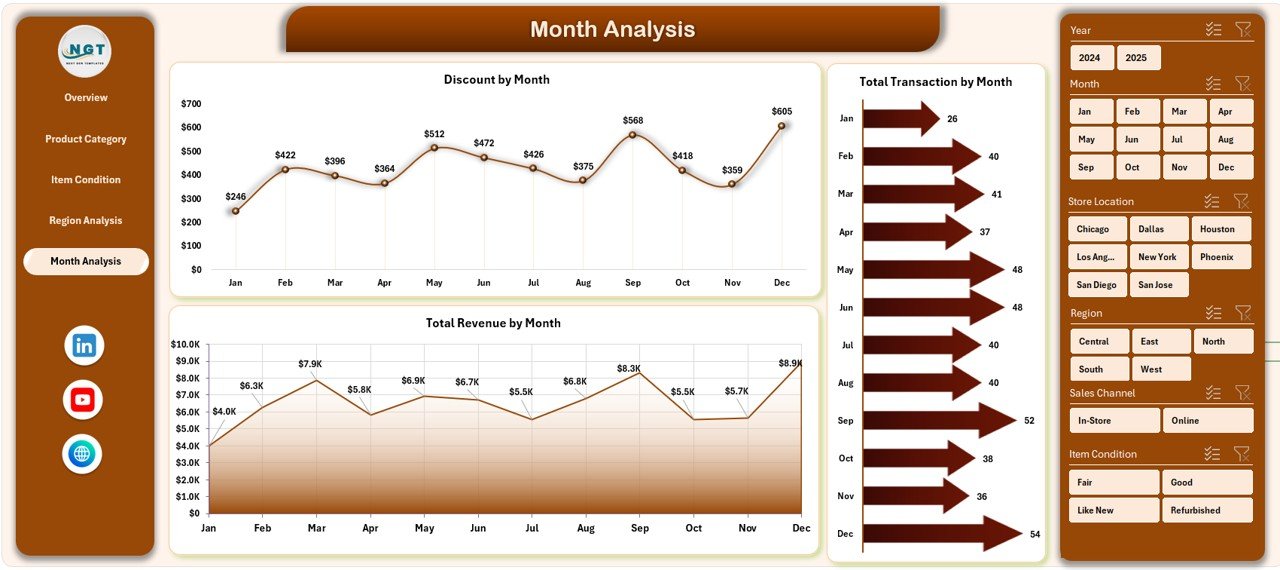
Sales patterns change throughout the year. Therefore, monthly analysis helps businesses prepare for seasonal demand.
Charts Included
-
Total Revenue by Month
-
Discount by Month
-
Monthly revenue trends
Benefits
-
Identify peak shopping seasons
-
Plan promotions effectively
-
Forecast future revenue
-
Adjust staffing levels
For instance, holiday seasons often increase thrift store sales significantly.
Click to Purchases Thrift Stores Dashboard in Excel
What Are the Support and Data Sheets?
Support Sheet
The support sheet works behind the dashboard and stores helper calculations, lookup values, and chart preparation data. As a result, dashboard visuals update automatically.
Data Sheet
The data sheet acts as the main database. Users enter transactional information here, including:
-
Store location
-
Product category
-
Item condition
-
Sales amount
-
Discounts
-
Customer ratings
-
Donation source
Once users update the data sheet, the dashboard refreshes instantly.
Advantages of Thrift Stores Dashboard in Excel
Click to Purchases Thrift Stores Dashboard in Excel
Using a structured dashboard provides several operational and strategic advantages.
✅ Improved Decision Making
Managers view performance instantly and make faster decisions.
✅ Centralized Reporting
All metrics appear in one dashboard instead of multiple files.
✅ Better Inventory Management
Stores identify popular products quickly.
✅ Enhanced Customer Insights
Customer ratings reveal satisfaction trends.
✅ Revenue Optimization
Businesses track profitable categories and regions.
✅ Easy Adoption
Employees already understand Excel, so training becomes simple.
How Does the Dashboard Improve Daily Operations?
The dashboard supports daily management activities such as:
-
Monitoring daily revenue
-
Evaluating donation quality
-
Tracking pricing performance
-
Comparing locations
-
Measuring customer satisfaction
Because managers access real-time insights, they respond faster to operational challenges.
Key KPIs Tracked in a Thrift Stores Dashboard
A strong thrift store dashboard tracks multiple performance indicators.
Sales KPIs
-
Total Revenue
-
Quantity Sold
-
Average Unit Price
-
Discount Percentage
Customer KPIs
-
Customer Rating
-
Repeat Purchase Trends
-
Satisfaction by Category
Inventory KPIs
-
Product Category Performance
-
Item Condition Sales
-
Donation Source Effectiveness
Regional KPIs
-
Revenue by Region
-
Discount Impact
-
Location Performance
How to Use the Thrift Stores Dashboard in Excel?
Using the dashboard remains simple and user-friendly.
Step-by-Step Process
-
Enter data into the Data Sheet
-
Refresh pivot tables if required
-
Use slicers to filter information
-
Navigate pages using the Page Navigator
-
Analyze charts and KPIs
Because the interface remains intuitive, users start analyzing data immediately.
Best Practices for the Thrift Stores Dashboard in Excel
Click to Purchases Thrift Stores Dashboard in Excel
Following best practices ensures accurate analytics and better results.
✅ Maintain Clean Data
Always avoid duplicate entries and missing values.
✅ Update Data Regularly
Frequent updates improve dashboard accuracy.
✅ Use Consistent Categories
Keep product categories standardized.
✅ Monitor KPIs Weekly
Regular review helps detect issues early.
✅ Avoid Overusing Discounts
Analyze discount impact before launching promotions.
✅ Train Staff on Data Entry
Accurate data leads to reliable insights.
✅ Backup Dashboard Files
Protect business data through regular backups.
Common Challenges Thrift Stores Face Without Dashboards
Many thrift stores operate without structured analytics. Consequently, they face several problems:
-
Unclear revenue sources
-
Overstocked inventory
-
Ineffective promotions
-
Poor donation selection
-
Slow reporting processes
However, dashboards eliminate these challenges by providing visibility and control.
Future Scope of Excel Dashboards for Thrift Stores
Excel dashboards continue to evolve. Businesses can expand functionality by adding:
-
Automated data imports
-
Power Query integration
-
Forecasting models
-
Advanced KPI tracking
-
Power BI connectivity
Therefore, organizations can gradually transition toward advanced analytics while keeping Excel as the foundation.
Who Can Benefit from a Thrift Stores Dashboard?
Many stakeholders gain value from this dashboard.
Store Owners
Monitor profitability and growth.
Operations Managers
Track inventory and performance.
Marketing Teams
Analyze promotions and customer response.
Financial Analysts
Evaluate revenue trends and margins.
Regional Managers
Compare store performance across locations.
Why Does Data Visualization Matter in Retail?
Humans understand visuals faster than raw numbers. Therefore, dashboards improve decision-making speed.
Visual analytics help users:
-
Spot trends instantly
-
Compare categories easily
-
Detect performance gaps
-
Understand customer behavior
As a result, businesses move from reactive management to proactive strategy.
How Does This Dashboard Support Sustainable Retail?
Click to Purchases Thrift Stores Dashboard in Excel
Thrift stores promote sustainability by encouraging reuse and recycling. Additionally, dashboards enhance sustainability efforts by:
-
Reducing unsold inventory
-
Optimizing donation acceptance
-
Improving product lifecycle management
-
Supporting eco-friendly retail decisions
Thus, analytics directly supports sustainable business growth.
Conclusion
The Thrift Stores Dashboard in Excel provides a powerful yet simple solution for managing thrift store operations efficiently. Instead of relying on scattered spreadsheets, businesses gain a centralized platform for monitoring revenue, inventory, customer satisfaction, and regional performance.
Moreover, interactive charts, slicers, and structured analytics enable faster decisions and improved profitability. Because Excel remains accessible and flexible, organizations of any size can implement this dashboard easily.
Ultimately, thrift stores that adopt data-driven decision-making achieve better operational control, stronger customer satisfaction, and sustainable growth.
Frequently Asked Questions (FAQs)
1. What is a Thrift Stores Dashboard in Excel?
It is an interactive Excel tool that tracks thrift store KPIs such as revenue, product performance, customer ratings, and regional analytics.
2. Who should use this dashboard?
Store owners, managers, analysts, and retail decision-makers can use it to monitor performance.
3. Do I need advanced Excel skills to use it?
No. The dashboard uses a user-friendly design, so basic Excel knowledge works well.
4. Can I customize the dashboard?
Yes. You can modify charts, KPIs, and categories according to business needs.
5. How often should I update the data?
You should update data daily or weekly for accurate insights.
6. Does the dashboard support multiple store locations?
Yes. The regional analysis section allows performance comparison across locations.
7. Can this dashboard help increase profits?
Yes. It identifies high-performing categories and pricing opportunities, which improves profitability.
8. Is Excel suitable for retail analytics?
Yes. Excel provides powerful analytics features, especially for small and medium businesses.
Visit our YouTube channel to learn step-by-step video tutorials