The personal care and beauty industry thrives on innovation, customer satisfaction, and precise business performance tracking. Whether you manage a salon chain, skincare brand, cosmetics retailer, or wellness center, keeping track of daily operations and performance metrics is vital for growth. However, many organizations still rely on scattered reports, making it difficult to measure real progress.
That’s where the Personal Care & Beauty KPI Dashboard in Excel comes in. This smart, ready-to-use dashboard template helps businesses analyze their operational, financial, and customer-related performance through structured data and visual insights — all in one Excel file.
By combining simplicity and analytical power, this dashboard makes it easy to identify trends, track KPIs, and make informed business decisions.
Click to buy Personal Care & Beauty KPI Dashboard in Excel
What Is a Personal Care & Beauty KPI Dashboard in Excel?
A Personal Care & Beauty KPI Dashboard is a visual analytics tool built entirely in Microsoft Excel. It consolidates multiple data points — from customer feedback to sales performance — into one centralized location.
Instead of juggling multiple spreadsheets or systems, this dashboard offers a complete, interactive view of how your beauty business performs across months, products, and service categories.
It helps track:
- Product sales and revenue growth
- Customer satisfaction ratings
- Inventory levels
- Service utilization
- Profit margins and cost efficiency
- Employee performance metrics
By visualizing these KPIs through dynamic charts and interactive dropdowns, managers can make faster, data-driven decisions that enhance overall business performance.
Structure of the Personal Care & Beauty KPI Dashboard
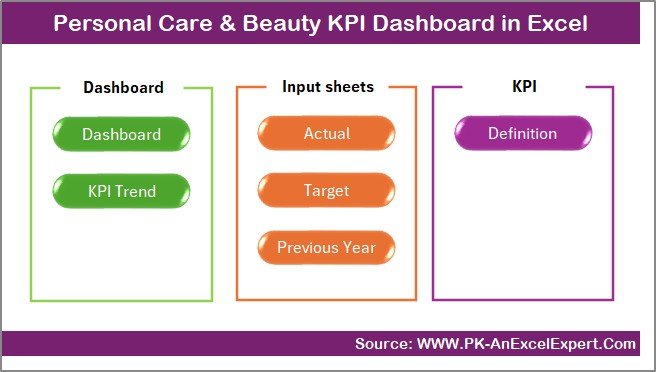
This dashboard includes seven organized worksheets, each with a specific purpose to streamline your KPI tracking process.
Summary Page
The Summary Page works as an index sheet — your control center for navigation. It includes six interactive buttons that allow you to jump directly to any of the dashboard’s sections.
This setup makes it effortless to explore different analysis areas without scrolling through sheets manually. It’s ideal for presentations or when multiple team members use the same file.
Click to buy Personal Care & Beauty KPI Dashboard in Excel
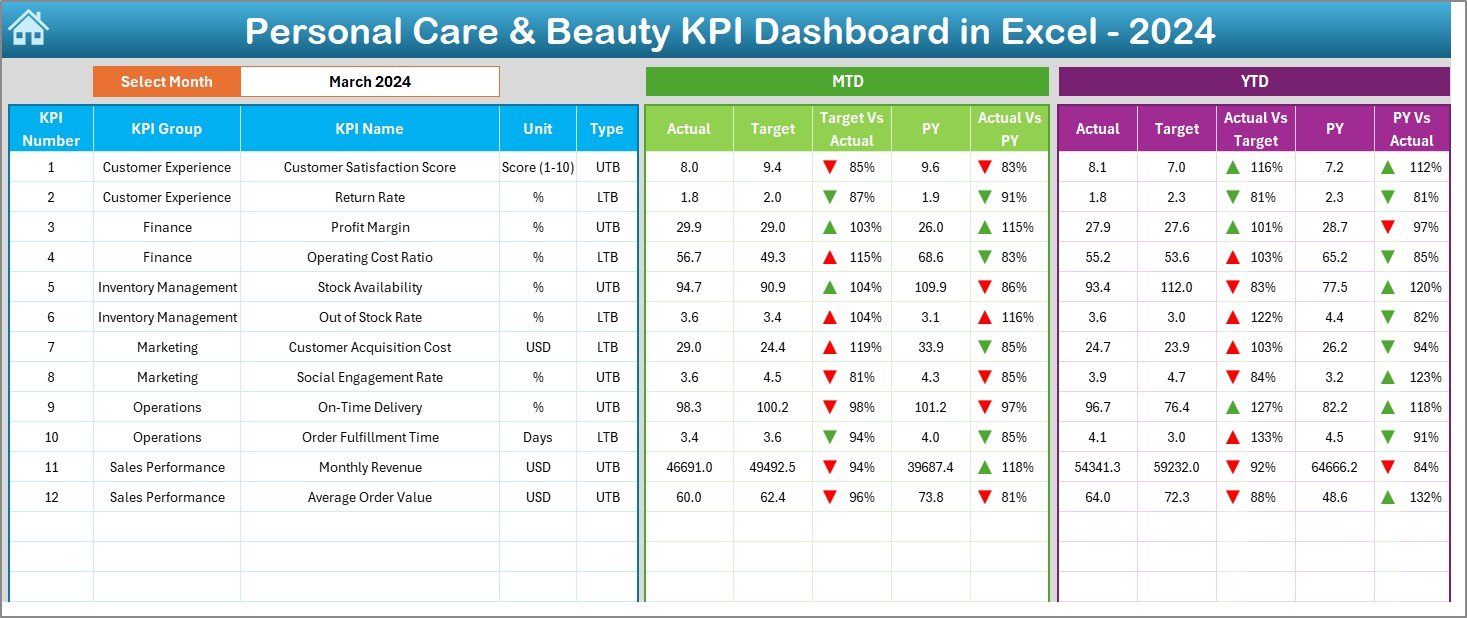
Dashboard Sheet Tab
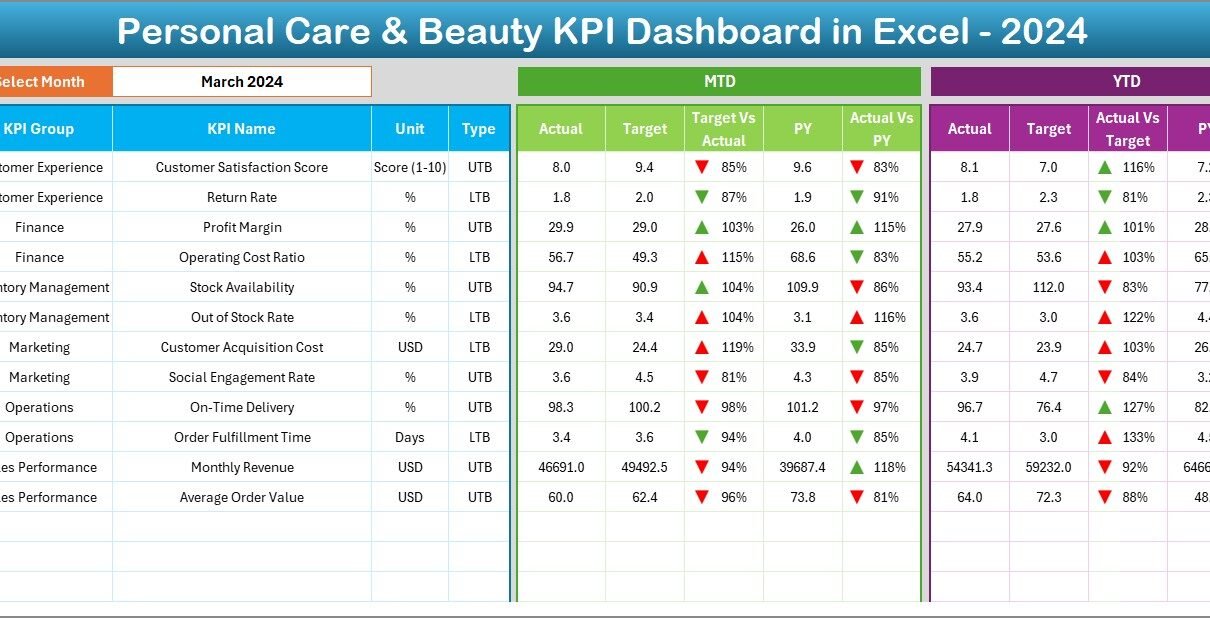
The Dashboard Sheet is the heart of the entire system — the visual hub where all insights come together.
On cell D3, you can select any month from a dropdown menu. Once you choose a month, all metrics and visuals update instantly, displaying real-time progress for that specific period.
It displays both MTD (Month-to-Date) and YTD (Year-to-Date) comparisons for:
- Actual vs Target Performance
- Previous Year vs Current Year Trends
To make interpretation easier, conditional formatting with up/down arrows automatically highlights performance improvements or declines.
This dynamic dashboard sheet enables:
- Quick monthly reviews
- KPI variance analysis
- Immediate performance insights
Click to buy Personal Care & Beauty KPI Dashboard in Excel
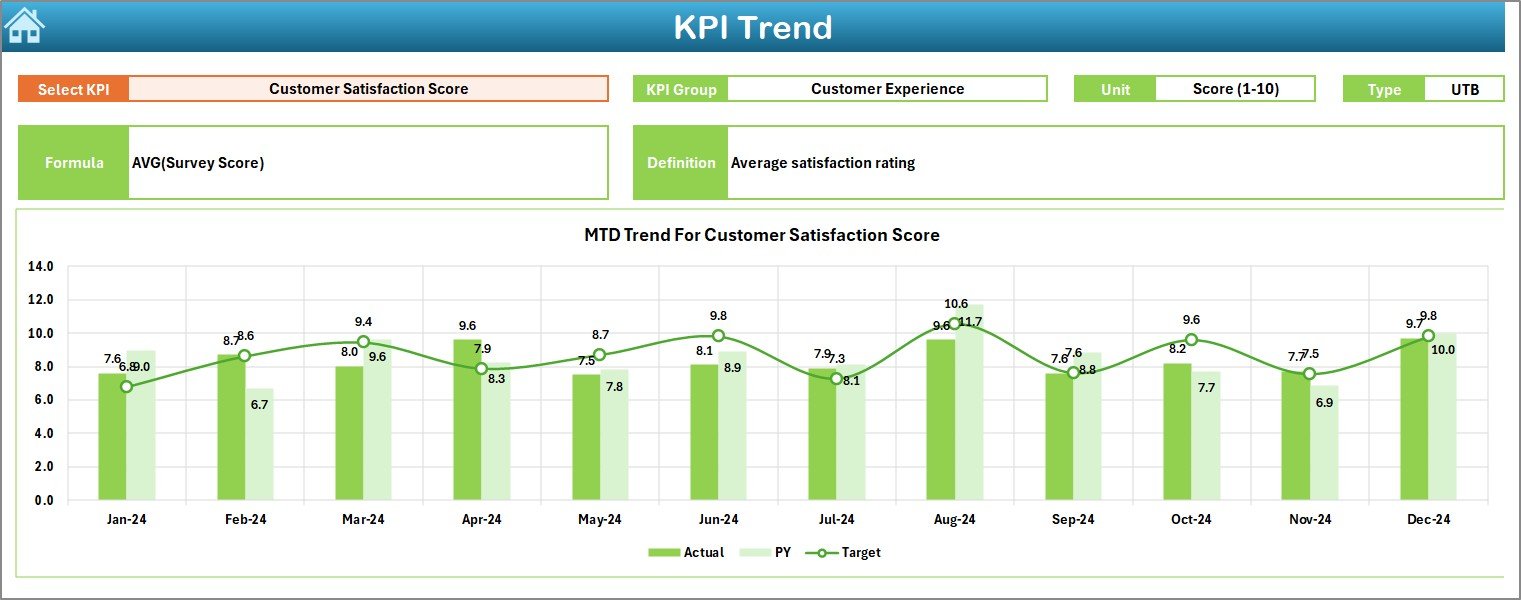
Trend Sheet Tab
The Trend Sheet helps you analyze the progress of individual KPIs over time.
From a dropdown menu in cell C3, you can select any KPI you wish to study. The sheet then automatically displays:
- KPI Group
- Unit of measurement
- KPI Type (LTB – Lower the Better, UTB – Upper the Better)
- Formula used
- Definition for reference
The dashboard also visualizes MTD and YTD trend charts for Actual, Target, and Previous Year data — helping you understand whether your KPIs are improving or require attention.
For example, a beauty salon owner can track “Customer Retention Rate (%)” or “Average Revenue per Visit (USD)” over months to spot seasonal trends.
Click to buy Personal Care & Beauty KPI Dashboard in Excel
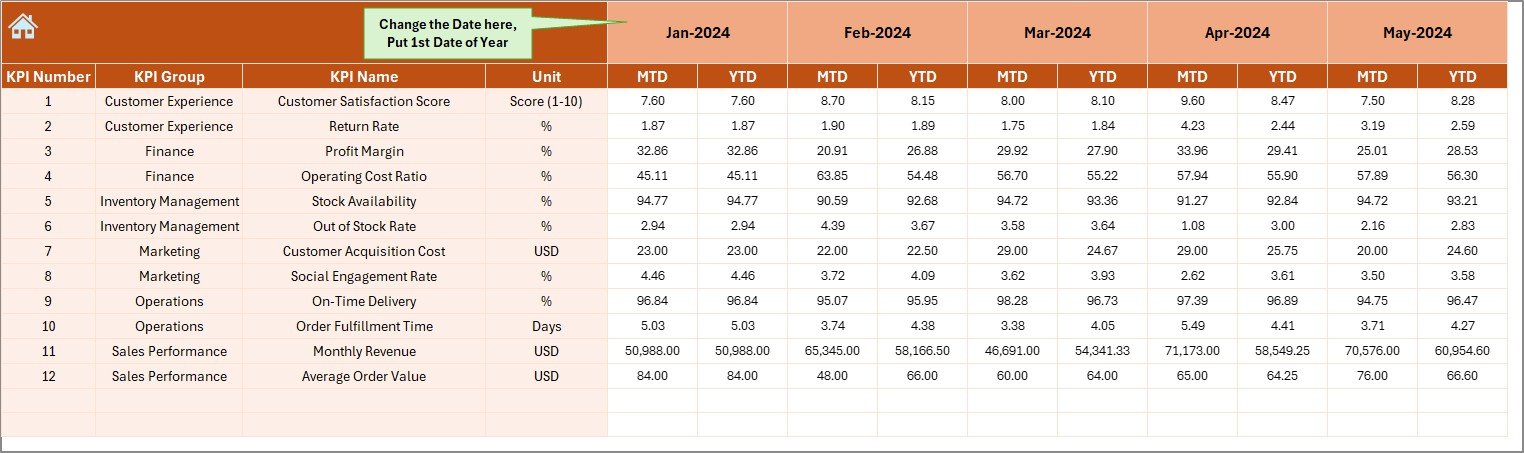
Actual Numbers Input Sheet
This sheet is the data entry zone for your actual performance values.
Here you input MTD and YTD actuals for each KPI based on the current month’s results.
The month configuration begins in cell E1 — simply enter the first month of your financial year, and the dashboard automatically adjusts subsequent months.
This flexibility allows you to adapt the template to your fiscal cycle, whether it starts in January, April, or any other month.
Target Sheet Tab
The Target Sheet allows you to input the planned performance numbers for each KPI — both MTD and YTD.
It serves as a baseline against which actual results are compared. This section ensures performance monitoring stays goal-oriented.
For instance:
- “Monthly Revenue Target (USD)”
- “Customer Satisfaction Target (1-10 Scale)”
- “Inventory Turnover Goal (%)”
By entering these values, the dashboard automatically calculates variance and progress percentage.
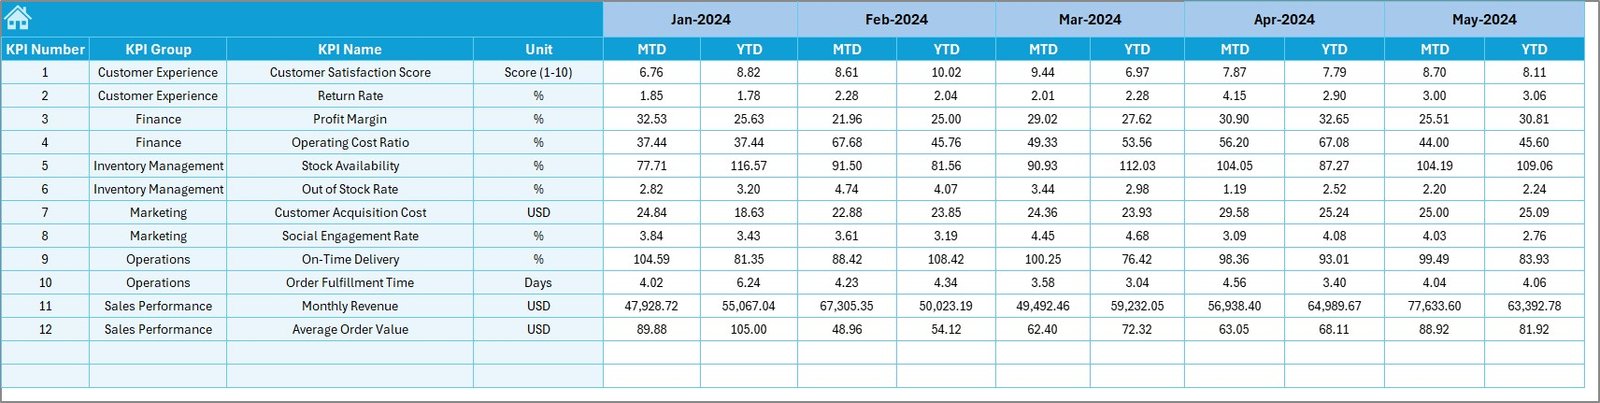
Previous Year Numbers Sheet
This tab is crucial for year-over-year comparison.
Here, you record the same set of KPIs for the previous financial year. The dashboard then uses this data to generate PY vs CY comparisons, helping you evaluate performance growth or decline over time.
It’s especially useful for seasonal businesses — like skincare or cosmetic retail — where yearly performance patterns matter for planning campaigns and stocking products.
KPI Definition Sheet
The KPI Definition Sheet acts as your reference library.
It stores detailed information about each KPI, including:
- KPI Name
- KPI Group
- Unit of measurement
- Formula
- Short Definition
This sheet promotes clarity and ensures everyone in your organization understands how each KPI is calculated. It’s particularly helpful for training new employees or aligning teams during performance reviews
Advantages of the Personal Care & Beauty KPI Dashboard in Excel
Using this dashboard offers several benefits that go beyond manual reporting.
- Centralized Data Management
All KPIs — sales, customer feedback, inventory, and performance — live in one Excel file. No more jumping between multiple sheets or applications.
- Real-Time Analysis
Dynamic dropdowns and automated formulas ensure you see updated numbers for any month or KPI with just one click.
- Visual Insights
Charts, arrows, and color-coded indicators provide clear performance signals — helping teams quickly identify areas of success or concern.
- Easy Customization
Because it’s built in Excel, anyone with basic spreadsheet knowledge can modify the KPIs, formulas, or visuals.
- Performance Comparison
The inclusion of Previous Year and Target sheets enables detailed MTD, YTD, and YOY performance comparisons — ideal for strategy meetings or management reviews.
- Cost-Effective & Accessible
Unlike expensive BI tools, this Excel dashboard provides advanced analytics without any software installation or technical expertise.
How the Dashboard Helps in Decision-Making
This dashboard empowers decision-makers at every level:
- Salon Owners can monitor revenue, appointment frequency, and satisfaction scores to optimize customer experience.
- Product Managers can analyze sales trends and adjust marketing strategies accordingly.
- Finance Teams can measure profitability, cost per unit, and other financial metrics in real time.
- HR Managers can track staff efficiency, overtime hours, and service quality metrics.
By centralizing insights, the dashboard supports smarter, data-driven decisions that improve performance, reduce waste, and increase profitability.
Best Practices for Using the Personal Care & Beauty KPI Dashboard
To make the most of this Excel template, follow these best practices:
- Define Your KPIs Clearly
Before inputting data, finalize your list of measurable KPIs aligned with business objectives. Example: “Customer Retention Rate” or “Average Order Value.”
- Maintain Consistent Data Entry
Ensure all users follow uniform data formats (e.g., percentages, decimals). Consistency keeps charts and formulas accurate.
- Update Data Regularly
Enter actual numbers monthly or weekly to keep dashboards fresh and meaningful.
- Use Conditional Formatting Wisely
Highlight critical values like missed targets or exceptional achievements to quickly grab attention.
- Review Trend Charts Monthly
Analyze monthly and YTD charts to detect patterns early — enabling proactive action rather than reactive correction.
- Secure and Backup Your File
Because this dashboard is Excel-based, keep backups and password-protect the workbook to prevent accidental edits.
- Customize Visualization Elements
Add your company’s logo, adjust color themes, and personalize slicers to match your brand style.
For small and mid-sized beauty enterprises, this makes Excel-based dashboards a smart and scalable choice.
Conclusion
In today’s competitive beauty and personal care industry, staying ahead requires data-driven decisions. The Personal Care & Beauty KPI Dashboard in Excel simplifies performance monitoring, providing actionable insights at your fingertips.
It bridges the gap between raw data and meaningful analysis — empowering you to track progress, identify trends, and enhance overall performance.
Frequently Asked Questions (FAQs)
- What is a KPI Dashboard in Excel?
A KPI Dashboard in Excel is a visual reporting tool that displays key performance indicators in charts, tables, and cards — helping businesses monitor results efficiently.
- How can the Personal Care & Beauty KPI Dashboard help my salon or spa?
It helps you track performance metrics like sales, customer satisfaction, service quality, and profit margins, allowing you to improve operations and profitability.
- Can I customize the KPIs in this dashboard?
Yes. All KPIs, formulas, and labels are editable. You can easily replace them with your own metrics.
- Do I need any advanced Excel knowledge?
Not at all. The dashboard is pre-formatted and ready to use. You only need basic Excel skills to input data and navigate.
- Is this dashboard suitable for both product and service-based beauty businesses?
Absolutely. It works perfectly for both — from skincare brands to salons, spas, and cosmetic retailers.
- Can I add more KPIs or charts?
Yes, the dashboard is flexible. You can insert additional KPIs, charts, or visualizations based on your business needs.
- How often should I update the data?
For best results, update it monthly or weekly to keep insights accurate and actionable.
Visit our YouTube channel to learn step-by-step video tutorials
Watch the step-by-step video tutorial:
Click to buy Personal Care & Beauty KPI Dashboard in Excel