Introduction
Adult literacy is a critical factor in empowering individuals and communities. Efficiently tracking the performance and progress of adult literacy programs is essential for ensuring their success. In this article, we introduce the Adult Literacy Programs KPI Dashboard, a ready-to-use template that simplifies monitoring key performance indicators (KPIs) related to adult literacy initiatives.
Key Features of Adult Literacy Programs KPI Dashboard
- Comprehensive tracking of KPIs including actuals, targets, and previous year data.
- Interactive month selection to dynamically update dashboard metrics.
- Seven well-structured worksheets designed for ease of use and efficient data management.
- Conditional formatting with up/down arrows to instantly visualize performance trends.
- Visualization of trends through charts to monitor monthly and year-to-date progress.
- Clear definitions and formulas for each KPI, helping users understand what metrics mean and how they are calculated.
- User-friendly input sheets for Actual Numbers, Target Numbers, and Previous Year data.
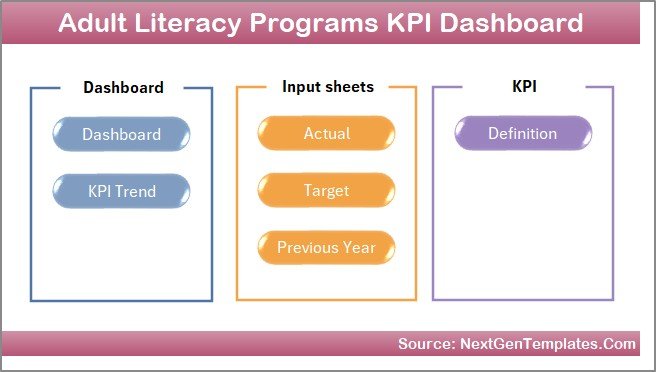
Dashboard Pages Explanation
1. Home Sheet
This serves as the index sheet with six buttons that allow users to quickly jump to respective sheets within the dashboard.
 Home Page
Click to Buy Adult Literacy Programs KPI Dashboard in Excel
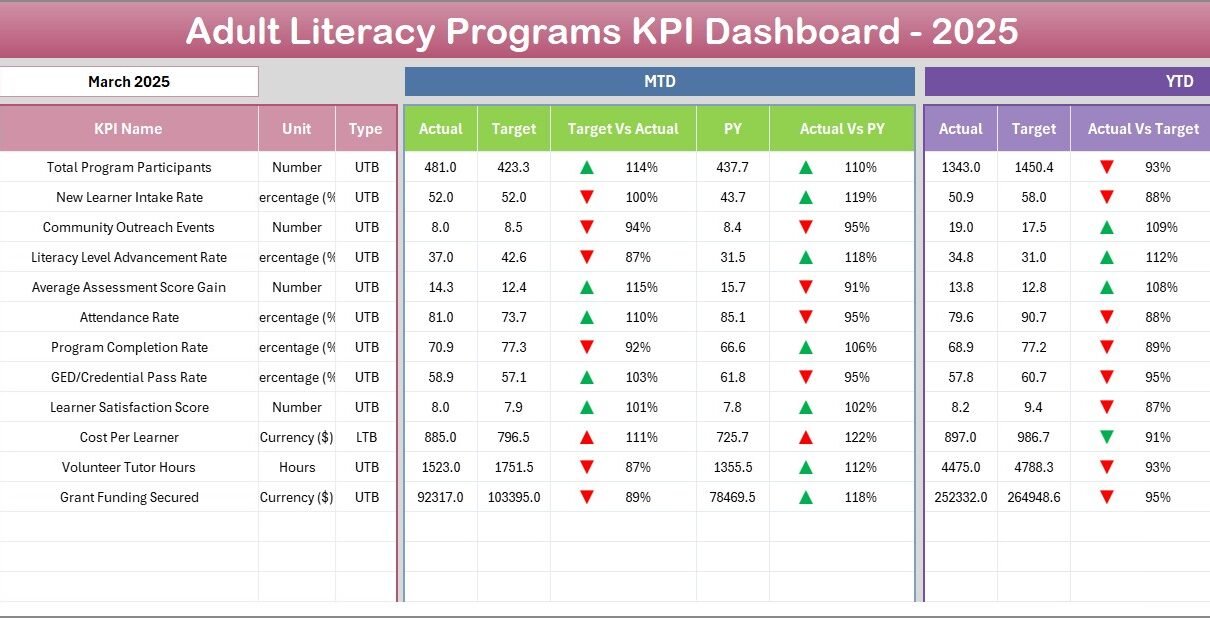
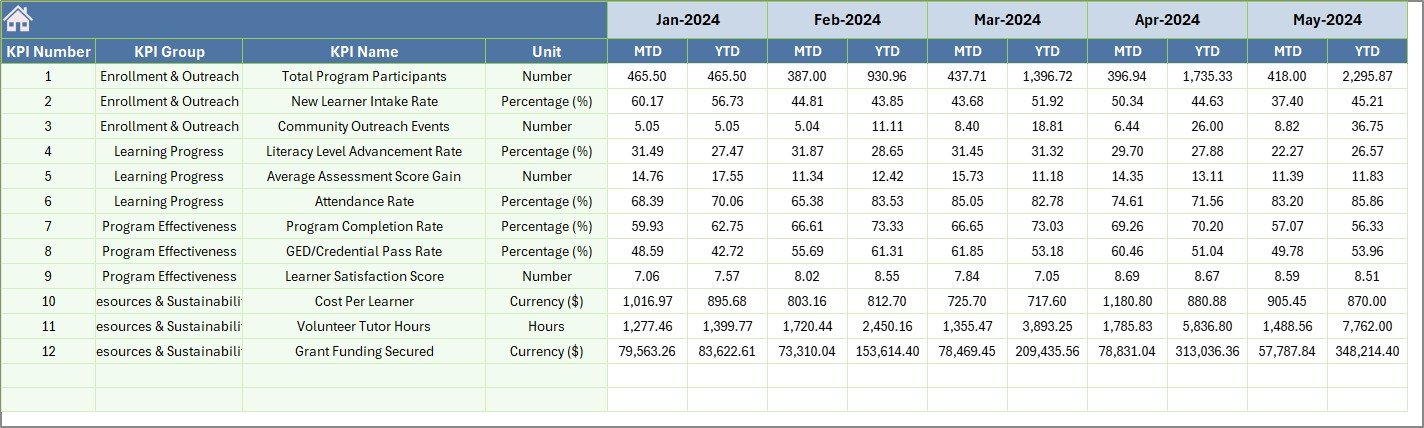
2. Dashboard Sheet Tab
The main control panel where all KPI-related information is summarized. Users can select the month from the drop-down located in cell D3, dynamically adjusting all dashboard numbers for the selected period. It displays both Month-To-Date (MTD) and Year-To-Date (YTD) actuals, targets, and previous year data. Conditional formatting with up and down arrows allows quick visual assessment of Target vs Actual and Previous Year vs Actual performance.
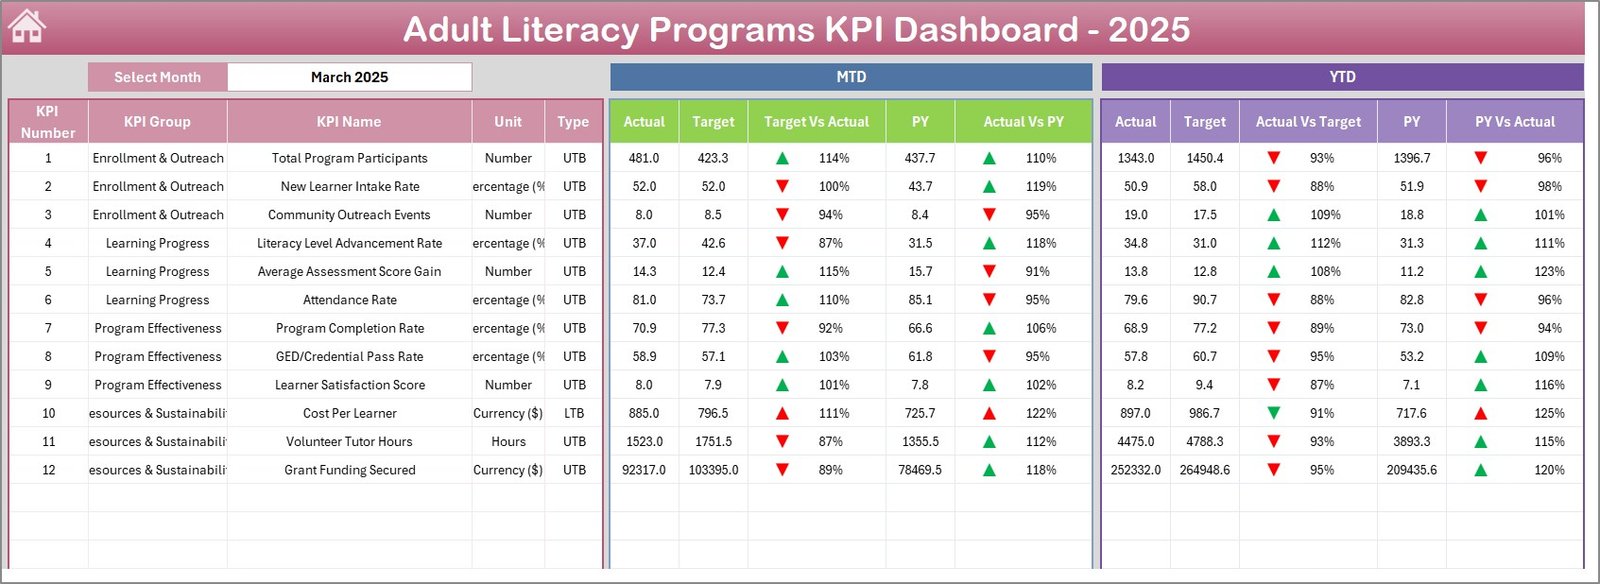 Adult Literacy Programs KPI Dashboard
Click to Buy Adult Literacy Programs KPI Dashboard in Excel
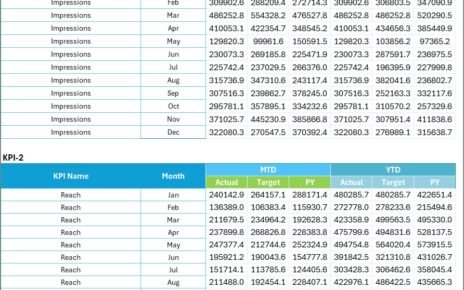
3. KPI Trend Sheet Tab
This sheet allows users to choose a KPI from the drop-down in cell C3. It then displays essential information about the selected KPI, including the KPI Group, Unit of Measurement, Type (Lower The Better or Upper The Better), Formula, and Definition. Additionally, you can view MTD and YTD trend charts for Actual, Target, and Previous Year numbers.
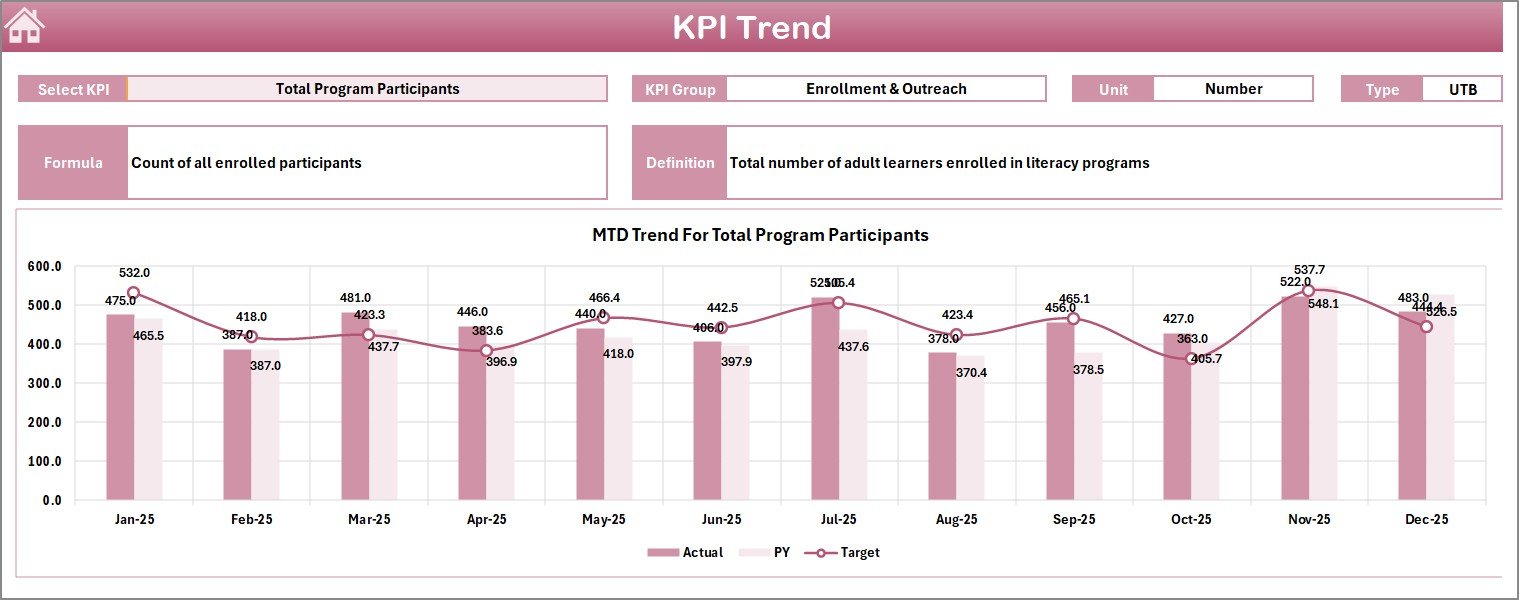 KPI Trend Sheet
Click to Buy Adult Literacy Programs KPI Dashboard in Excel
4. Actual Numbers Input Sheet
Users enter Actual Numbers for MTD and YTD in this sheet. The month can be adjusted by changing the month in cell E1, which allows flexibility in tracking data for different starting months of the year.
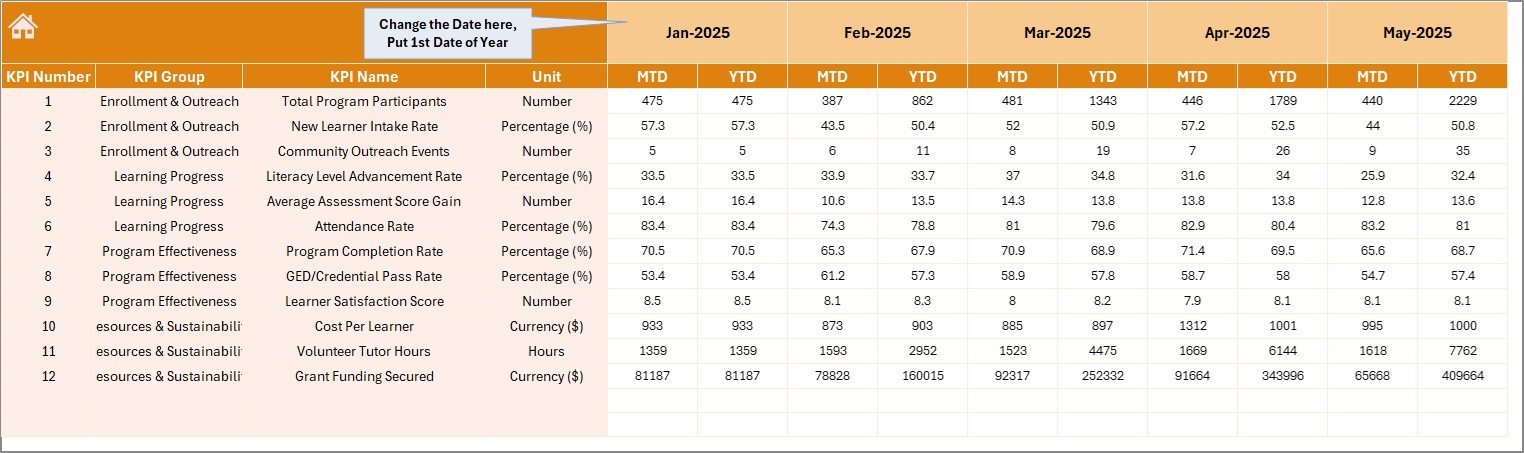 Actual Numbers Input sheet
5. Target Number Input Sheet
This sheet is where you input target goals for each KPI for both MTD and YTD. Structuring targets here ensures that the Dashboard can compare actual performance against these set objectives effectively.
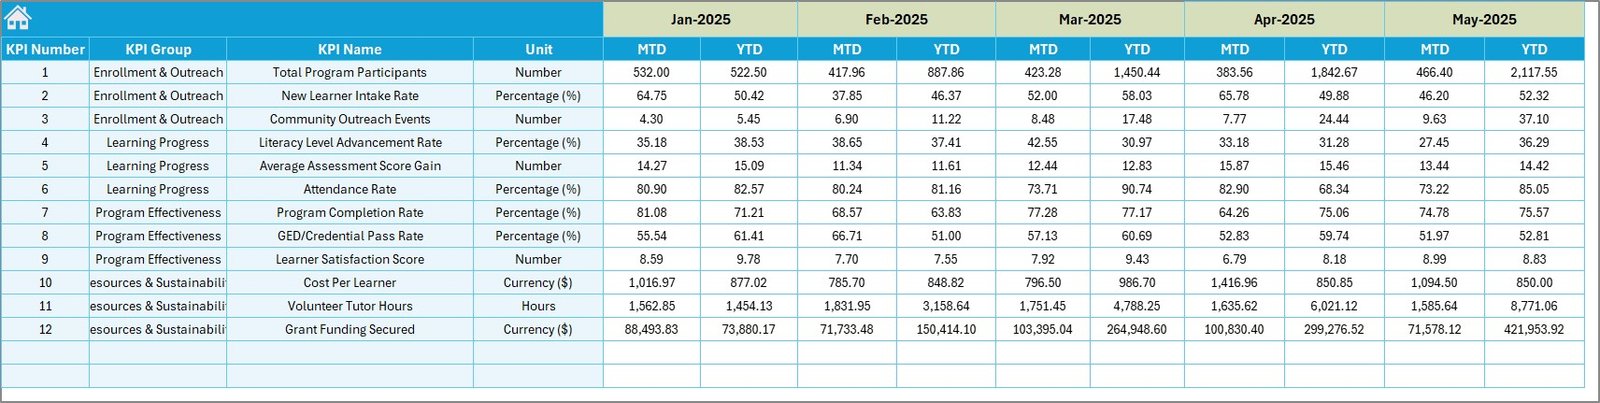 Target Number Input sheet
Click to Buy Adult Literacy Programs KPI Dashboard in Excel
6. Previous Year Number Sheet Tab
Enter the previous year’s corresponding data for KPIs here to enable year-over-year comparisons for better performance analysis.
 Previous Year Number Input sheet
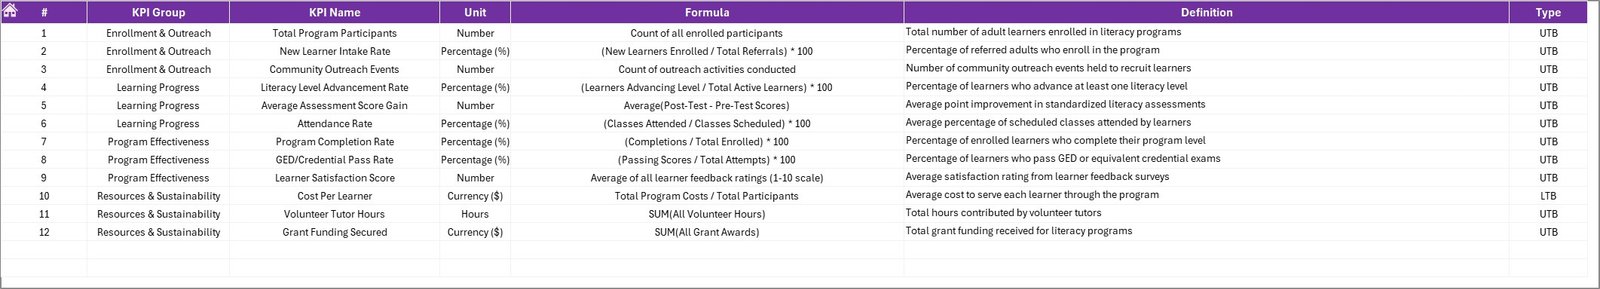
7. KPI Definition Sheet Tab
This sheet holds detailed information about each KPI such as KPI Name, Group, Unit, Formula, and Definition. Users must also specify the KPI Type as either LTB (Lower The Better) or UTB (Upper The Better). This clarity helps ensure accurate interpretation of dashboards.
 KPI Definition sheet
Click to Buy Adult Literacy Programs KPI Dashboard in Excel
Advantages of Adult Literacy Programs KPI Dashboard
- Comprehensive Monitoring: All critical aspects of adult literacy programs are tracked in one integrated dashboard.
- Dynamic Data Filtering: Month selection empowers users to see tailored data relevant to specific periods.
- Easy Data Entry: Clear input sheets for actuals, targets, and past data streamline updates.
- Visual Clarity: Conditional formatting and charts help quickly identify trends and performance gaps.
- Improved Decision Making: Insightful KPI definitions and formula transparency facilitate informed planning.
Opportunities for Improvement
Click to Buy Adult Literacy Programs KPI Dashboard in Excel
- Incorporate automated data connections from other systems for real-time updates.
- Add interactive drill-down options to explore more granular data details.
- Expand visualization options to include heat maps or geographical literacy tracking.
- Include benchmarking features comparing data across regions or demographic groups.
- Integrate user permission settings to enhance data security and access control.
Best Practices
- Regularly update actual and target data to maintain relevance.
- Use the KPI Definition sheet to train new users on dashboard interpretation.
- Leverage conditional formatting to focus attention on critical metrics during reviews.
- Validate data entered in input sheets to prevent errors in your reports.
- Engage stakeholders using the dashboard visuals for transparent progress reporting.
FAQs
Click to Buy Adult Literacy Programs KPI Dashboard in Excel
What KPIs are included in this Adult Literacy Programs Dashboard?
The dashboard supports various KPIs such as Literacy Rate, Program Enrollment, Completion Rates, and other key metrics defined in the KPI Definition sheet.
Can I customize this KPI dashboard?
Yes, the template is fully adaptable. You can add new KPIs, change formulas, include more charts, or adjust input tables as needed.
How often should the data be updated?
For best results, update the actual and target data monthly to keep the dashboard performance insights current.
Is prior Excel or dashboard experience needed to use this template?
Basic familiarity with Excel will help, but the design is user-friendly with guided inputs for ease of use.
Conclusion
Click to Buy Adult Literacy Programs KPI Dashboard in Excel
The Adult Literacy Programs KPI Dashboard is a powerful tool to help organizations effectively monitor and manage their adult literacy initiatives. By consolidating actuals, targets, and previous year data with interactive features and clear visualizations, it supports timely decision-making and transparent reporting. Whether you’re a program manager or a senior stakeholder, this ready-to-use template simplifies performance tracking and helps drive the success of your adult literacy programs.
For more details on advanced Excel dashboards and templates, visit Microsoft Excel Support.
Visit our YouTube channel to watch the demo: Youtube.com/@NextGenTemplates
Click to Buy Adult Literacy Programs KPI Dashboard in Excel