In today’s fast-paced customer service environment, call centres act as the heartbeat of business communication. They handle inquiries, complaints, feedback, and service requests — all while maintaining high standards of efficiency and customer satisfaction.
But with thousands of daily interactions, how can a business measure if its call centre is performing well?
That’s where the Call Centre KPI Scorecard in Excel steps in.
It transforms raw data into actionable insights, allowing managers to track performance, identify gaps, and make smart decisions backed by data.
In this article, you’ll learn everything you need to know about the Call Centre KPI Scorecard in Excel, including its structure, features, advantages, and best practices to ensure your customer support operations stay ahead of the curve.
Click to buy Call Centre KPI Scorecard in Excel
What Is a Call Centre KPI Scorecard in Excel?
A Call Centre KPI Scorecard is an Excel-based tool designed to measure and monitor Key Performance Indicators (KPIs) that define call-centre efficiency and service quality.
It helps call-centre managers track both operational and customer-centric metrics — such as average handling time, first-call resolution rate, and customer satisfaction score — all in one interactive and easy-to-use Excel file.
Unlike complex reporting systems, this scorecard is fully built in Excel, making it accessible, customizable, and cost-effective for businesses of any size.
Structure of the Call Centre KPI Scorecard in Excel
This ready-to-use Excel template consists of four well-organized worksheets that make monitoring, analysis, and updates effortless.
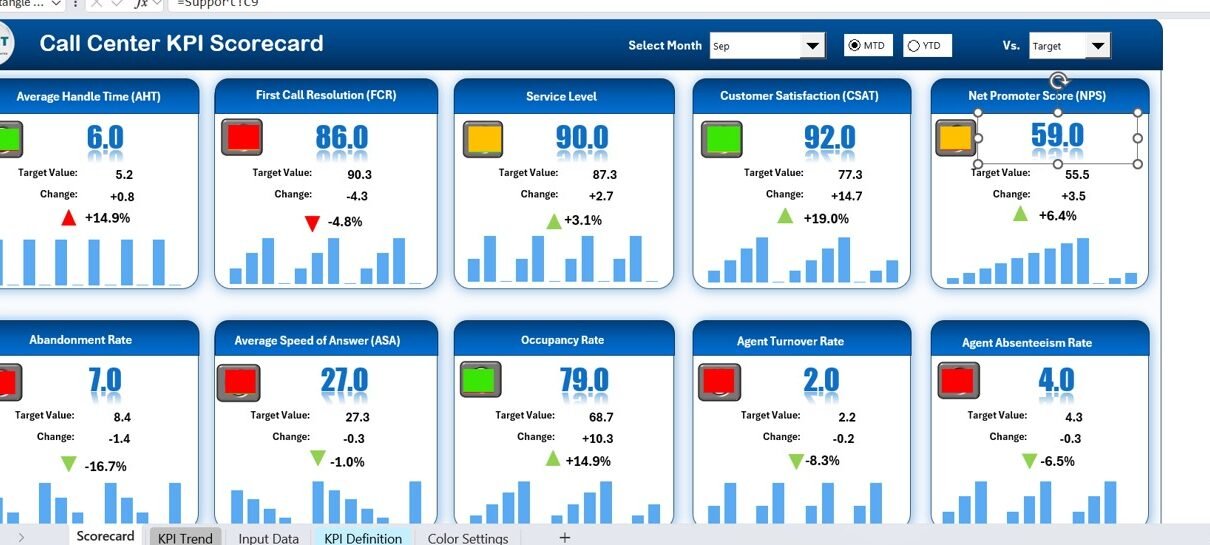
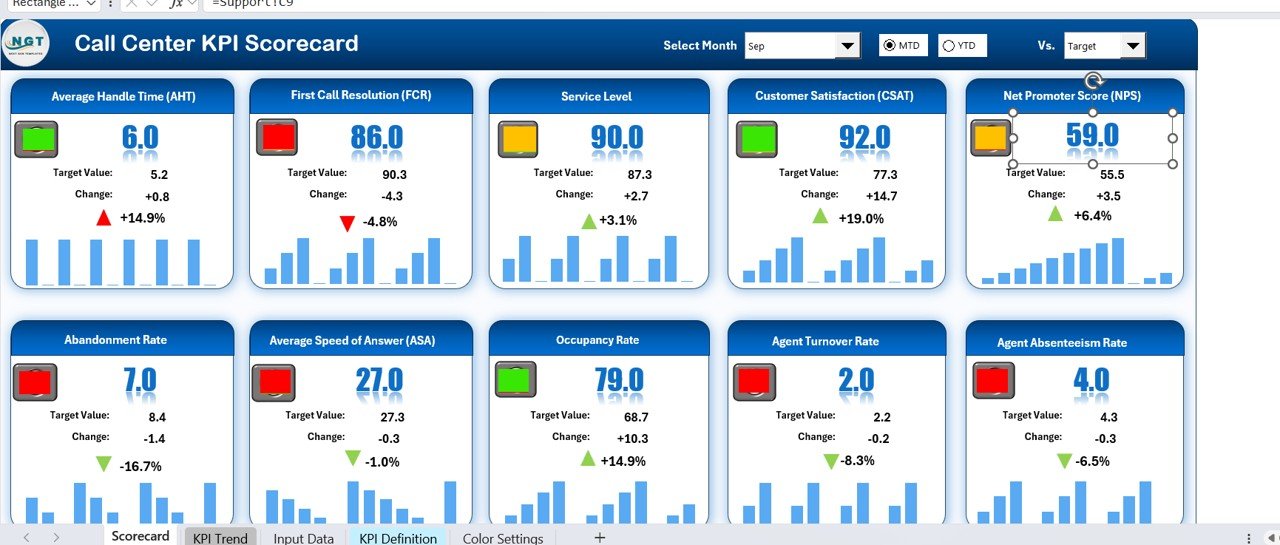
⃣ Scorecard Sheet – The Main Dashboard
The Scorecard Sheet serves as the control centre of your performance tracking system.
It allows managers to instantly see how well the team is meeting its targets.
Key Features:
- Dropdown Menus: Choose a month or switch between MTD (Month-to-Date) and YTD (Year-to-Date) modes for flexible analysis.
- Actual vs Target Comparison: Quickly identify where the performance is strong and where improvement is needed.
- Visual Indicators: Conditional formatting displays colour-coded visuals (green for good, red for poor) for instant clarity.
- KPI Overview: View up to 10 KPIs in a single glance, complete with actuals, targets, and percentage achievements.
This sheet turns data into a visual story that even non-technical managers can interpret with ease.
Click to buy Call Centre KPI Scorecard in Excel
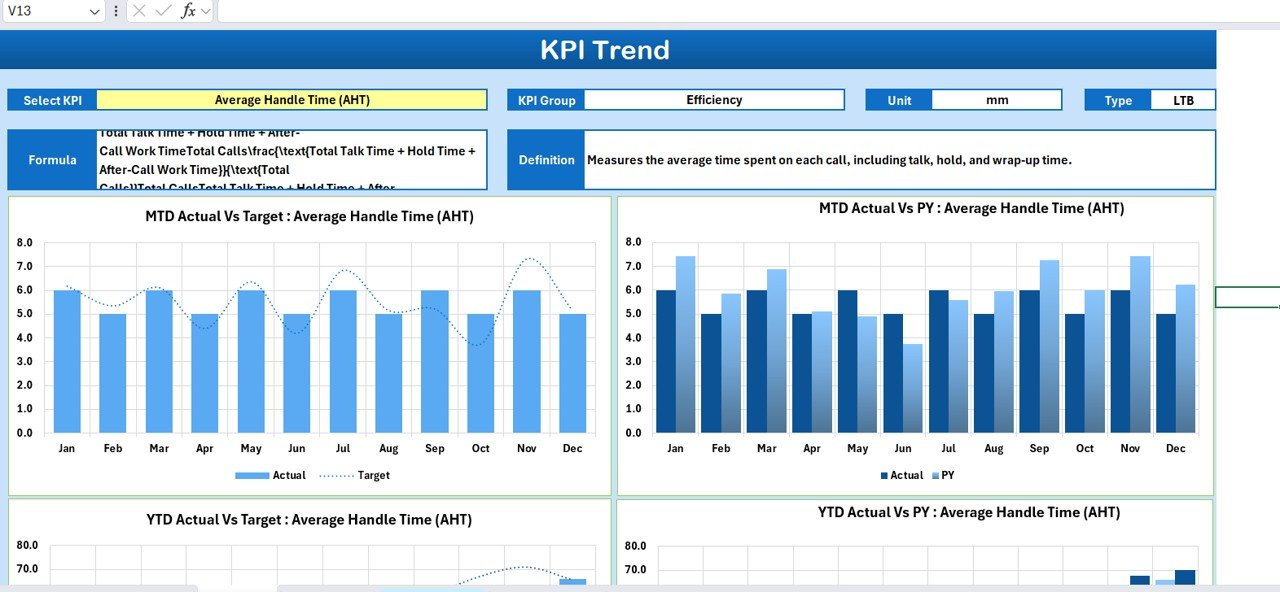
⃣ KPI Trend Sheet – The Performance Tracker
This sheet provides a dynamic view of performance trends for each KPI.
Core Highlights:
- KPI Selection: Choose any KPI name from a dropdown list (cell C3).
- Detailed Info: View its KPI Group, Unit, Type (Lower the Better or Upper the Better), Formula, and Definition.
- Trend Analysis: Explore charts that show MTD, YTD, and Previous Year comparisons for Actual vs Target.
- Visual Insights: See whether performance is improving or declining over time through easy-to-read trend lines.
By visualizing performance patterns, this sheet helps identify seasonal fluctuations and long-term growth trends.
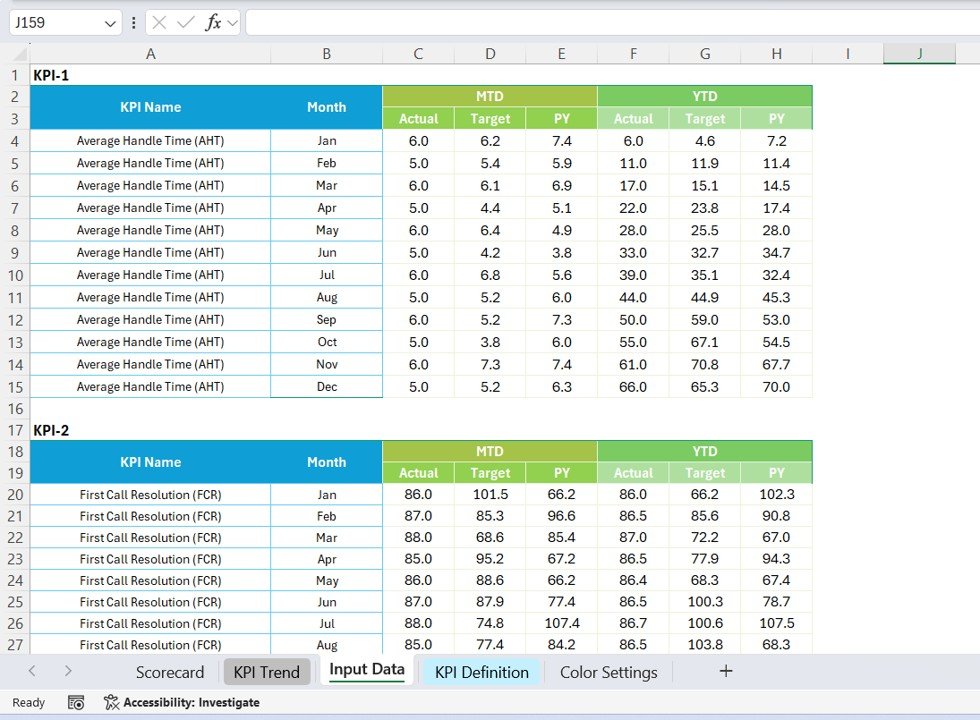
⃣ Input Data Sheet – The Data Foundation
The Input Data Sheet is the backbone of the scorecard.
It’s where you input actual, target, and previous-year data for each KPI.
Key Characteristics:
- Data Entry Made Simple: Enter or import actual values, monthly targets, and other relevant metrics.
- Continuous Updates: As new data arrives, simply update this sheet — all dashboards refresh automatically.
- Error-Free Layout: Structured rows and columns ensure consistency across all KPIs.
This sheet ensures that every calculation and visual is based on the most current and accurate data.
Click to buy Call Centre KPI Scorecard in Excel
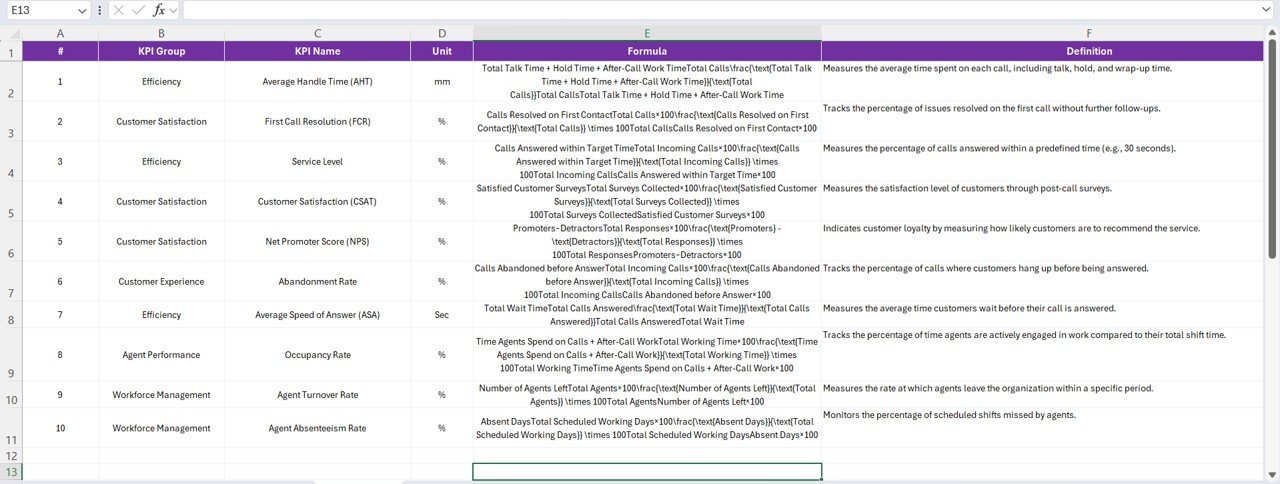
KpI Definition Sheet – The Knowledge Base
This tab defines the essence of every KPI being measured.
You can document details such as:
- KPI Name
- KPI Group
- Unit of Measurement
- Formula
- Definition
By maintaining a centralized definition sheet, everyone on the team understands what each metric means and how it’s calculated — ensuring consistency and transparency.
Why Every Business Needs a Call Centre KPI Scorecard
Managing a call centre without a proper KPI scorecard is like driving blindfolded. You might be moving, but you don’t know if you’re on the right track.
The Call Centre KPI Scorecard in Excel gives you that clarity.
It helps teams evaluate performance, set realistic goals, and focus on continuous improvement.
Here’s how this tool transforms your call-centre operations:
- Streamlined Performance Tracking: View multiple KPIs in one place without toggling between systems.
- Real-Time Insights: Instantly analyze month-to-month progress.
- Data-Driven Decisions: Identify patterns and allocate resources effectively.
- Team Accountability: Each agent and team can see how their performance impacts the bigger picture.
- Enhanced Customer Experience: Continuous monitoring ensures faster responses, fewer escalations, and better service quality.
Key KPIs to Track in a Call Centre Scorecard
Every organization can customize the scorecard to fit its objectives, but the following KPIs are most commonly used:
- Average Handle Time (AHT)
- Measures how long it takes to handle a call from start to finish.
Goal: Lower is better. - First Call Resolution (FCR)
- Tracks the percentage of issues resolved in the first call.
Goal: Higher is better. - Customer Satisfaction Score (CSAT)
- Shows how happy customers are with the service.
Goal: Higher is better. - Abandonment Rate
- Indicates the percentage of callers who hang up before reaching an agent.
Goal: Lower is better. - Service Level
- Measures how quickly calls are answered within a set timeframe.
Goal: Higher is better. - Call Volume
- Represents the total number of incoming and outgoing calls.
Goal: Used for resource planning and workload balancing. - Agent Utilization Rate
- Shows how efficiently agents spend their working hours.
Goal: Balanced utilization avoids burnout and inefficiency. - Average Wait Time
- Reflects how long customers wait before being connected.
Goal: Shorter wait times improve satisfaction. - Call Transfer Rate
- Tracks how often calls are transferred to another agent or department.
Goal: Lower transfer rates indicate well-trained staff. - Escalation Rate
- Measures the percentage of calls escalated to supervisors.
Goal: Lower is better — indicates effective frontline resolution.
⚙️ How to Use the Call Centre KPI Scorecard in Excel
Getting started with this scorecard is simple. Follow these steps:
- Open the Template
Download and open the Excel file. You’ll find four tabs: Scorecard, KPI Trend, Input Data, and KPI Definition. - Enter KPI Definitions
In the KPI Definition sheet, list your KPIs with their units, formulas, and definitions. - Feed Monthly Data
In the Input Data sheet, enter actual, target, and previous-year data for each KPI. - View Results
Navigate to the Scorecard sheet and select the month or time period from the dropdown menu. - Analyze Trends
Use the KPI Trend sheet to visualize performance over time. - Make Decisions
Use these insights to reward high performers, address inefficiencies, and plan upcoming targets.
Advantages of Using a Call Centre KPI Scorecard in Excel
Let’s explore the benefits that make this Excel-based scorecard indispensable for call-centre management.
1. Centralized View of Performance
You can monitor multiple KPIs across months and teams from one sheet. No need to switch between tools or software.
2. Improved Decision-Making
Real-time comparisons between actual and target performance guide strategic actions and training initiatives.
3. Cost-Effective Solution
No need for expensive analytics tools — Excel provides everything you need with flexibility and customization.
4. Enhanced Accountability
Agents can clearly see how their performance aligns with overall goals, creating a culture of transparency.
5. Customization Flexibility
Add or modify KPIs, colours, and charts to align with business goals or reporting preferences.
6. Visual Insights for Quick Actions
Colour coding, icons, and trend charts make performance data visually intuitive and easy to interpret.
7. Facilitates Continuous Improvement
Monthly and yearly trend analyses highlight consistent under- or over-performance, encouraging proactive problem-solving.
Best Practices for the Call Centre KPI Scorecard in Excel
To maximize the effectiveness of your scorecard, follow these tried-and-tested best practices.
1. Keep KPI Definitions Consistent
Always use standardized definitions to ensure everyone interprets metrics the same way.
2. Review Data Regularly
Update the Input Data sheet monthly. Timely updates ensure accuracy and relevant insights.
3. Focus on Actionable Metrics
Avoid tracking too many KPIs. Select only those that directly impact call-centre goals.
4. Use Conditional Formatting Wisely
Highlight critical metrics in red and achievements in green for instant clarity.
5. Encourage Team Participation
Share the scorecard with agents to promote transparency and motivation.
6. Validate Data Sources
Ensure that data inputs are accurate and validated to maintain credibility.
7. Align KPIs with Business Goals
Each KPI should contribute to broader organizational objectives such as customer satisfaction, cost reduction, or service quality.
Example Use Case: Call Centre Operations
Let’s consider an example.
A customer-care team of a telecom company uses this Excel scorecard to track:
- Call volume per day
- First-call resolution rates
- Customer satisfaction
- Agent availability and performance
Every month, managers update the Input Data sheet. The Scorecard sheet automatically updates with new charts and colours, showing where service standards are improving and where extra training might be required.
This setup allows senior management to make decisions based on accurate, real-time insights — without needing any technical or BI tools.
Excel Features That Power This Scorecard
The Call Centre KPI Scorecard leverages powerful Excel capabilities to make data analysis seamless:
- Pivot Tables: For quick summaries and comparisons.
- Dynamic Charts: Line, bar, and combo charts visualize KPI progress.
- Formulas: SUMIFS, AVERAGEIFS, and IF functions calculate performance metrics automatically.
- Conditional Formatting: Highlights achievements and underperformance instantly.
- Dropdown Lists: Ensure user-friendly filtering for MTD/YTD selection.
- Data Validation: Prevents incorrect entries and ensures data integrity.
These features together make Excel not just a spreadsheet, but a complete performance-management platform.
How This Scorecard Improves Customer Experience
A call-centre’s ultimate goal is customer satisfaction.
By tracking KPIs systematically, this scorecard directly impacts customer experience in several ways:
- Faster call handling through reduced wait and resolution times.
- Improved communication consistency across agents.
- Fewer escalations and repeated calls.
- Higher first-call resolution, leading to happier customers.
- Better planning of staff schedules during peak hours.
When customers experience faster service and consistent support, loyalty and brand reputation naturally grow.
Who Can Benefit from This Scorecard?
The Call Centre KPI Scorecard in Excel isn’t limited to customer-care managers. It’s useful for:
- Operations Managers: For performance tracking and resource planning.
- Quality Analysts: To monitor compliance and call-quality metrics.
- HR Managers: To link performance with training and incentives.
- Executives: For data-driven strategy formulation.
- Small Businesses: To measure call efficiency without investing in expensive software.
Integration Possibilities
Although Excel is standalone, this scorecard can integrate with:
- CRM systems (for importing customer and call data)
- Power BI (for advanced visualization)
- Google Sheets (for collaborative tracking)
With minor adjustments, data can flow seamlessly across platforms, enhancing scalability and automation.
Conclusion
A Call Centre KPI Scorecard in Excel is more than a spreadsheet — it’s a strategic decision-making tool that enhances efficiency, accountability, and customer satisfaction.
By tracking essential metrics such as Average Handle Time, First-Call Resolution, and Customer Satisfaction, managers gain a clear understanding of operational performance.
This insight leads to smarter staffing, improved response times, and ultimately, happier customers.
With Excel’s flexibility, even small and medium-sized businesses can now access a professional-grade performance-tracking system — without the complexity or cost of enterprise software.
Frequently Asked Questions (FAQs)
1️ What is a Call Centre KPI Scorecar?
It’s an Excel-based tool that tracks and analyzes key performance indicators for call-centre operations such as efficiency, customer satisfaction, and agent productivity.
⃣ How many KPIs can I track with this scorecard?
The default setup allows tracking of 10 KPIs at once, but you can easily add more by extending the data tables.
3️ Can I customize the KPIs and visuals?
Yes! You can modify KPI names, formulas, colours, and chart types according to your organization’s needs.
⃣ What time periods does it support?
It supports Month-to-Date (MTD), Year-to-Date (YTD), and Previous Year (PY) comparisons for each KPI.
⃣ Do I need advanced Excel skills to use it?
Not at all. The template is fully pre-formatted and requires only basic Excel knowledge for data entry and analysis.
⃣ Is this template suitable for small businesses?
Absolutely. It’s cost-effective, simple, and scalable — ideal for businesses of all sizes.
⃣ How often should I update the da?
Monthly updates are recommended, but you can input data weekly or quarterly depending on reporting frequency.
⃣ Can I connect this scorecard to external data sources?
Yes. With Excel’s Power Query or Power BI integration, you can automate data imports from CRM or ticketing systems.
Visit our YouTube channel to learn step-by-step video tutorials
Watch the step-by-step video tutorial:
Click to buy Call Centre KPI Scorecard in Excel