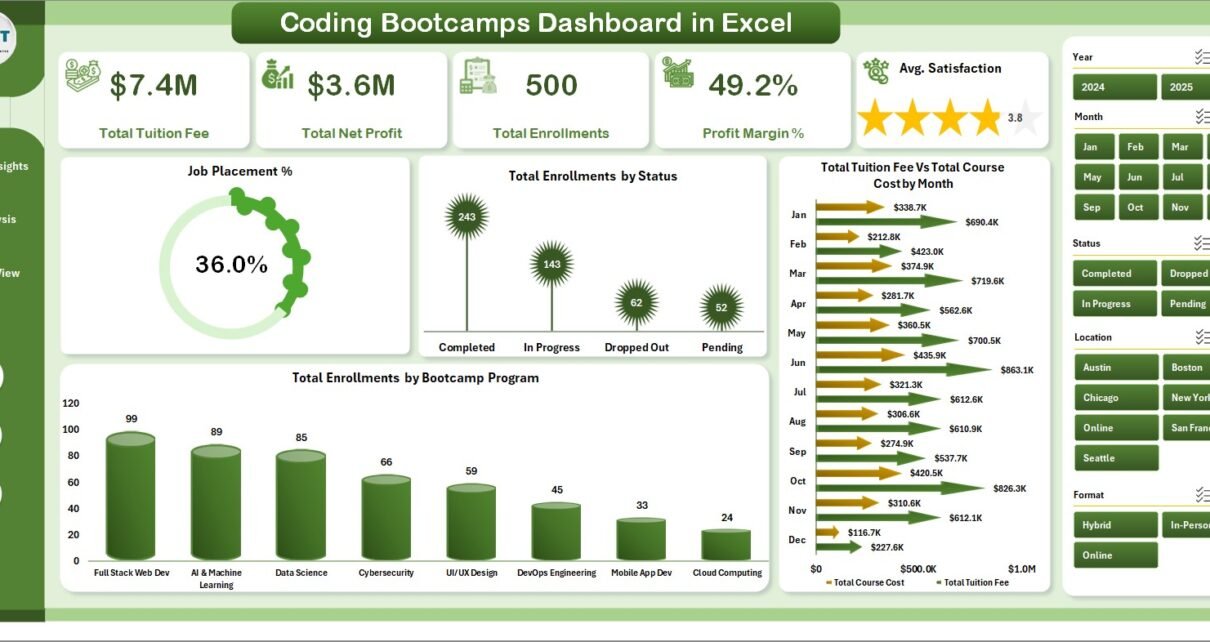
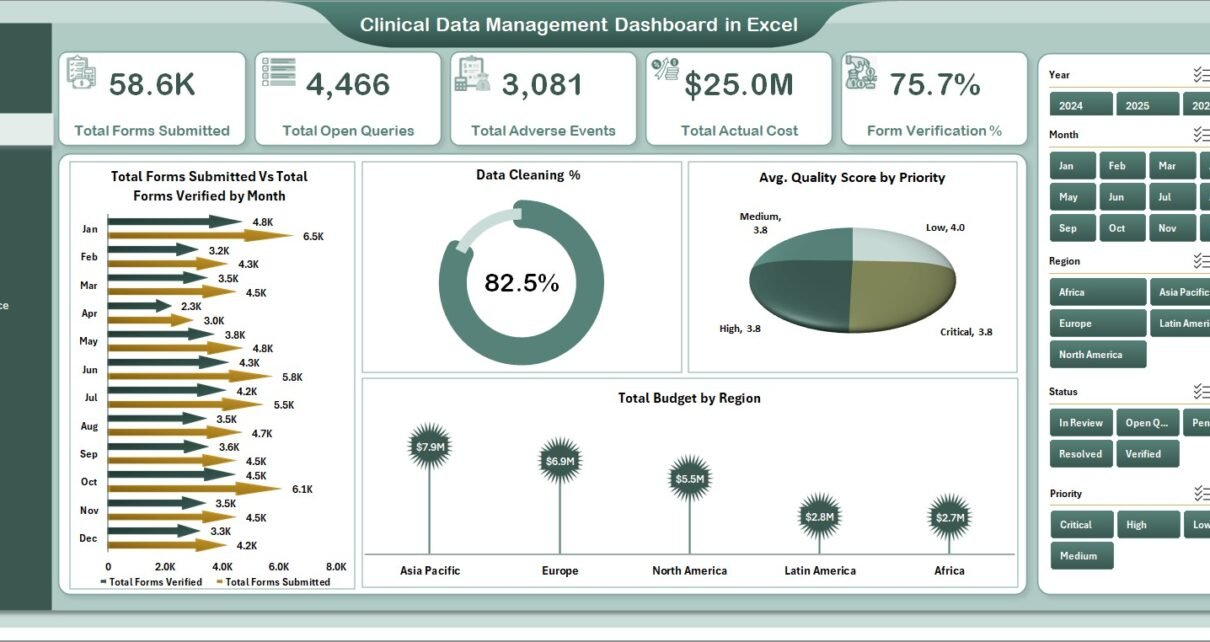
Cyber Law Advisory Dashboard in Excel
The Cyber Law Advisory Dashboard in Excel is designed for cyber law advisors, law firms, corporate legal departments, compliance consultants, and risk teams that need a fast way to review
Transforming Data into Decisions
This category provides detailed tutorials on creating effective and informative dashboards in Excel. Whether you need to track your business’s key performance indicators (KPIs) or present complex data in a simplified manner, our tutorials will guide you through the process. Each tutorial comes with a free practice file for download and tutorial videos to help you follow along easily. Start your Excel dashboard tutorial now and enhance your data analysis and presentation skills with this powerful tool. Impress your colleagues and boss with insightful and attractive dashboards by exploring this category today.