New: NextGenTemplates Academy - video courses on Excel formulas with AI and Pivot Tables & dashboards. Early-bird: 20% off with code EARLYBIRD20 - first 20 orders only.See the courses →
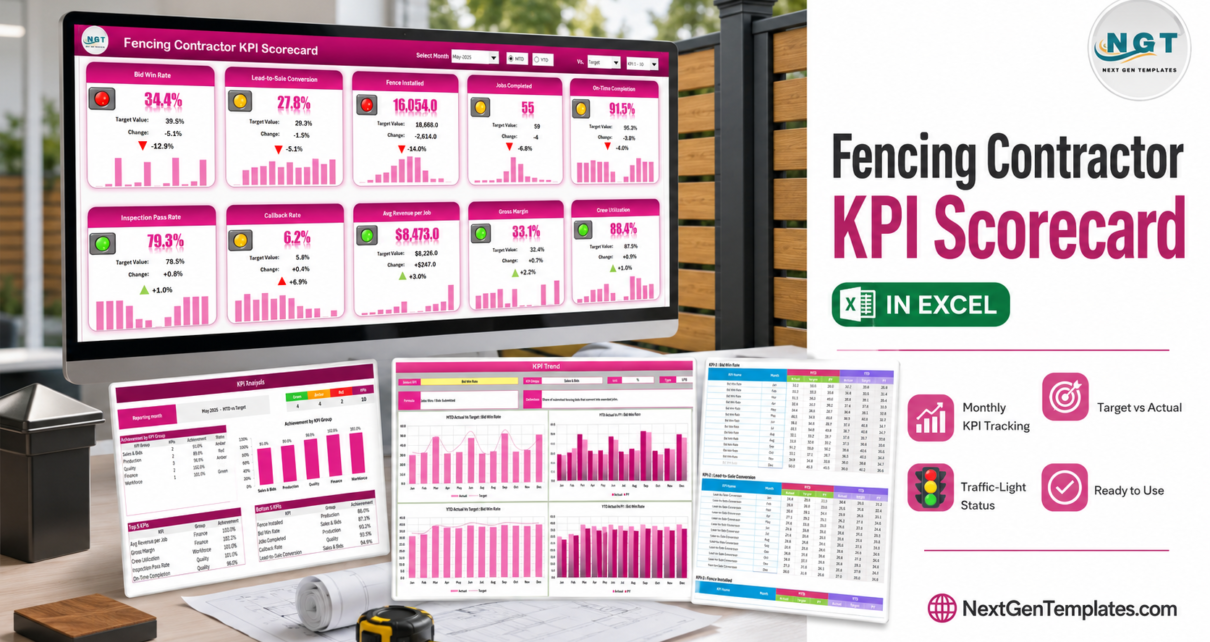
PKComments Off on Fencing Contractor KPI Scorecard in Excel
Most fencing contractors measure the business one job at a time. You know the Miller job ran two days long, you know the last commercial bid was lost on price,
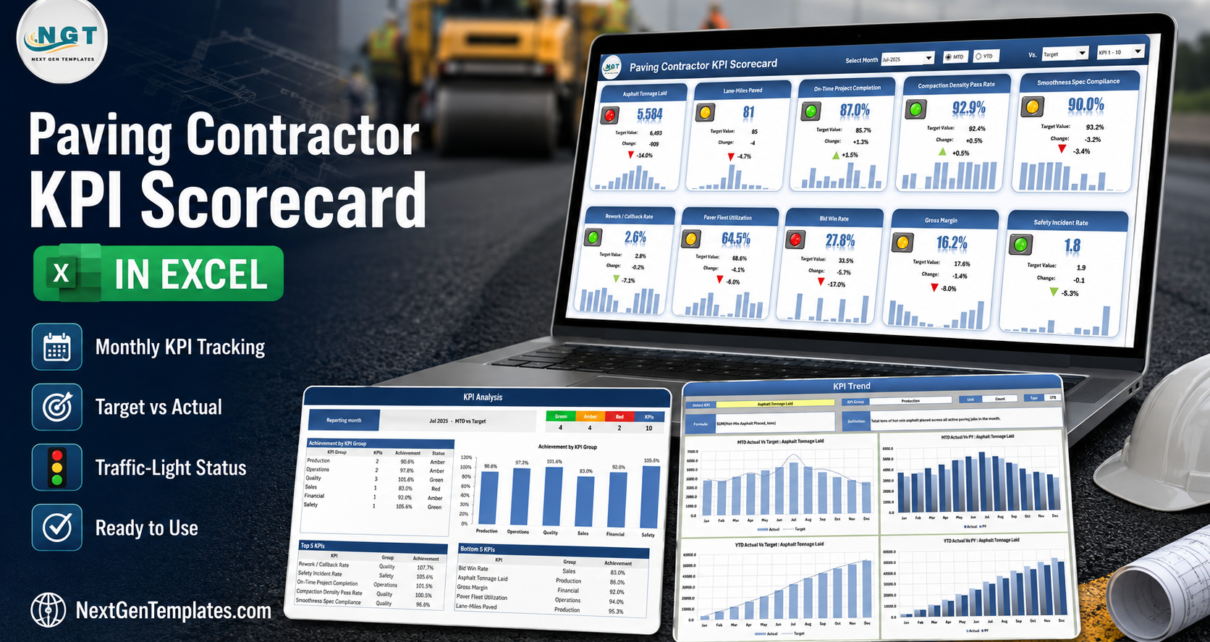
PKComments Off on Paving Contractor KPI Scorecard in Excel
Most paving contractors already own every number they need. Tonnage sits in the plant tickets, lane-miles in the foreman's daily, density and IRI results in the QC file, bids in
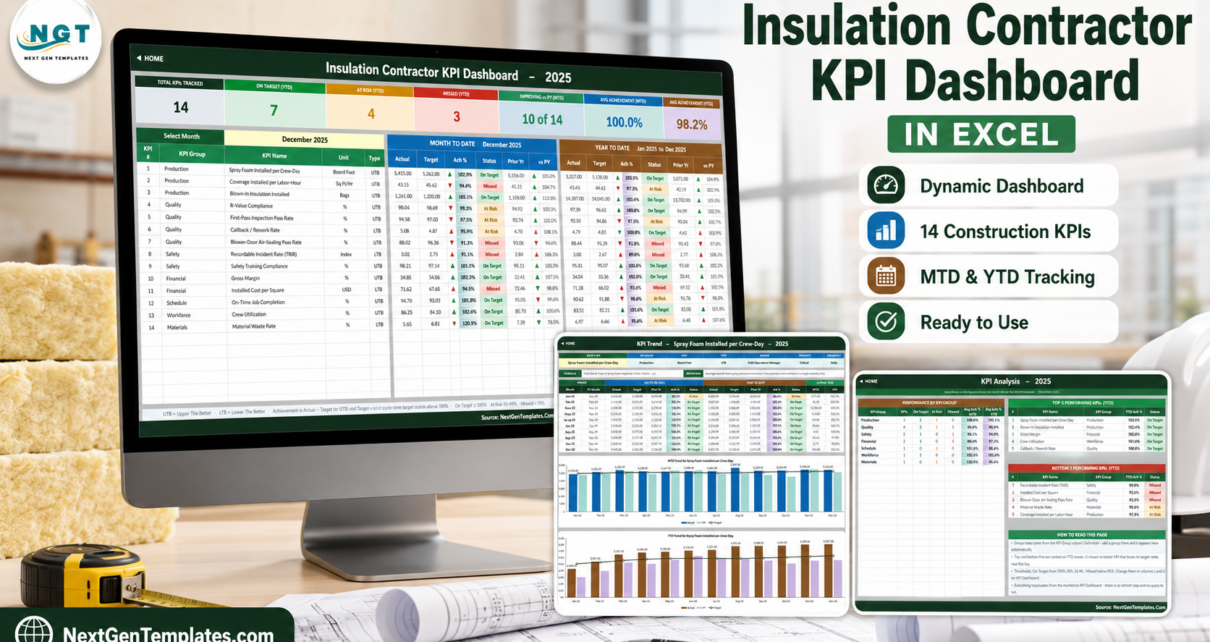
PKComments Off on Insulation Contractor KPI Dashboard in Excel
Most insulation contractors already know their numbers. Board feet went out the door, the blower-door test either passed or it did not, the callback happened or it did not. What
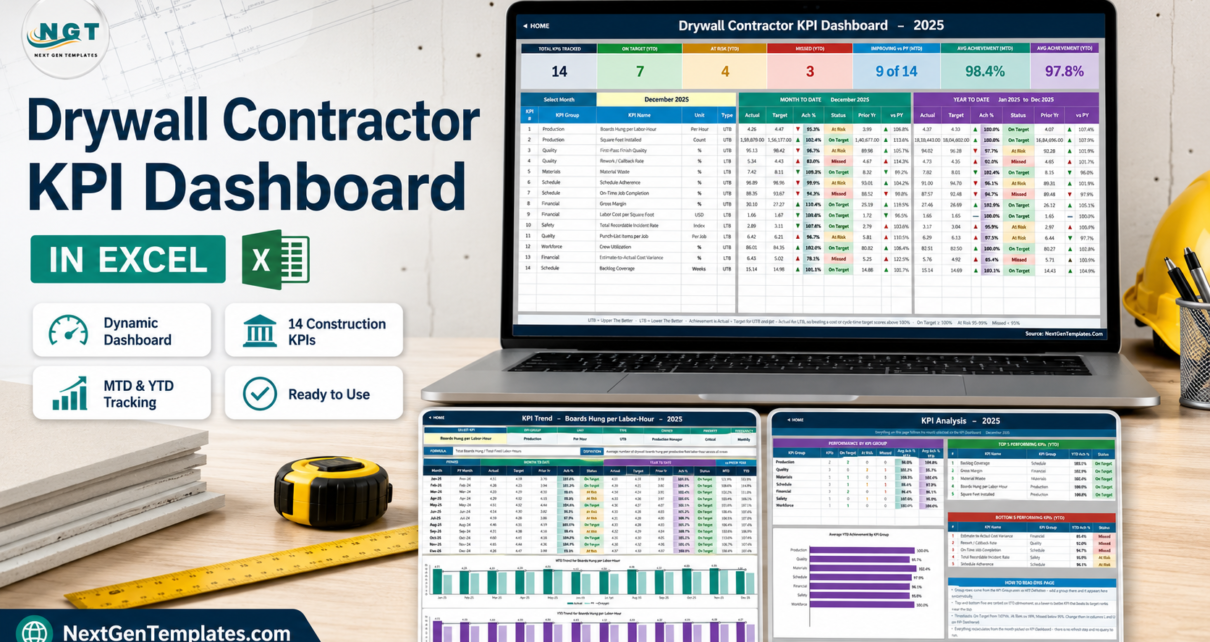
PKComments Off on Drywall Contractor KPI Dashboard in Excel
Most drywall subcontractors already know their revenue. Far fewer can say, in one glance, whether last month's boards-per-labor-hour beat target, whether callbacks are trending the wrong way, and whether the
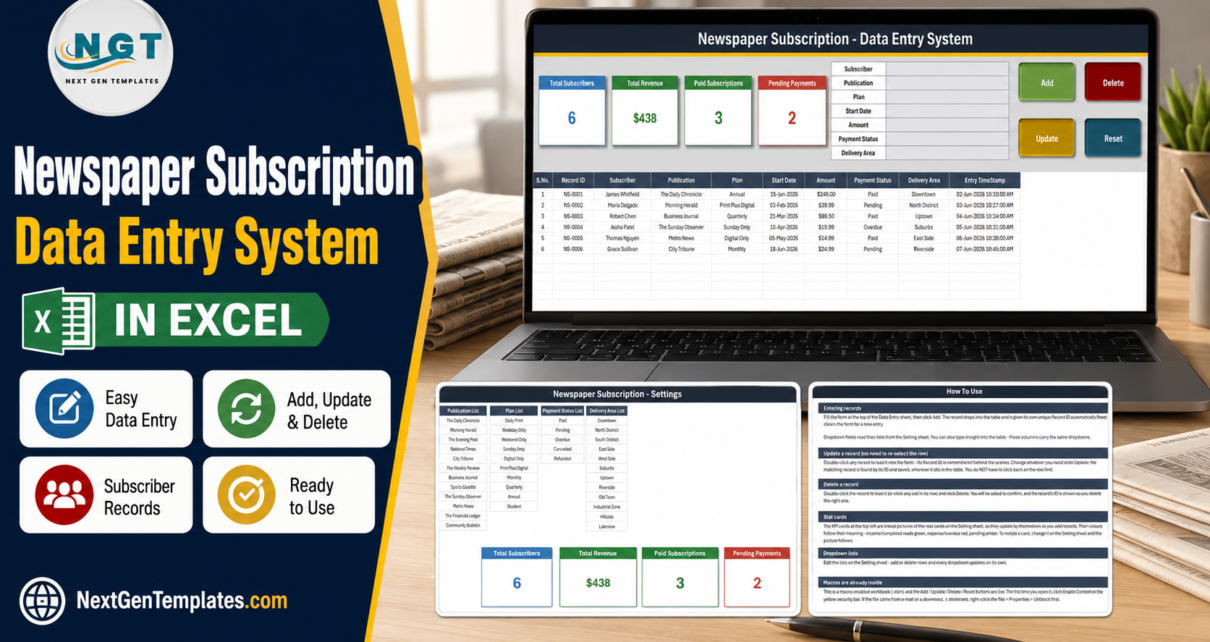
PKComments Off on Newspaper Subscription Data Entry System in Excel
A circulation desk that keeps subscribers in a plain worksheet usually ends up with the same three problems: two people typing over each other's rows, no way to tell which
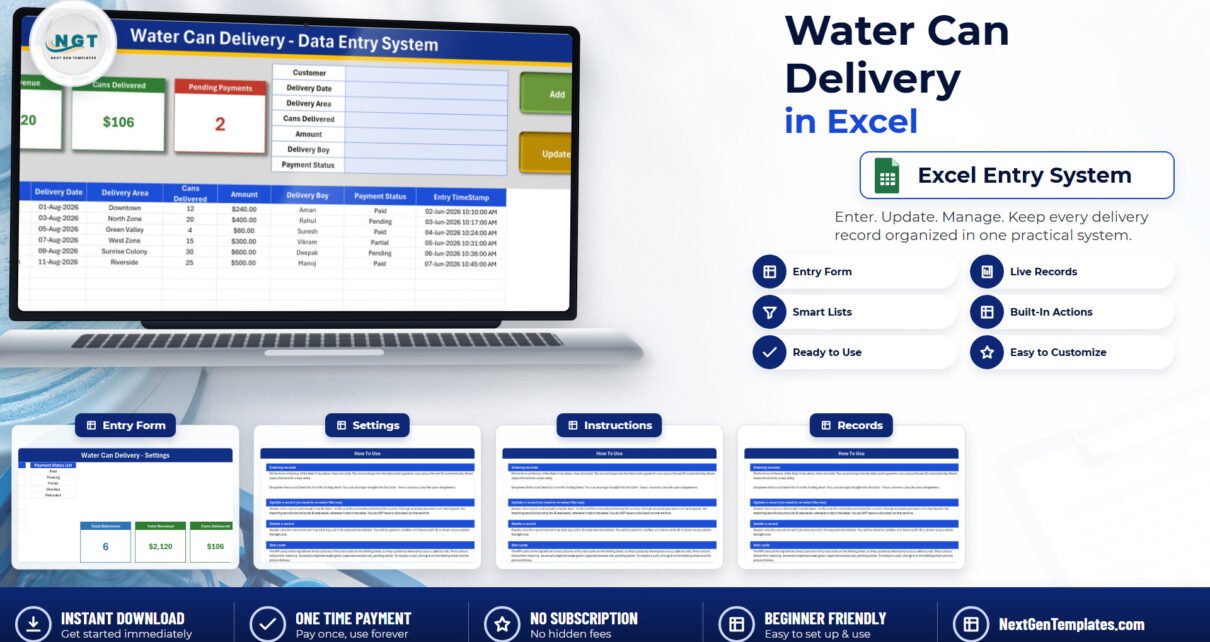
PKComments Off on Water Can Delivery Data Entry System in Excel
Every water plant I have ever walked into keeps the same two records: a spiral notebook in the van, and the owner's memory. The notebook says twelve cans went to
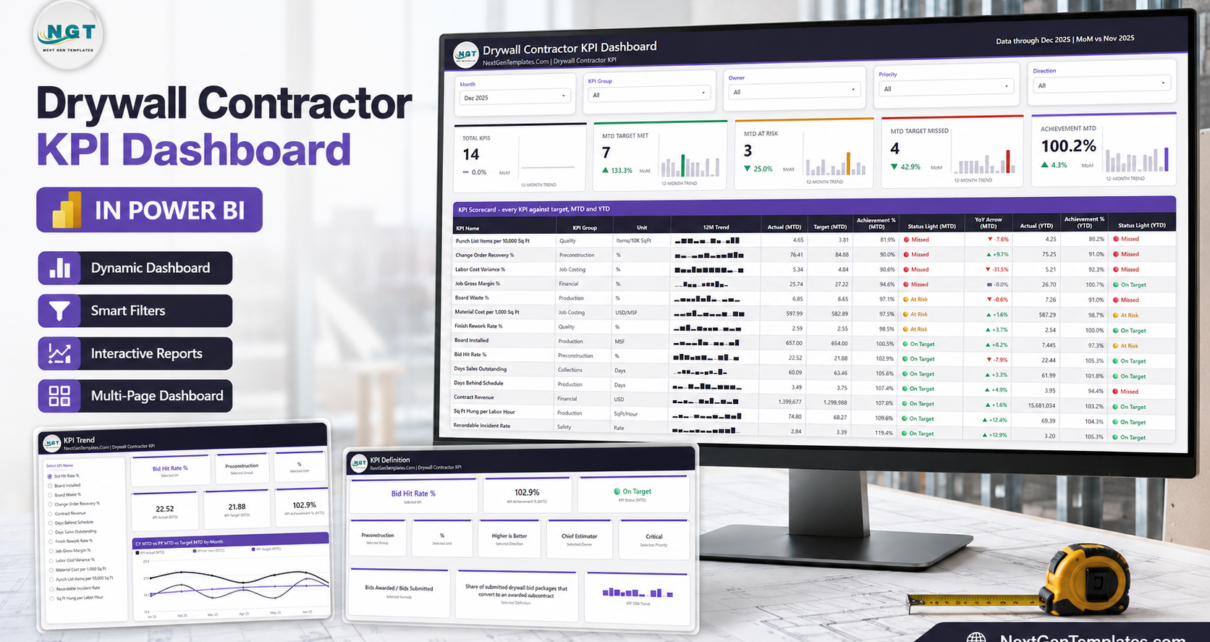
PKComments Off on Drywall Contractor KPI Dashboard in Power BI
Most drywall subcontractors already know their numbers. Board goes on the wall, compound goes on the seams, invoices go out, and somewhere in a spreadsheet there is a figure for
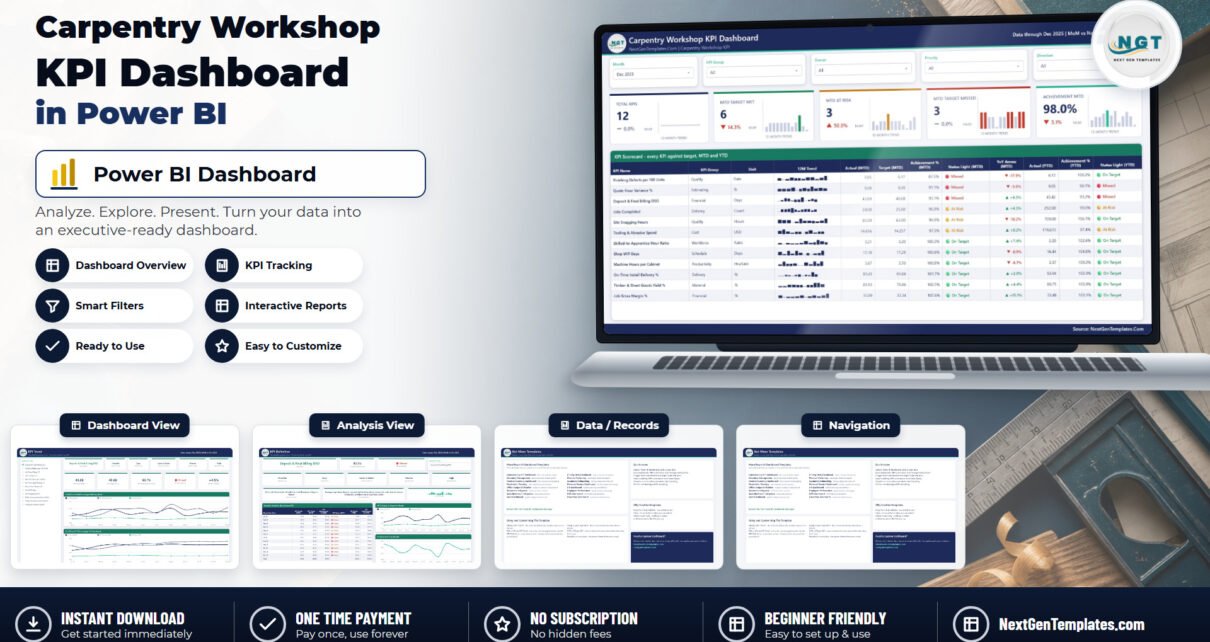
PKComments Off on Carpentry Workshop KPI Dashboard in Power BI
Most joinery shops already know their numbers. The problem is that the numbers live in four places - the estimator's quote file, the shop foreman's cutting-list diary, the finisher's reject
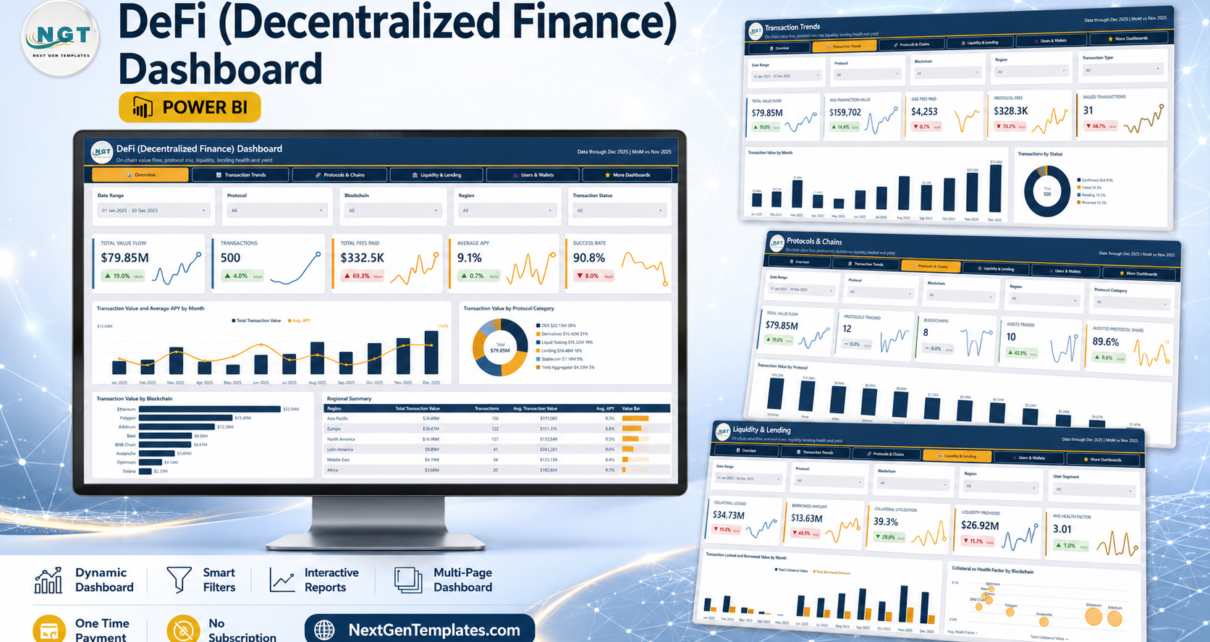
PKComments Off on DeFi (Decentralized Finance) Dashboard in Power BI
Most DeFi reporting dies in a spreadsheet. You export a quarter of transactions, build three pivot tables, and by the time the deck is ready the numbers have already been
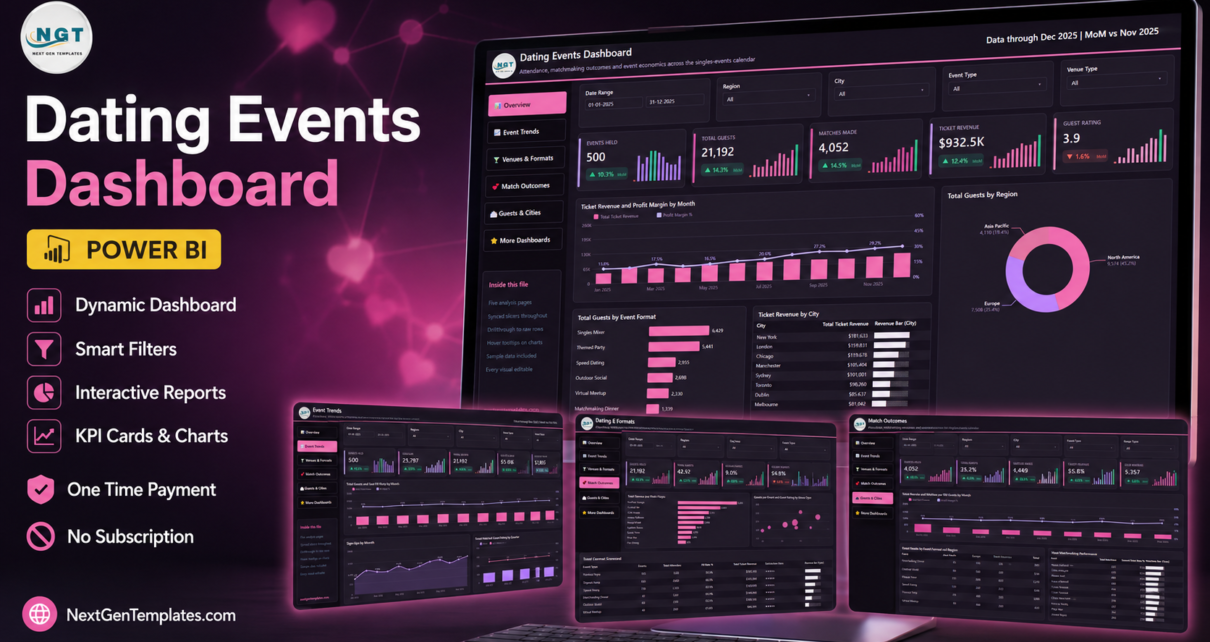
PKComments Off on Dating Events Dashboard in Power BI
The Dating Events Dashboard in Power BI reports on a calendar of 500 singles events across 9 venue types, 6 event formats, 8 cities and 3 regions, using 35 DAX