Modern buildings rely heavily on automation systems to control lighting, HVAC, security, and energy usage. As buildings become smarter, facility managers must monitor performance continuously to ensure efficiency, comfort, and safety. However, managing large volumes of operational data without a structured system becomes difficult.
Therefore, organizations need a clear and interactive analytical tool that converts building automation data into meaningful insights. This is exactly where the Building Automation KPI Dashboard in Excel becomes extremely valuable.
The Building Automation KPI Dashboard in Excel is a ready-to-use performance monitoring template designed to track key performance indicators related to building management systems. With the help of Excel charts, slicers, conditional formatting, and KPI tracking structures, users can monitor operational efficiency, compare performance against targets, and identify improvement opportunities.
In this comprehensive guide, you will learn everything about the Building Automation KPI Dashboard in Excel, including its features, benefits, dashboard structure, best practices, and how organizations can use it to improve facility performance.
Click to buy Building Automation KPI Dashboard in Excel
What is a Building Automation KPI Dashboard in Excel?
A Building Automation KPI Dashboard in Excel is a centralized monitoring tool that tracks important performance indicators of building systems such as HVAC efficiency, energy consumption, maintenance performance, system uptime, and operational cost.
Instead of reviewing scattered reports, facility managers can use this dashboard to view all key metrics in one place.
This dashboard helps organizations to:
- Monitor operational performance of building systems
- Track energy efficiency and consumption
- Compare actual performance with targets
- Analyze monthly and yearly trends
- Improve decision making for facility management
Moreover, Excel provides powerful features like pivot tables, charts, conditional formatting, and data validation, which make KPI monitoring easier and interactive.
As a result, facility managers can quickly identify problems and take corrective actions before operational issues grow.
Why Do Organizations Need a Building Automation KPI Dashboard?
Building automation systems generate large amounts of operational data every day. However, without proper analysis, this data does not provide value.
Therefore, organizations need structured dashboards that convert raw data into visual insights.
A KPI dashboard helps organizations:
- Monitor building performance in real time
- Improve energy efficiency
- Track maintenance effectiveness
- Ensure system reliability
- Reduce operational costs
- Improve occupant comfort and safety
Consequently, facility managers can make faster and smarter decisions using data-driven insights.
Key Features of the Building Automation KPI Dashboard in Excel
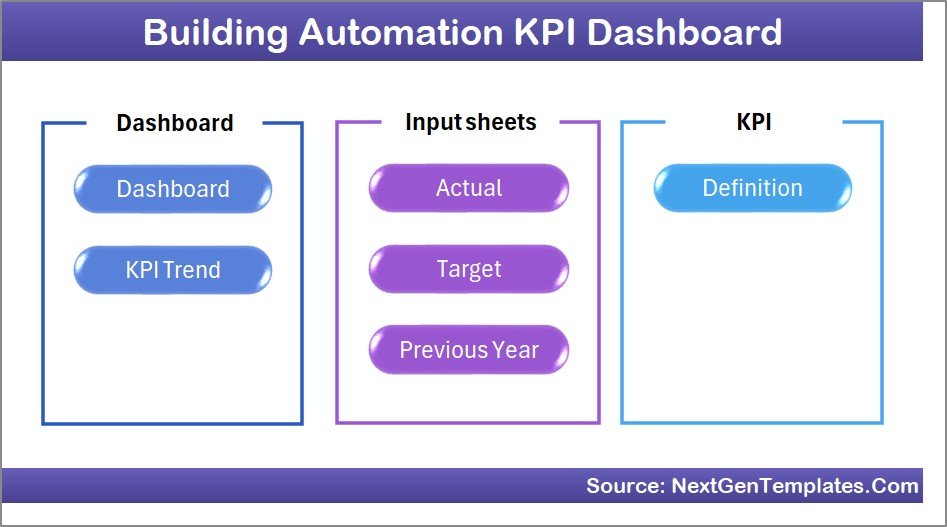
The Building Automation KPI Dashboard in Excel includes multiple analytical sheets designed to monitor different aspects of building operations.
This dashboard contains 7 worksheets, each serving a specific purpose.
Summary Page – Dashboard Navigation Center
The Summary Page works as an index sheet for the entire dashboard.
It provides quick navigation to different analytical pages so that users can move across the dashboard easily.
Key features include:
- Navigation buttons for all worksheets
- Easy access to each dashboard section
- Clean layout for user-friendly experience
Because of this navigation structure, users can move between sheets without scrolling through the workbook.
Click to buy Building Automation KPI Dashboard in Excel
Dashboard Sheet – Main KPI Monitoring Page
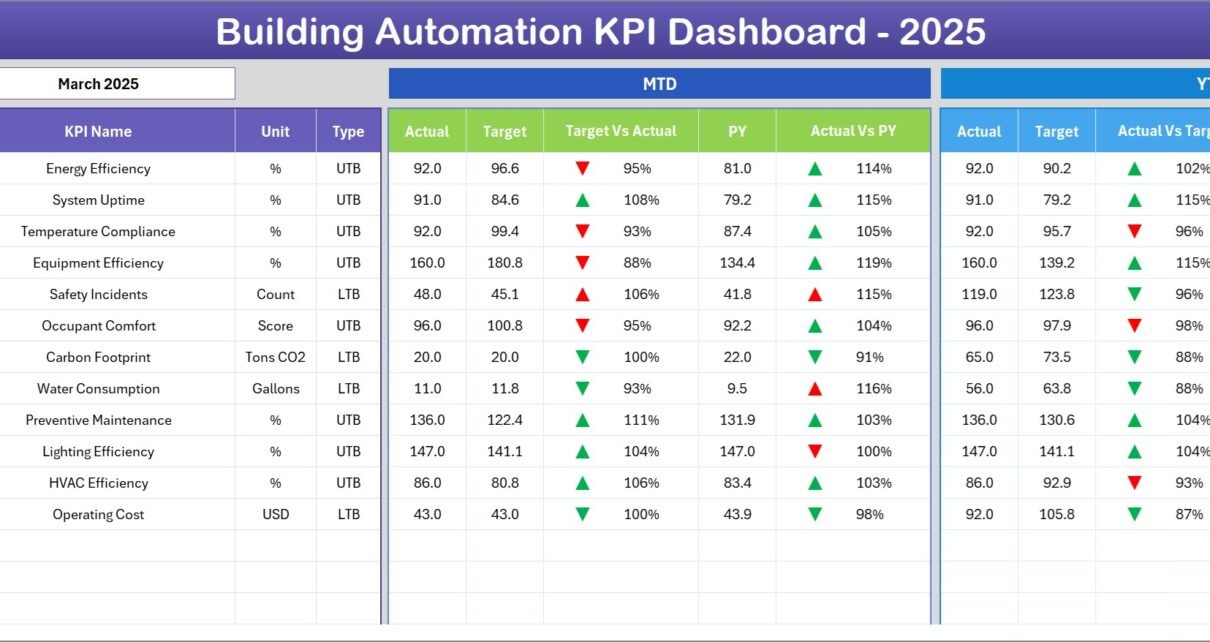
The Dashboard Sheet serves as the main monitoring interface for all KPIs.
Here, users can view important performance indicators in one place.
Dynamic Month Selection
Users can select a specific month using the drop-down menu in cell D3. Once the month changes, the entire dashboard updates automatically.
This dynamic functionality allows managers to quickly analyze monthly performance.
KPI Performance Indicators
The dashboard displays:
- MTD Actual values
- MTD Target values
- Previous Year values
- Target vs Actual comparison
- Previous Year vs Actual comparison
Additionally, conditional formatting shows up and down arrows, which help users identify performance improvement or decline instantly.
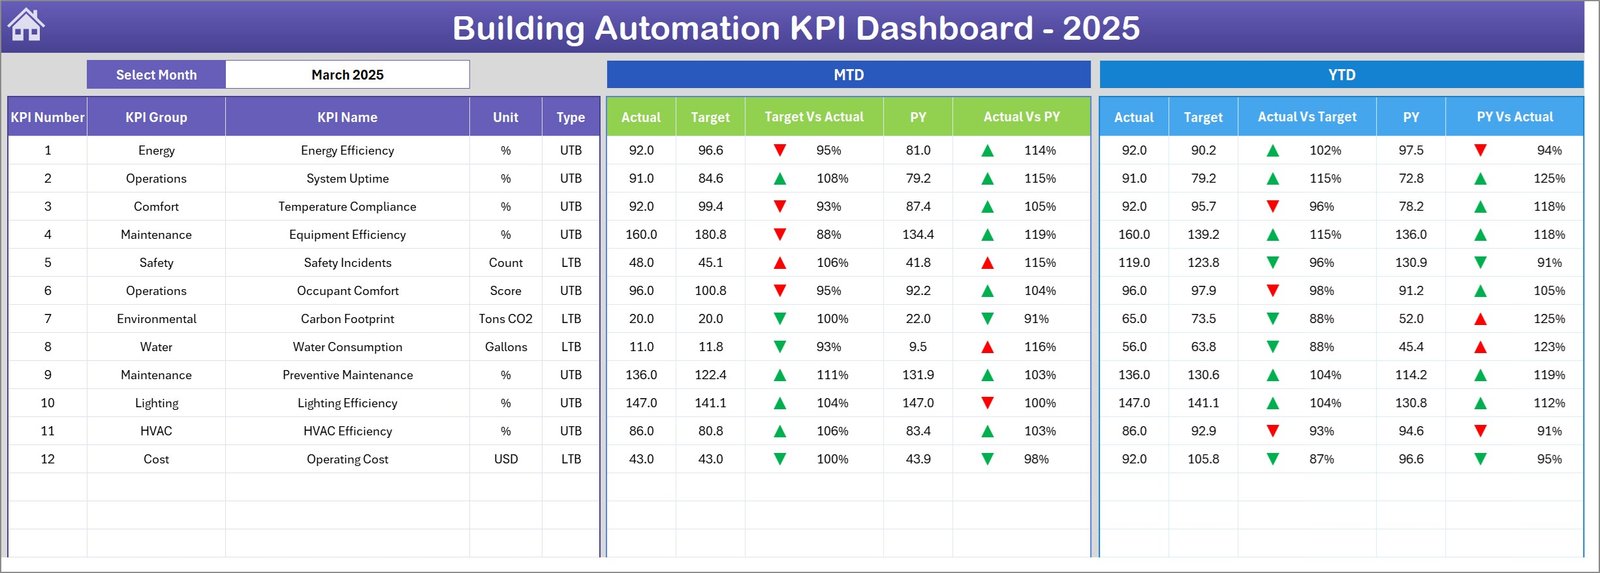
Year-to-Date Performance Tracking
The dashboard also includes YTD analysis, which shows:
- YTD Actual
- YTD Target
- YTD Previous Year
- Target vs Actual
- Previous Year vs Actual
Therefore, managers can evaluate both short-term and long-term performance trends.
Click to buy Building Automation KPI Dashboard in Excel
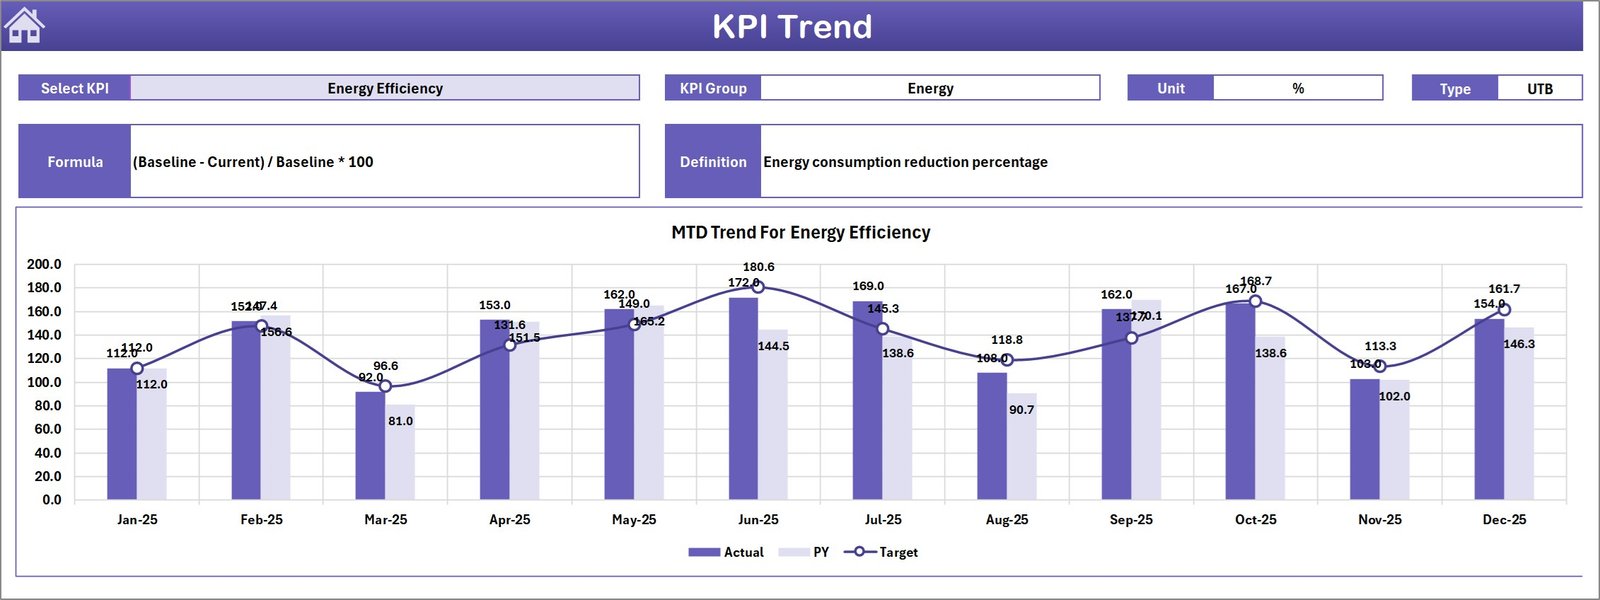
Trend Sheet – KPI Performance Trend Analysis
The Trend Sheet helps users analyze performance trends for individual KPIs.
Users can select a KPI from the drop-down menu in cell C3, and the dashboard updates automatically.
This sheet provides detailed KPI information including:
- KPI Group
- KPI Unit
- KPI Type (Higher is better or Lower is better)
- KPI Formula
- KPI Definition
In addition, the sheet displays trend charts for MTD and YTD values.
These charts show:
- Actual values
- Target values
- Previous year values
Because of this trend analysis, organizations can easily identify patterns and performance fluctuations.
Click to buy Building Automation KPI Dashboard in Excel
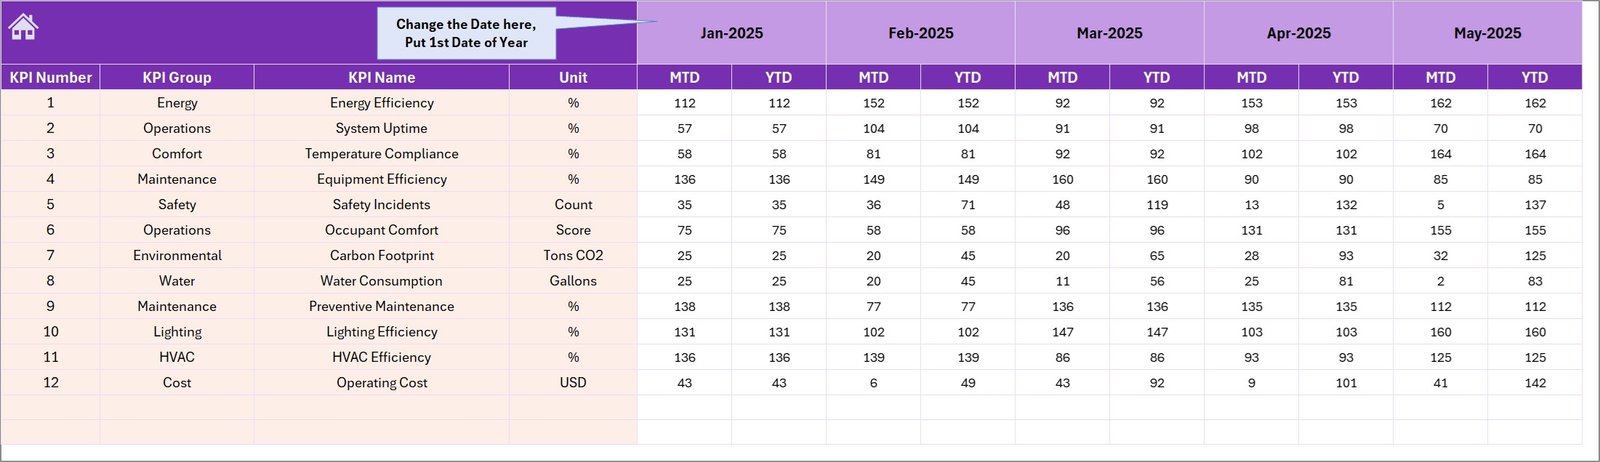
Actual Numbers Input Sheet – Data Entry for Performance Metrics
The Actual Numbers Input Sheet allows users to enter real operational data.
Users must enter the actual KPI values for both MTD and YTD.
Monthly Setup
The starting month of the year can be defined in cell E1.
Once users define the starting month, the dashboard automatically adjusts calculations accordingly.
This flexible design allows organizations to customize the reporting cycle based on their operational calendar.
Click to buy Building Automation KPI Dashboard in Excel
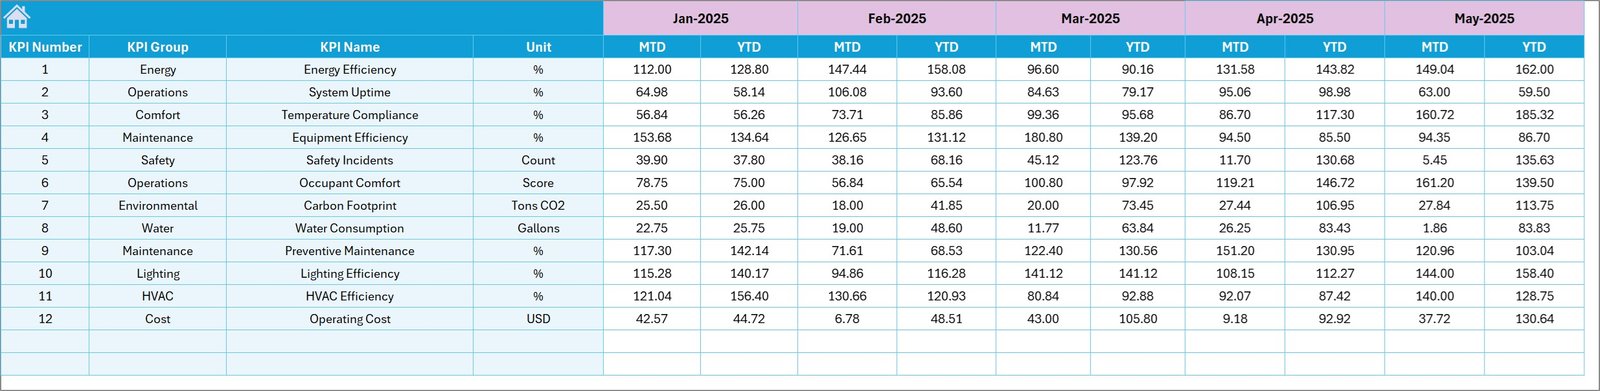
Target Sheet – KPI Goal Setting
The Target Sheet contains performance targets for each KPI.
Users enter:
- Monthly targets
- Year-to-date targets
These targets serve as benchmarks that help measure operational success.
For example, organizations may define targets for:
- Energy consumption
- HVAC efficiency
- System uptime
- Maintenance response time
By comparing actual values with targets, managers can quickly identify performance gaps.
Click to buy Building Automation KPI Dashboard in Excel
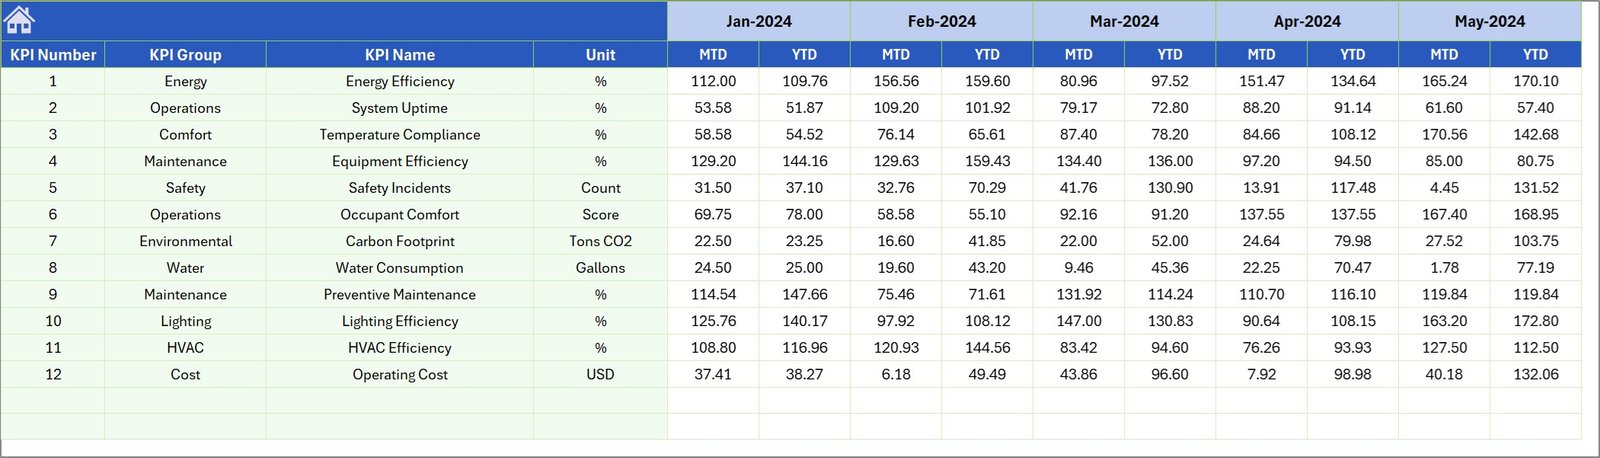
Previous Year Numbers Sheet – Historical Performance Comparison
The Previous Year Numbers Sheet contains KPI data from the previous year.
Users must enter historical values in the same format used for current year data.
This data enables the dashboard to calculate year-over-year performance comparisons.
As a result, organizations can identify long-term improvement trends.
Click to buy Building Automation KPI Dashboard in Excel
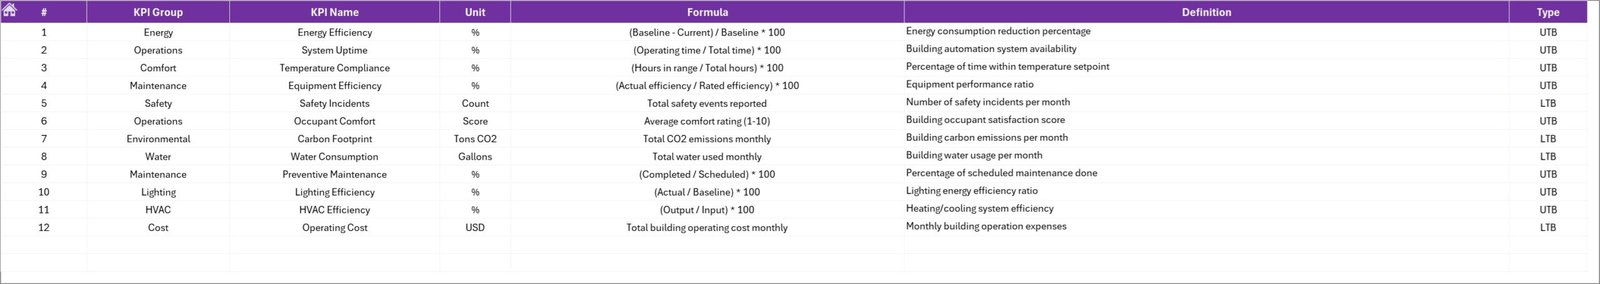
KPI Definition Sheet – KPI Documentation
The KPI Definition Sheet acts as the documentation center for all KPIs used in the dashboard.
Users must enter the following details:
- KPI Name
- KPI Group
- KPI Unit
- KPI Formula
- KPI Definition
Because of this structured documentation, users can easily understand how each KPI is calculated.
This improves transparency and ensures consistent KPI measurement across teams.
Click to buy Building Automation KPI Dashboard in Excel
What KPIs Can Be Monitored in a Building Automation Dashboard?
A building automation dashboard can monitor several performance indicators related to facility management.
Common KPIs include:
Energy Efficiency KPIs
- Energy Consumption per Square Meter
- HVAC Energy Efficiency
- Lighting Energy Usage
- Renewable Energy Utilization %
Maintenance KPIs
- Preventive Maintenance Compliance
- Mean Time to Repair (MTTR)
- Maintenance Response Time
- Equipment Downtime Hours
Operational KPIs
- System Uptime %
- Alarm Response Time
- Occupancy Comfort Score
- Temperature Compliance %
Financial KPIs
- Energy Cost per Building
- Maintenance Cost
- Operational Cost per Square Meter
- Cost Savings from Automation
These KPIs provide a complete picture of building performance.
Advantages of Building Automation KPI Dashboard in Excel
Using a Building Automation KPI Dashboard in Excel provides several advantages for facility managers and organizations.
- Centralized Performance Monitoring
All building performance metrics appear in one place.
Therefore, managers can monitor systems without switching between multiple reports.
- Improved Decision Making
Visual charts and KPI comparisons help managers identify problems quickly.
As a result, decision making becomes faster and more effective.
- Better Energy Management
Energy costs represent a large portion of building operational expenses.
This dashboard helps track energy usage and identify efficiency improvements.
- Real-Time KPI Tracking
Monthly and yearly performance metrics update automatically when data changes.
Consequently, users always see the latest performance insights.
- Easy to Use and Customize
Excel dashboards require no advanced technical skills.
Organizations can customize KPIs based on their operational requirements.
- Cost Effective Solution
Many advanced facility management systems require expensive software.
However, Excel dashboards provide powerful analytics at minimal cost.
How Does the Building Automation KPI Dashboard Improve Facility Management?
Facility managers face multiple operational challenges such as rising energy costs, equipment failures, and inefficient maintenance processes.
However, KPI dashboards help solve these problems.
The dashboard improves facility management by:
- Identifying performance bottlenecks
- Monitoring energy usage trends
- Tracking equipment efficiency
- Detecting system failures early
- Supporting preventive maintenance strategies
As a result, organizations improve operational efficiency and reduce downtime.
Best Practices for Building Automation KPI Dashboard
To maximize the effectiveness of the dashboard, organizations should follow several best practices.
Define Clear KPIs
Organizations must select KPIs that align with facility management goals.
Examples include energy efficiency, maintenance response time, and system reliability.
Maintain Data Accuracy
Accurate data entry ensures reliable insights.
Therefore, teams should validate data regularly.
Review KPIs Regularly
Facility managers should review dashboard performance monthly.
Regular monitoring helps identify operational issues early.
Use Historical Comparisons
Comparing current performance with previous years helps track improvement trends.
Keep Dashboard Simple
A clear and simple dashboard improves usability.
Avoid adding unnecessary metrics that create confusion.
How Can Organizations Implement This Dashboard Successfully?
Organizations can implement the Building Automation KPI Dashboard in Excel by following these steps:
- Identify the most important building performance KPIs
- Define targets for each KPI
- Collect operational data from building systems
- Enter data into the dashboard sheets
- Monitor monthly and yearly trends
- Use insights to improve building performance
This structured process ensures successful dashboard adoption.
Future of Building Automation Analytics
Building automation technology continues to evolve rapidly.
In the future, organizations will combine dashboards with advanced technologies such as:
- Internet of Things (IoT)
- Artificial Intelligence
- Predictive Maintenance Systems
- Smart Energy Optimization
However, even with advanced technologies, dashboards will remain essential for performance monitoring.
Excel dashboards continue to serve as powerful analytical tools for organizations of all sizes.
Conclusion
The Building Automation KPI Dashboard in Excel provides a powerful yet simple solution for monitoring building performance.
It helps organizations track energy efficiency, maintenance effectiveness, system uptime, and operational costs.
Moreover, the dashboard structure with 7 worksheets allows users to manage data easily while analyzing performance trends.
Because of its flexibility, Excel allows facility managers to customize KPIs based on their operational needs.
Therefore, organizations can improve building efficiency, reduce operational costs, and make better facility management decisions using this dashboard.
Frequently Asked Questions (FAQs)
What is a Building Automation KPI Dashboard?
A Building Automation KPI Dashboard is a performance monitoring tool that tracks key metrics related to building systems such as energy consumption, HVAC performance, maintenance efficiency, and operational costs.
Why should organizations use an Excel KPI dashboard?
Excel dashboards are easy to use, customizable, and cost effective. They allow organizations to analyze operational data and track performance indicators efficiently.
What types of KPIs are included in a building automation dashboard?
Typical KPIs include energy consumption, HVAC efficiency, equipment downtime, maintenance response time, system uptime, and operational cost metrics.
How often should KPI dashboards be updated?
Organizations should update KPI dashboards monthly or weekly depending on operational requirements.
Regular updates ensure accurate performance monitoring.
Can the Building Automation KPI Dashboard be customized?
Yes. Excel dashboards are highly customizable.
Organizations can add new KPIs, modify charts, and adjust calculations according to their operational needs.
Visit our YouTube channel to learn step-by-step video tutorials
Watch the step-by-step video tutorial:
Click to buy Building Automation KPI Dashboard in Excel