New: NextGenTemplates Academy - video courses on Excel formulas with AI and Pivot Tables & dashboards. Early-bird: 20% off with code EARLYBIRD20 - first 20 orders only.See the courses →
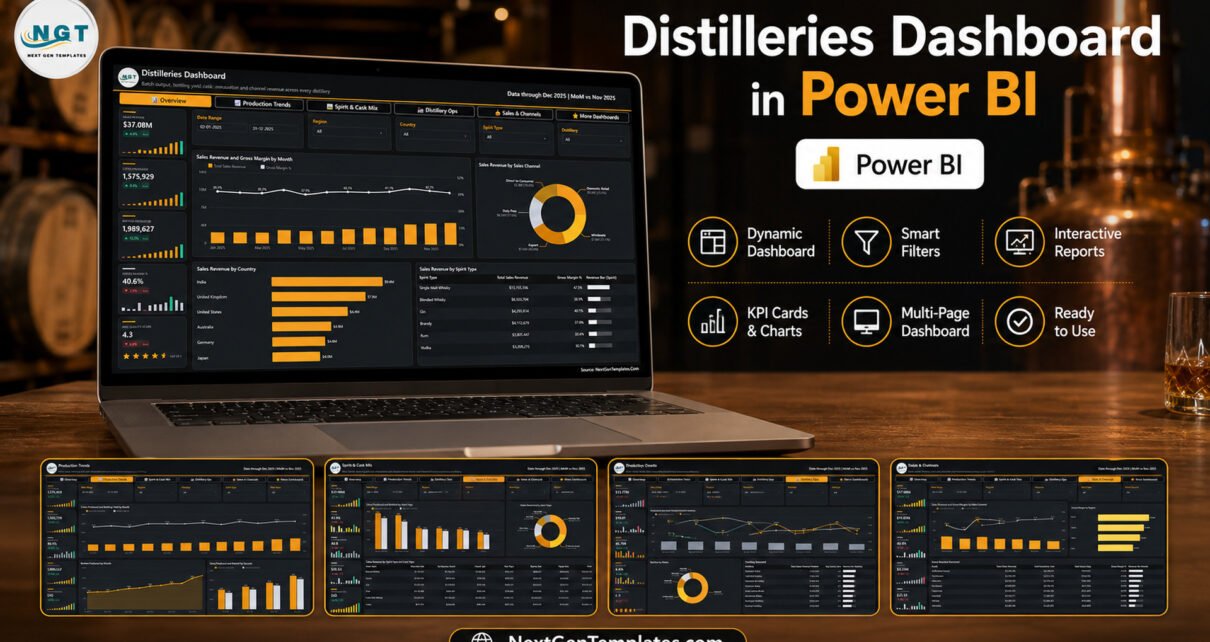
PKComments Off on Distilleries Dashboard in Power BI
A mid-sized spirits group running eight sites will generate a few hundred production batches a year, and almost all of that detail dies inside a batch log nobody opens. The
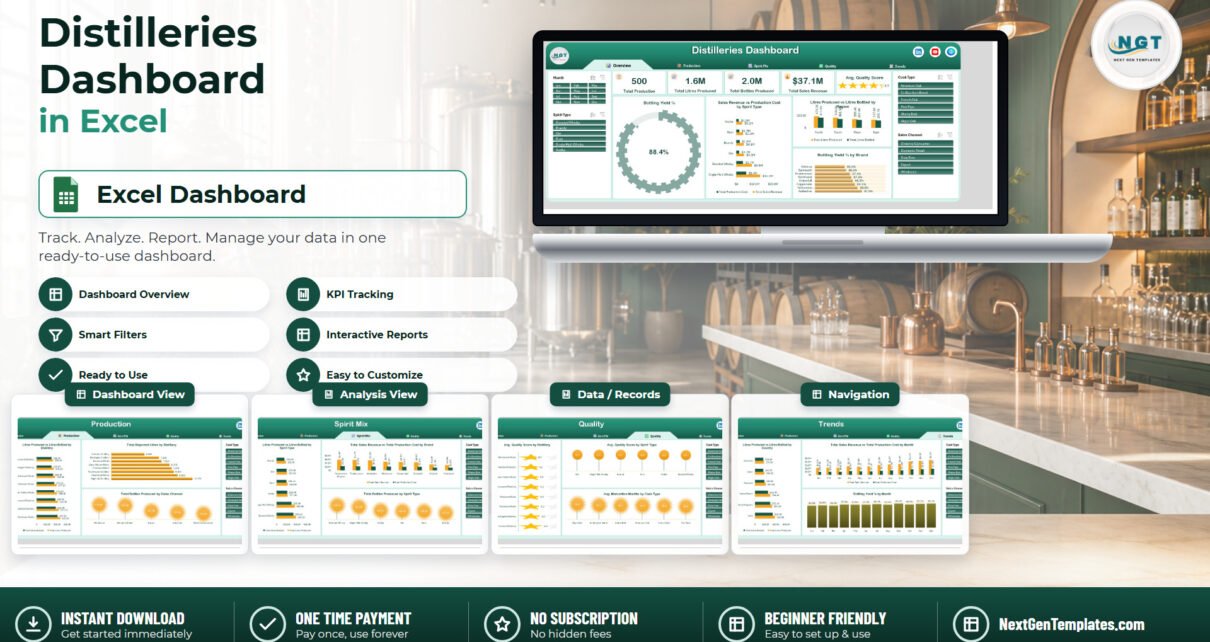
The Distilleries Dashboard in Excel turns a flat batch log into five linked reporting pages built on 21 pivot tables and 17 pivot charts, filtered live by four slicers. The
PKComments Off on Distilleries KPI Dashboard in Excel
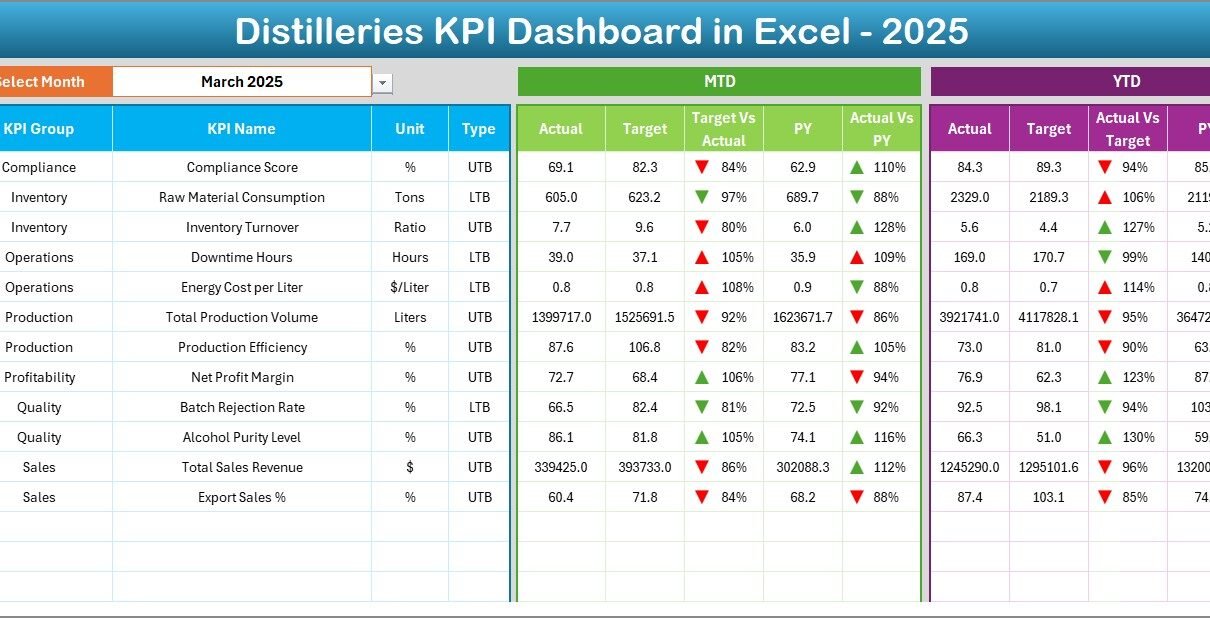
Running a distillery requires precision, discipline, and strong data control. You monitor fermentation levels, control aging cycles, track bottling efficiency, and manage distribution targets. However, if you track all these