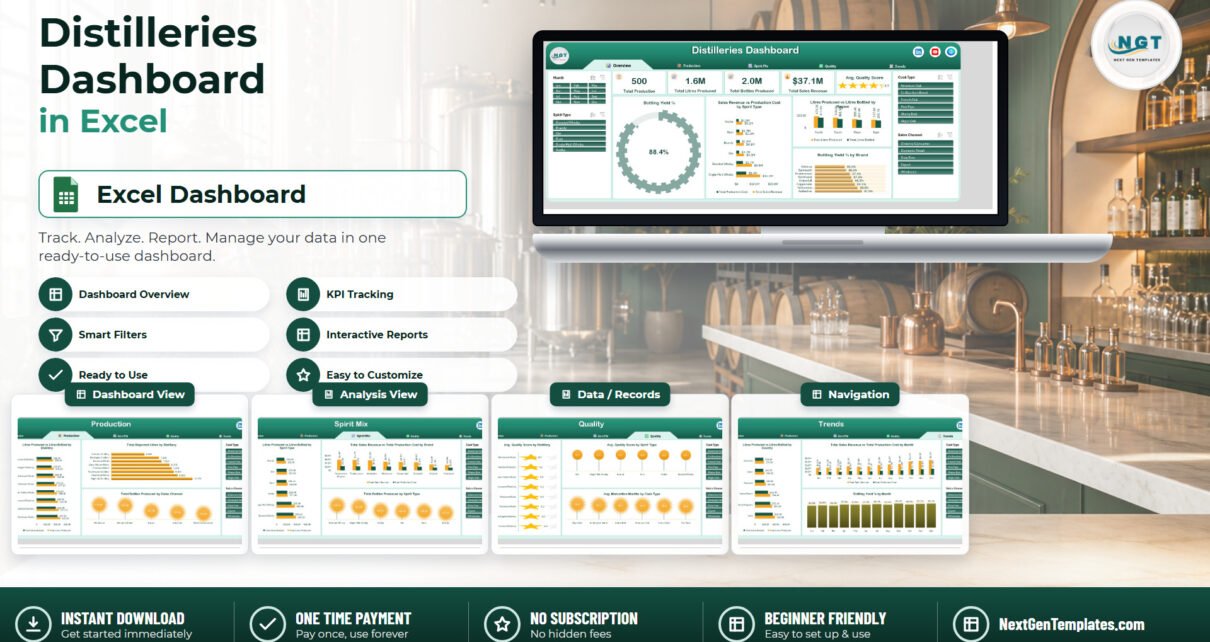
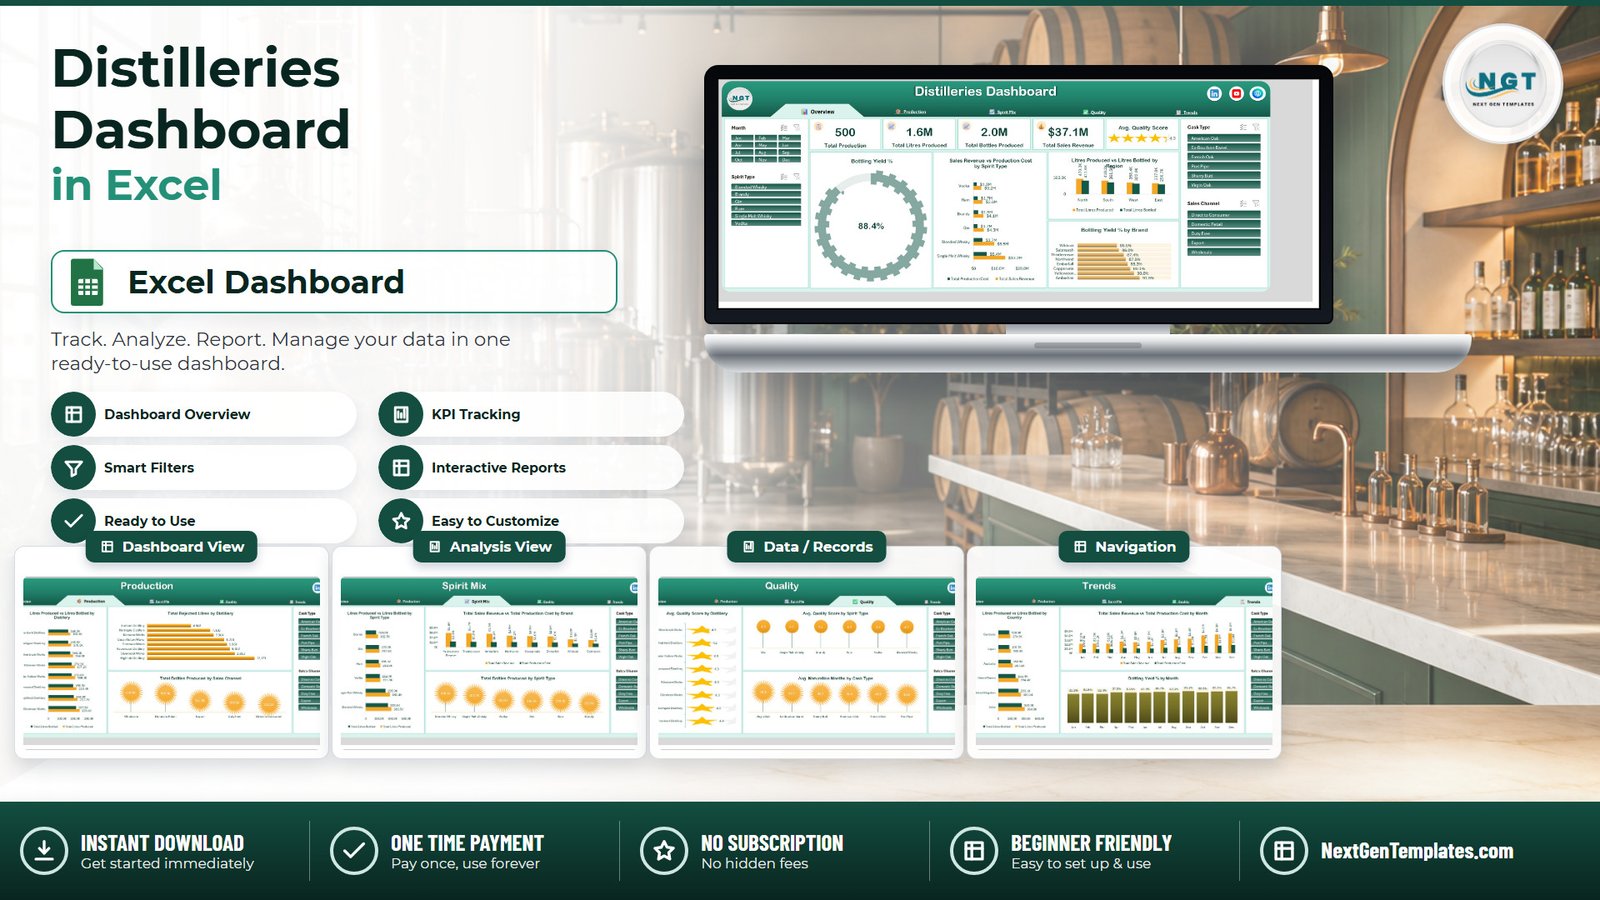
The Distilleries Dashboard in Excel turns a flat batch log into five linked reporting pages built on 21 pivot tables and 17 pivot charts, filtered live by four slicers. The workbook ships with 500 sample production batches across 22 fields, covering 8 distilleries, 8 brands, 6 spirit types, 6 cask types and 6 countries – 1.6M litres produced, 2.0M bottles filled, $37.1M in sales revenue and an 88.4% bottling yield.
Most distilleries already have the data. It sits in a batch spreadsheet, a bottling log and a QC form that nobody joins up, so the questions that actually matter – how many litres did we lose between still and bottle, which brand earns its production cost, which cask type ties up stock the longest – get answered once a quarter, by hand. The Distilleries Dashboard in Excel answers them the moment you paste your batch log in and press Refresh All.
Key Features of the Distilleries Dashboard in Excel
- Five linked pages. Overview, Production, Spirit Mix, Quality and Trends, with a tab strip on every sheet so you can jump between them without touching the Excel sheet tabs.
- Ten metrics tracked end to end. Total Production batches, Total Litres Produced, Total Litres Bottled, Total Bottles Produced, Total Rejected Litres, Bottling Yield %, Total Sales Revenue, Total Production Cost, Avg. Quality Score and Avg. Maturation Months.
- Four slicers, synced across all five pages. Month, Spirit Type, Cask Type and Sales Channel. Select “Export” on the Overview page and the Production, Spirit Mix, Quality and Trends pages are all cut to export batches too.
- 17 pivot charts on 21 pivot tables. Every visual is a real Excel pivot chart wired to the Data sheet – there is not a single pasted image of a chart in the workbook.
- Yield loss is the spine of the design. Litres Produced is charted against Litres Bottled by distillery, spirit type, region, country and month, with Total Rejected Litres by Distillery sitting next to it.
- Cask and maturation analysis. Avg. Maturation Months by Cask Type spans American Oak, Ex-Bourbon Barrel, French Oak, Port Pipe, Sherry Butt and Virgin Oak.
- 500 sample records across 22 fields – Batch ID, Production Date, Distillery, Region, Country, Spirit Type, Brand, Cask Type, Sales Channel, Litres Produced, Litres Bottled, Bottles Produced, Rejected Litres, Alcohol By Volume, Maturation Months, Quality Score, Production Cost, Sales Revenue, Excise Duty, Status, Month and Year.
- Plain .xlsx, no macros. Nothing to enable, nothing to install, nothing to renew.
Dashboard Pages Explanation
Seven sheets in total: five you look at, one you paste into, and one that holds the pivot tables.
Page 1: Overview
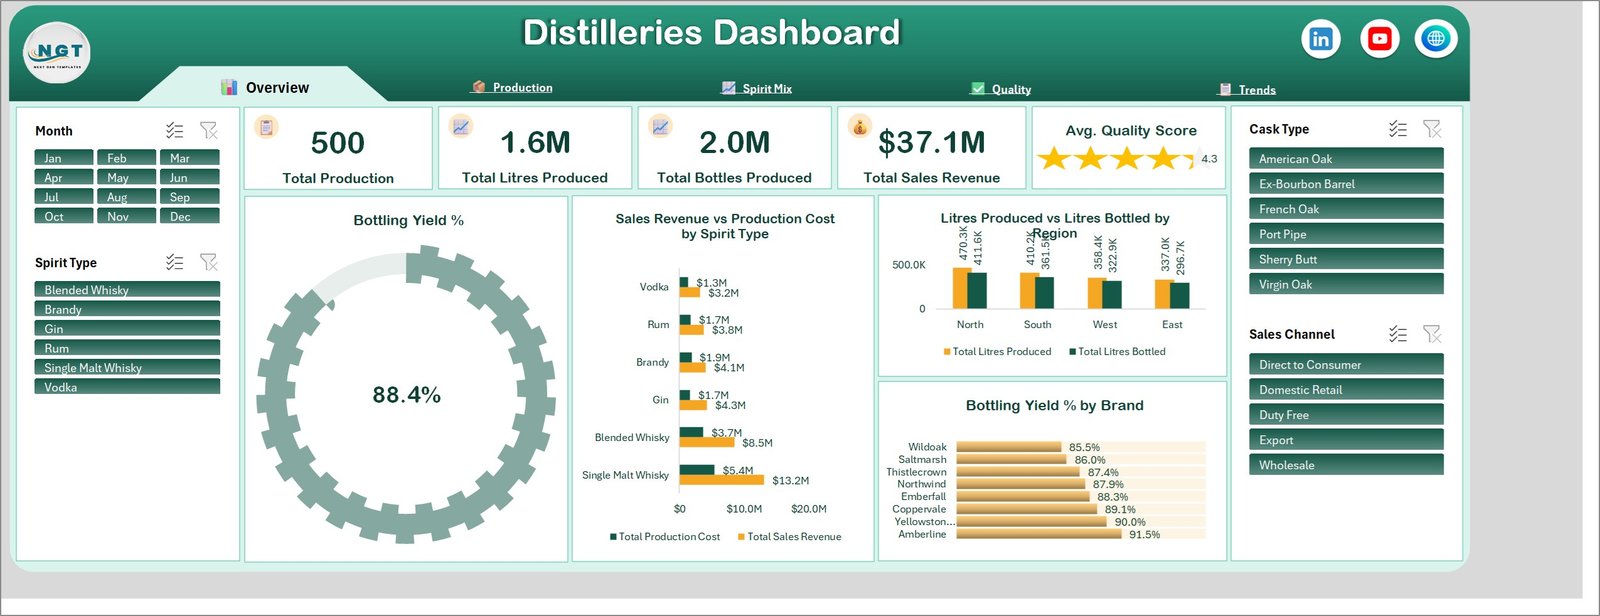
The landing page carries five KPI cards – Total Production (500 batches), Total Litres Produced (1.6M), Total Bottles Produced (2.0M), Total Sales Revenue ($37.1M) and Avg. Quality Score (4.3, rendered as stars). Underneath sit a Bottling Yield % gauge at 88.4%, Sales Revenue vs Production Cost by Spirit Type, Litres Produced vs Litres Bottled by Region and Bottling Yield % by Brand, which ranks all eight brands from 85.5% to 91.5%.
Page 2: Production
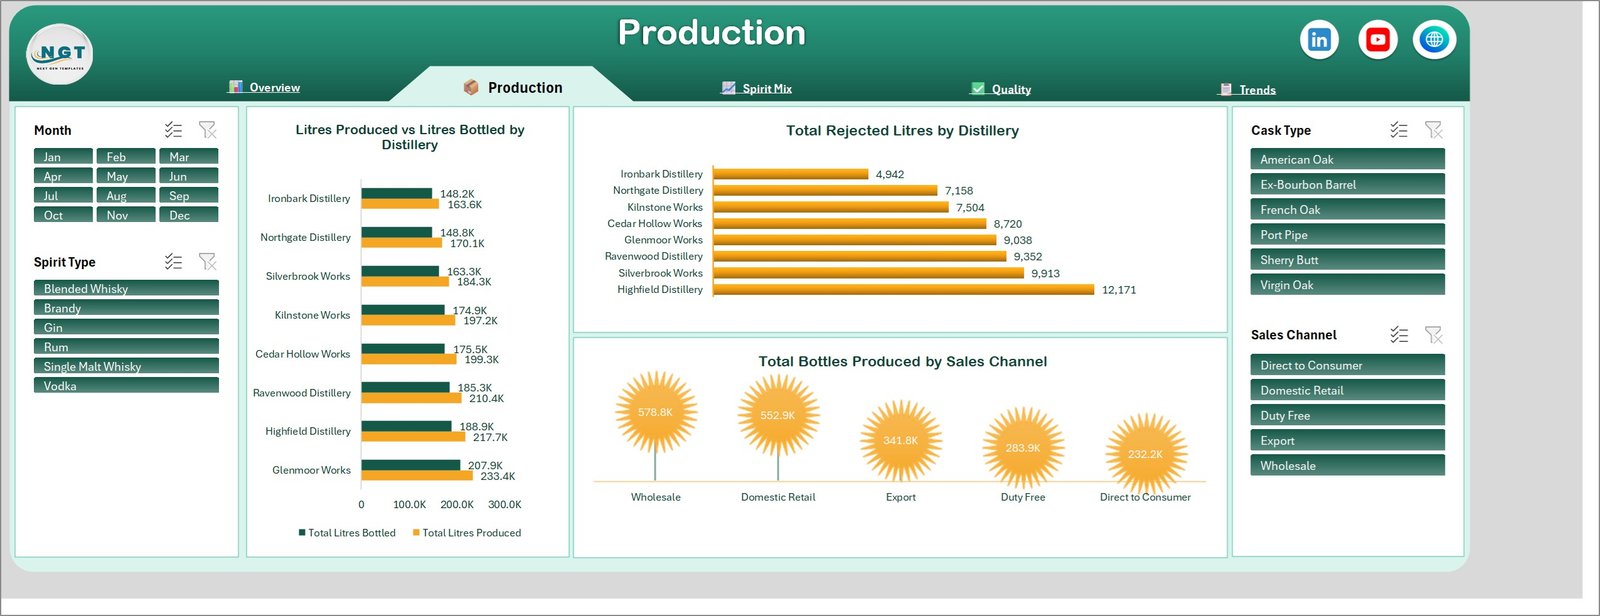
The plant view. Litres Produced vs Litres Bottled by Distillery ranks all eight sites side by side, Total Rejected Litres by Distillery shows where wastage concentrates, and Total Bottles Produced by Sales Channel splits output across Wholesale, Domestic Retail, Export, Duty Free and Direct to Consumer. This is the page a production manager opens first on a Monday morning.
Page 3: Spirit Mix
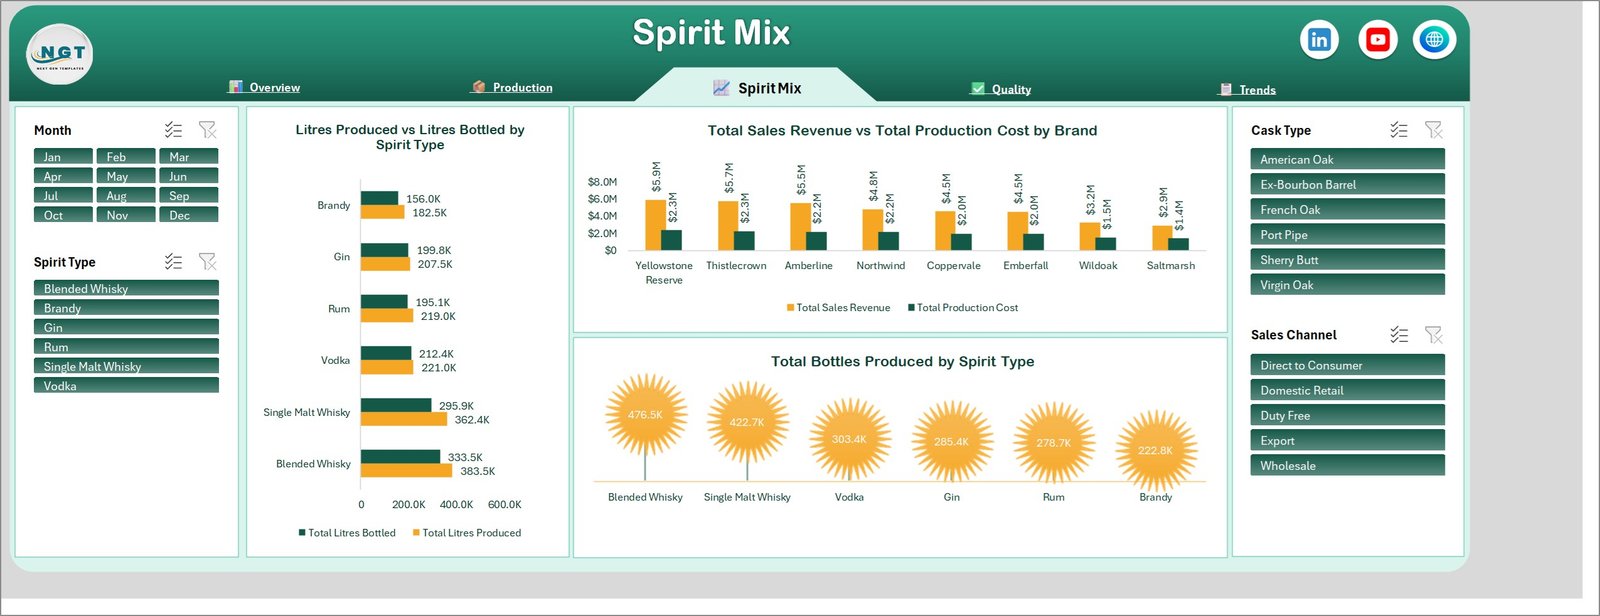
The portfolio view. Litres Produced vs Litres Bottled by Spirit Type covers Blended Whisky, Single Malt Whisky, Vodka, Rum, Gin and Brandy. Next to it, Total Sales Revenue vs Total Production Cost by Brand ranks all eight brands so margin gaps are obvious, and Total Bottles Produced by Spirit Type shows volume share at a glance.
Page 4: Quality
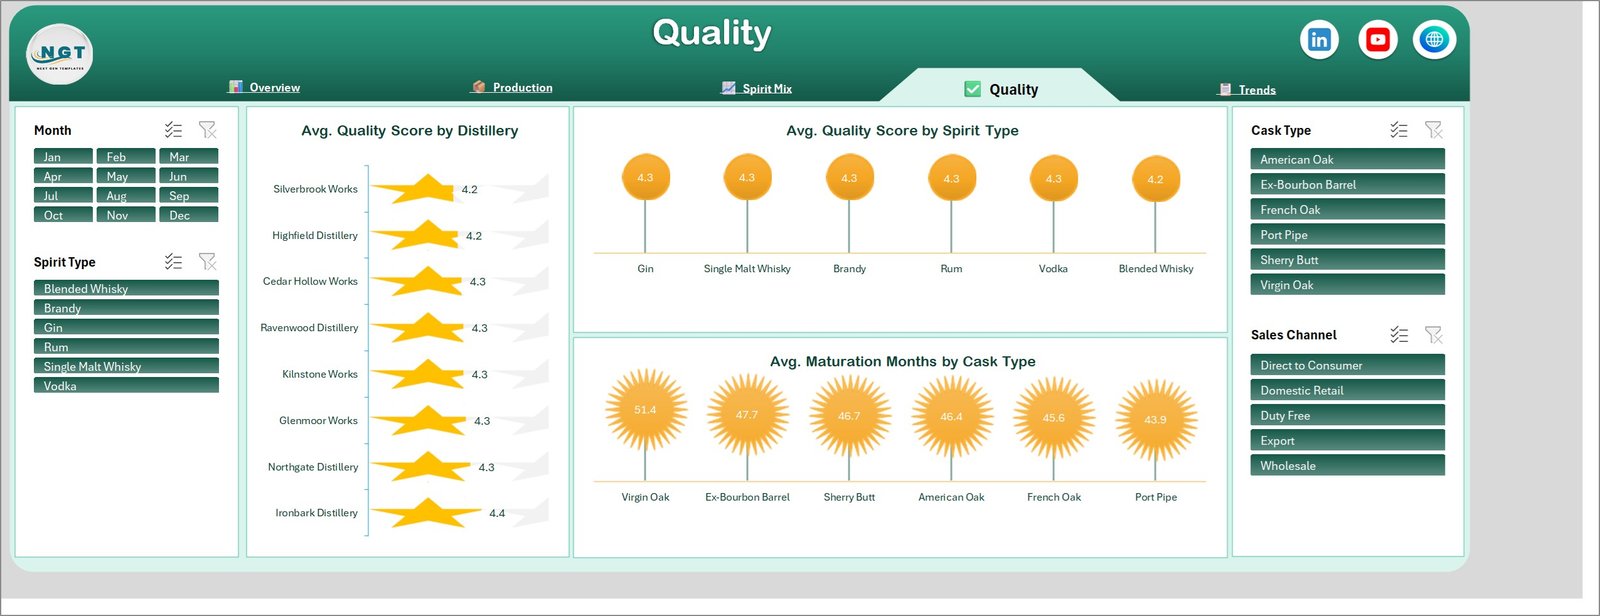
The QC view. Avg. Quality Score by Distillery scores each site on a five-star scale, Avg. Quality Score by Spirit Type compares the six spirits, and Avg. Maturation Months by Cask Type shows how long stock sits in each wood – useful when you are deciding whether a cask programme is worth the working capital it consumes.
Page 5: Trends
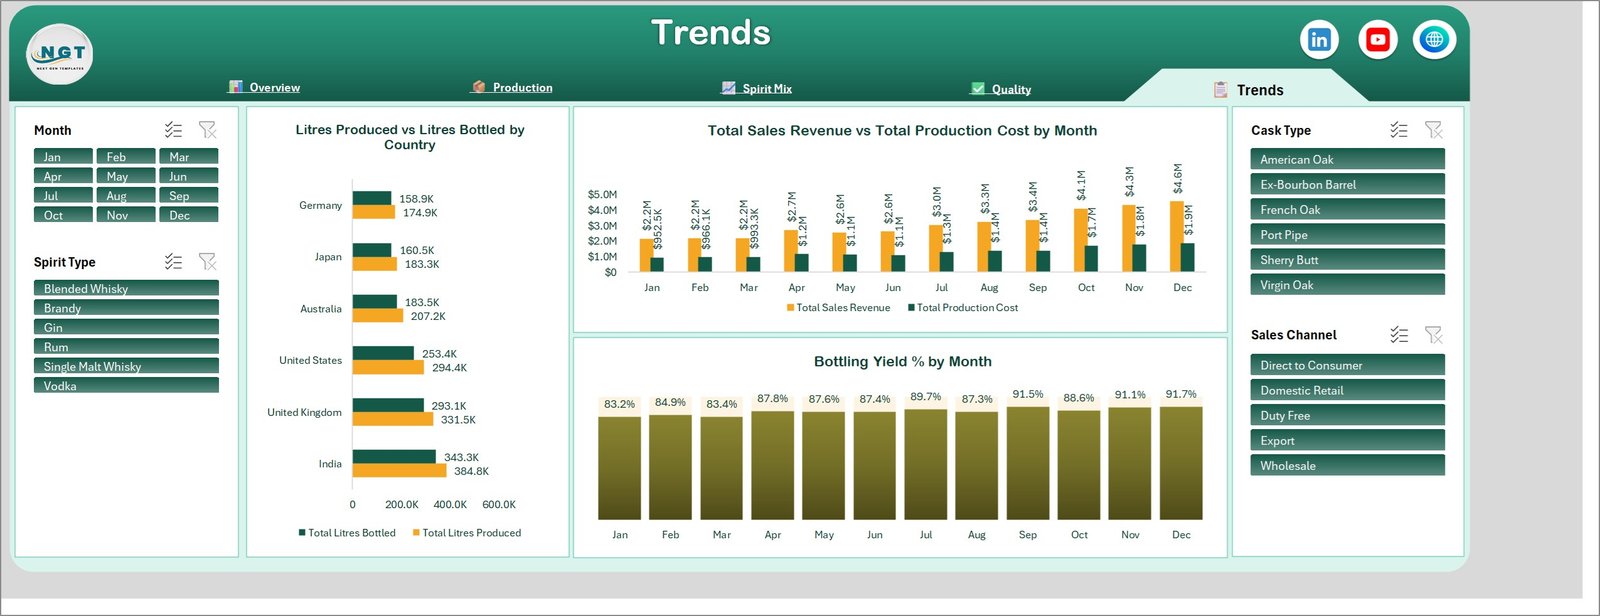
The time and geography view. Litres Produced vs Litres Bottled by Country covers India, the United Kingdom, the United States, Australia, Japan and Germany. Total Sales Revenue vs Total Production Cost by Month and Bottling Yield % by Month both run the full Jan-Dec cycle, so seasonality and yield drift can be read against each other.
Data Sheet
A flat table of 500 batch records across 22 columns. Delete the sample rows, paste your own log in the same column order, and every page rebuilds on refresh.
Support Sheet
The 21 pivot tables that feed the charts live here, kept off the dashboard pages. You only open it if you want to add a chart or change how an existing one aggregates.
Distilleries Dashboard in Excel vs. Google Sheets vs. Paid Distillery ERP – Feature Comparison
| Feature | Distilleries Dashboard in Excel | Google Sheets equivalent | Ollie Ops / Vicinity Brew / Crafted ERP |
|---|---|---|---|
| Cost | $17.99 one-time | $0 but built by you | $200-800 / month |
| Platform | Microsoft Excel desktop, works offline | Browser, needs connectivity | Cloud only |
| Setup time | Under 10 minutes | Several days to build | 6-16 week implementation |
| Bottling yield and rejected litres tracking | ✅ Built in, by distillery, brand and month | Build it yourself | ✅ Yes, at a price |
| Cask type and maturation analysis | ✅ Avg. Maturation Months by Cask Type | Build it yourself | ✅ Yes |
| Real-time team collaboration | Via OneDrive / SharePoint | ✅ Native | ✅ Native |
| Mobile access | Excel mobile app (view) | ✅ Browser | ✅ Native app |
| Customizable fields and charts | ✅ Full – it is your workbook | ✅ Yes | Limited without a consultant |
| Year-1 cost at 5 users | $17.99 total | $0 + build time | $2,400-9,600 |
For distillers who want batch, yield, quality and margin reporting without a six-figure ERP rollout, the Distilleries Dashboard in Excel sits in the sweet spot.
Who Should Use This Template
Perfect for:
- Craft and mid-size distillery owners running 1-10 sites who report on batches in spreadsheets today
- Production and bottling managers who need litres produced, litres bottled and rejected litres in one view
- Brand and commercial managers weighing revenue against production cost across a multi-brand portfolio
- QC leads tracking quality scores and maturation months by cask type
- Analysts and consultants who need a beverage-production reporting pack ready in a day
Not a fit if:
- You need live shop-floor telemetry – this reads a batch log, it does not connect to sensors or SCADA
- You need statutory excise returns or bond-warehouse paperwork generated for you
- You need role-based access control and an audit trail on the underlying data – that is an ERP job
- You do not have Microsoft Excel on the desktop; slicers and pivot charts need it
Real-World Use Cases
Ravi runs a three-site gin and rum distillery in Goa. Every Monday he pastes the weekend batch log into the Data sheet and opens the Production page. Litres Produced vs Litres Bottled by Distillery showed one site consistently losing more litres than the other two, and Total Rejected Litres by Distillery confirmed it – a cracked filter housing he would otherwise have found months later while reconciling a paper log.
Claire is commercial director at a Scottish single malt house with eight brands. She works from the Spirit Mix page, where Total Sales Revenue vs Total Production Cost by Brand ranks the whole portfolio in one chart. That view is how she decided to push two brands harder into Duty Free and quietly stop promoting a third that was moving volume at almost no margin.
Tom is a QC manager at a contract bottler. He keeps Avg. Quality Score by Distillery above 4.2 and watches Avg. Maturation Months by Cask Type so nothing is pulled from Virgin Oak early. Once a month he filters to the current month with the slicer and exports the Quality page straight to PDF for the production meeting.
Advantages of the Distilleries Dashboard in Excel
- It costs once. $17.99 against $200-800 a month for a distillery ERP, and there are no per-user fees when a second production manager wants a copy.
- It works offline. Distillery floors and bonded warehouses are not famous for wifi. The workbook runs from a laptop with no connection at all.
- Nothing is locked. Every chart, pivot and slicer is standard Excel, so your own analyst can change the aggregation or add a chart without a support ticket.
- It reports on data you already keep. Batch ID, litres, bottles, cask, quality score and cost are fields most distilleries already record somewhere.
- It saves the monthly rebuild. The slicer-plus-refresh cycle replaces the copy-paste-into-slides ritual that eats a day every month.
Opportunities for Improvement
Being straight about the edges, because they matter when you are choosing:
- It is a reporting layer, not a system of record. There is no data-entry form and no validation on the Data sheet – a mistyped litre figure will pass straight through into the charts.
- Excise duty is captured but not analysed. The field is in the Data sheet, yet no page charts it. If duty is a headline number for you, add a pivot on the Support sheet.
- No target or budget column. The dashboard shows actuals. If you want actual-vs-target with status flags, the KPI dashboard and KPI scorecard versions of this template are built for that.
- Slicers on Excel for the web are limited. The pages display, but pivot caches do not refresh reliably in the browser – keep the refresh cycle on desktop Excel.
- 500 rows is the sample, not the ceiling. The pivots handle far more, but the sample size means you should re-check chart axis scaling once your own multi-year log is loaded.
Best Practices
- Keep the column order and header names on the Data sheet exactly as shipped – Spirit Type, Cask Type, Sales Channel and Month feed the slicers directly.
- Use one row per batch, not per bottling run, so Bottling Yield % stays meaningful.
- Standardise distillery and brand spellings before pasting. Two spellings of the same site become two bars on every chart.
- Refresh once after every paste with Data > Refresh All, or Ctrl+Alt+F5. If a chart looks stale, that step was skipped.
- Clear all four slicers before you export a page to PDF, or use the filter icon in the slicer header, so the reader is not looking at a filtered view by accident.
- Save the working copy to OneDrive or SharePoint so the team reads one file rather than five emailed versions.
- If you want more on how pivot tables and slicers behave, Microsoft’s own guide is the best reference: Use slicers to filter data.
Explore Relevant Templates
This is the analytical dashboard for distilleries – five pages of pivot charts across the entire batch log. NextGenTemplates also publishes KPI dashboards and KPI scorecards for the same industry; they are different products, not other copies of this one:
- Distilleries KPI Dashboard in Excel – a month-picker KPI view with targets and status flags.
- Distillery KPI Scorecard in Excel – ten KPIs, twelve months of actuals against target.
- Micro Breweries Pubs Dashboard in Excel – the same analytical layout for beer.
- Craft Winery and Vineyard Dashboard in Excel – vineyard, harvest and cellar reporting.
- Brewery & Winery Dashboard in Excel – a combined view for producers running both lines.
Also available as: Distilleries KPI Dashboard in Power BI and Distillery KPI Dashboard in Google Sheets. You can also browse the full range of Excel Dashboard Templates.
More on this blog: Quality & Audit Management Bundle – 8 Premium Excel Templates (Save 40%), Museum Dashboard in Excel and Marina Dashboard in Excel.
Frequently Asked Questions
What metrics does the Distilleries Dashboard in Excel track?
The Distilleries Dashboard in Excel tracks ten metrics: Total Production batches, Total Litres Produced, Total Litres Bottled, Total Bottles Produced, Total Rejected Litres, Bottling Yield %, Total Sales Revenue, Total Production Cost, Avg. Quality Score and Avg. Maturation Months. All of them recalculate when you replace the sample data with your own batch log.
How long does setup take?
Under 10 minutes. Open the workbook, clear the 500 sample rows on the Data sheet, paste your own records in the same column order and press Refresh All. The Distilleries Dashboard in Excel rebuilds all 21 pivot tables and 17 charts on your numbers straight away.
Do I need macros or add-ins to run it?
No. The Distilleries Dashboard in Excel is a plain .xlsx workbook built on native pivot tables, pivot charts and slicers. There are no macros to enable and no add-ins to install, so it opens cleanly even on a locked-down corporate machine.
How does this compare to a paid distillery ERP such as Ollie or Vicinity Brew?
A distillery ERP typically runs $200-800 per month and takes 6-16 weeks to implement. The Distilleries Dashboard in Excel is a one-time $17.99 purchase that answers the same yield, quality and margin questions. It is the reporting layer only – it does not handle inventory transactions or excise filing.
Can I add my own distilleries, brands, cask types or spirit types?
Yes. The Distilleries Dashboard in Excel reads whatever values appear in your Data sheet, so new distilleries, brands, cask types or sales channels appear in the charts and slicers automatically after a refresh. No formulas need editing.
Which versions of Excel does it support?
The Distilleries Dashboard in Excel works in Excel 2016, 2019, 2021 and Microsoft 365 on Windows, and in Excel for Mac 2016 and later. Slicer behaviour is best on Windows desktop; Excel for the web can display the pages but will not refresh pivot caches reliably.
Is the sample data taken from a real distillery?
No. The 500 batch records inside the Distilleries Dashboard in Excel are realistic but fictional, covering eight invented distilleries and eight invented brands. They exist so every chart is populated before you load your own production data.
About the Author
Built by PK – Microsoft Certified Professional with 15+ years of Excel, Google Sheets and Power BI experience. Founder of NextGenTemplates, reaching 300K+ subscribers across YouTube channels. Every template is hand-built and tested before release.
Conclusion
If your distillery already keeps a batch log, the reporting problem is not data collection – it is that nobody has time to turn the log into a picture every month. The Distilleries Dashboard in Excel does that in one refresh, across five pages, with yield loss, cask maturation, quality scores and brand margin all on the same four slicers.
👉 Click here to Purchase the Distilleries Dashboard in Excel
Instant download · One-time payment · No subscription
For step-by-step Excel dashboard tutorials, visit Youtube.com/@PKAnExcelExpert.
Last updated: September 2026