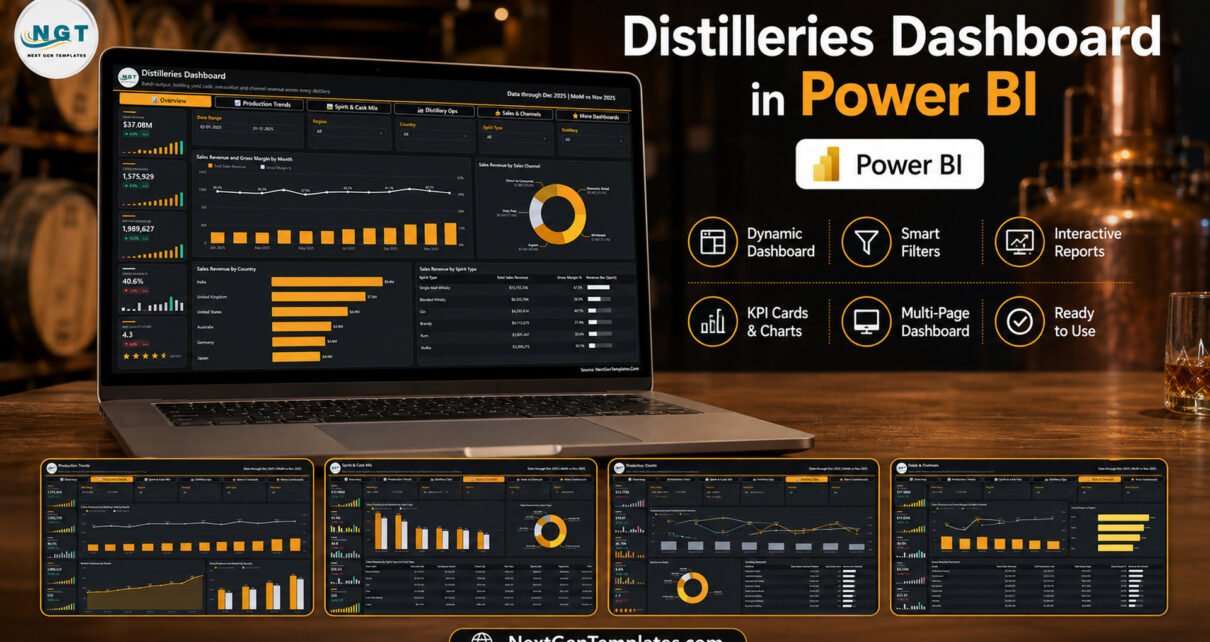
A mid-sized spirits group running eight sites will generate a few hundred production batches a year, and almost all of that detail dies inside a batch log nobody opens. The Distilleries Dashboard in Power BI takes exactly that kind of log – 500 rows, 20 columns – and turns it into five report pages that answer the questions a distillery actually argues about: which site is rejecting the most spirit, which cask type earns the most revenue per litre, and whether the bottling line is keeping up with the stills. On the sample data it reports $37.08M of sales revenue, 1,575,929 litres produced, 1,989,627 bottles produced, an 88.4% bottling yield and a 4.4% rejection rate.
Key Features of the Distilleries Dashboard in Power BI
- Five report pages behind one button bar. Overview, Production Trends, Spirit & Cask Mix, Distillery Ops and Sales & Channels, plus a More Dashboards page. The bar sits at the top of every page, so navigation never depends on the Power BI page tabs.
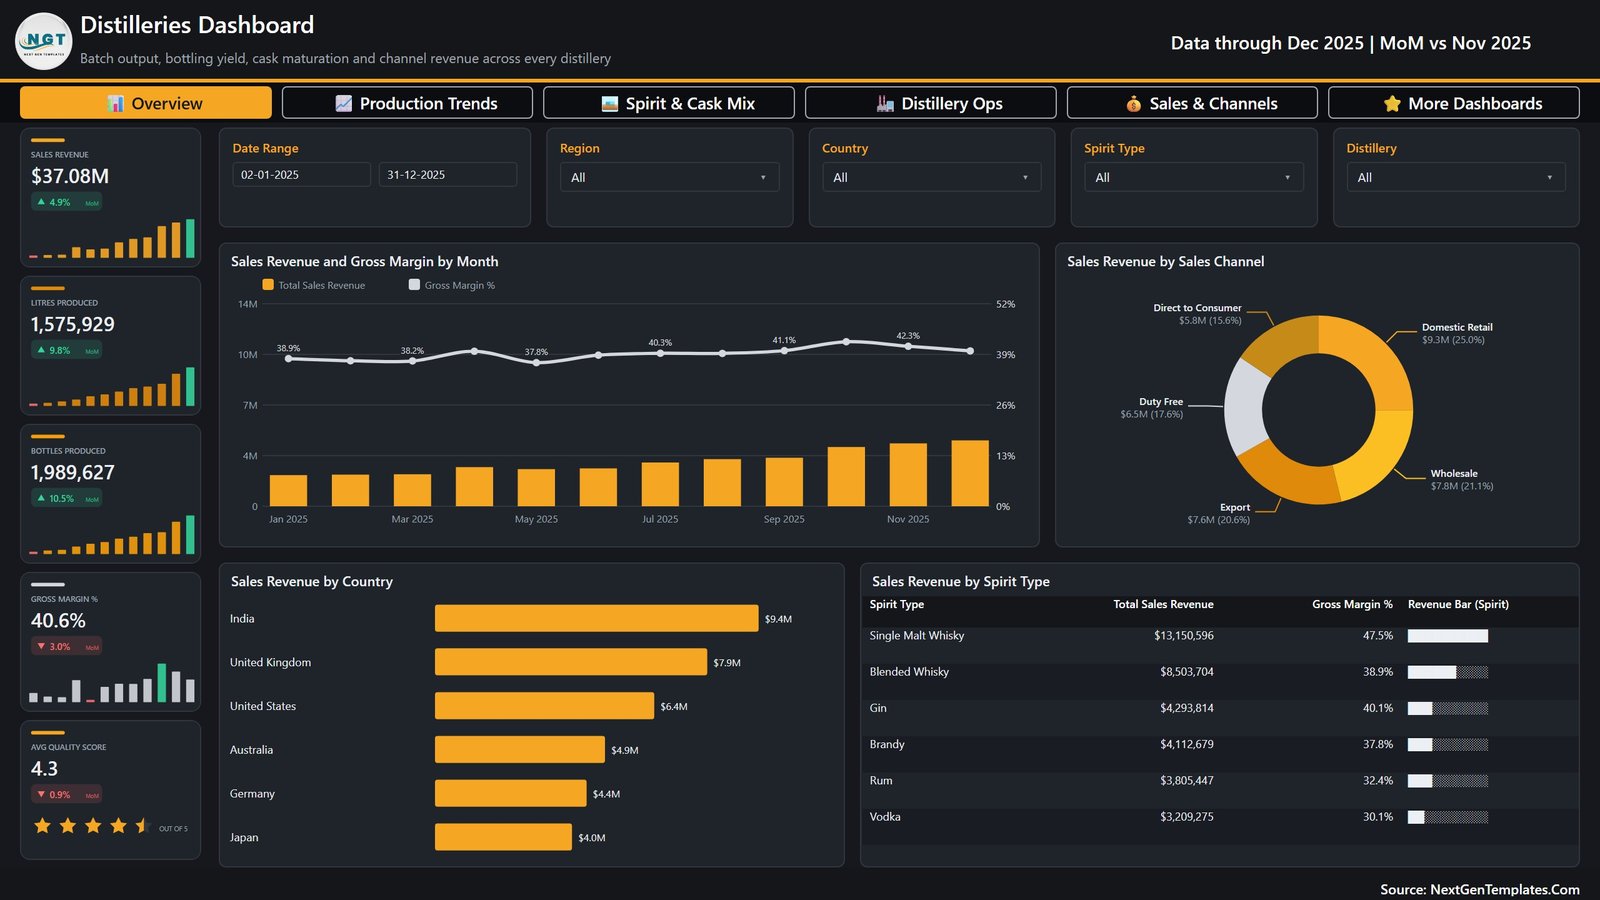
- 25 KPI cards, each with a month-on-month delta and a sparkline. Sales Revenue $37.08M at +4.9% MoM, Litres Produced 1,575,929 at +9.8%, Bottles Produced 1,989,627 at +10.5%, Gross Margin % 40.6% at -3.0%, Avg Quality Score 4.3 shown as 4.5 stars out of 5.
- Consistent slicers. A Date Range pair plus Region, Country and Spirit Type appear on all five pages. The fifth slicer changes with the page – Distillery, Cask Type, Brand, Status or Sales Channel.
- Combo charts that pair a volume and a rate. Revenue columns against a gross-margin line; litres columns against a bottling-yield line; production-cost columns against a rejection-rate line.
- Two donuts with values and shares on the labels, so you read $9.3M (25.0%) rather than hovering for a tooltip.
- A six-by-six matrix crossing every spirit type with every cask type, totalled.
- Two ranked scorecards – one for eight distilleries, one for eight brands – each with an in-cell revenue bar.
Dashboard Pages Explanation
Page 1 – Overview
Five KPI cards down the left, then Sales Revenue and Gross Margin by Month, where the margin line moves between 37.8% and 42.3% while revenue columns climb through the year. To its right, Sales Revenue by Sales Channel: Domestic Retail $9.3M (25.0%), Wholesale $7.8M (21.1%), Export $7.6M (20.6%), Duty Free $6.5M (17.6%) and Direct to Consumer $5.8M (15.6%). Below, Sales Revenue by Country ranks India $9.4M, the United Kingdom $7.9M, the United States $6.4M, Australia $4.9M, Germany $4.4M and Japan $4.0M, beside a Sales Revenue by Spirit Type table led by Single Malt Whisky at $13,150,596 and a 47.5% gross margin.
Page 2 – Production Trends
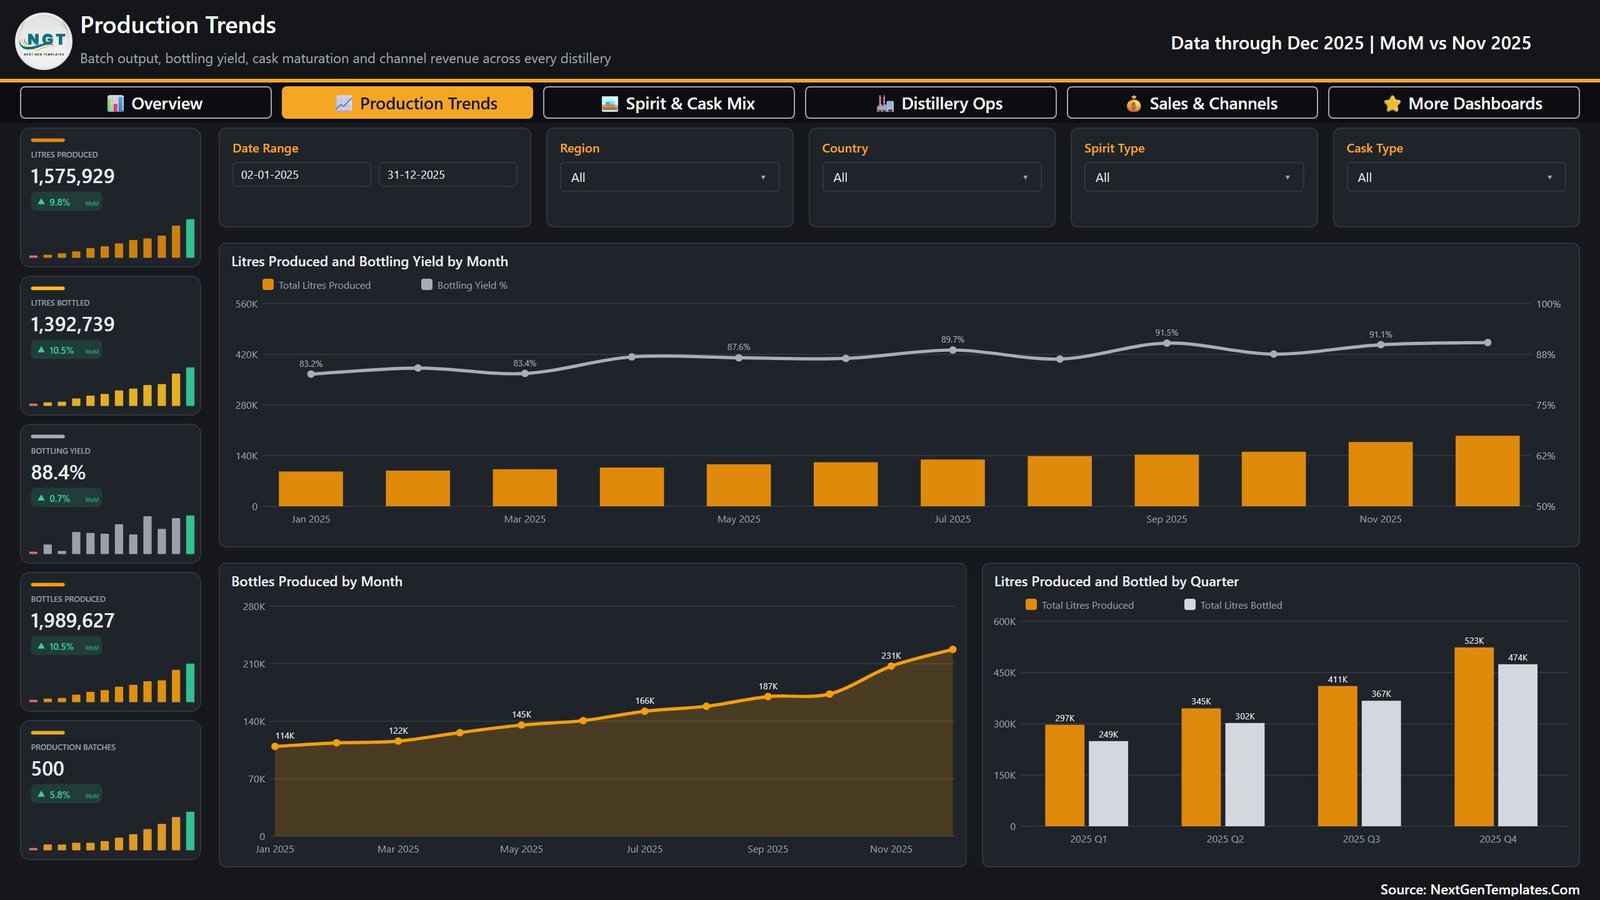
Litres Produced, Litres Bottled, Bottling Yield, Bottles Produced and Production Batches (500) head the page. Litres Produced and Bottling Yield by Month shows yield rising from 83.2% in January to 91.5% in September. Bottles Produced by Month runs 114K in January to 231K in November. Litres Produced and Bottled by Quarter puts Q1 at 297K produced against 249K bottled, and Q4 at 523K against 474K.
Page 3 – Spirit & Cask Mix
Avg ABV 41.9%, Maturation Months 46.8 and Revenue per Litre $23.53 join the revenue and batch cards. Litres Produced and Bottled by Spirit Type puts Blended Whisky first at 383K produced and 334K bottled, then Single Malt Whisky at 362K and 296K. Sales Revenue by Cask Type splits American Oak $10.8M (29.1%), Ex-Bourbon Barrel $7.9M (21.3%), French Oak $7.4M (19.9%), Sherry Butt $4.8M (12.8%), Port Pipe $3.2M (8.7%) and Virgin Oak $3.1M (8.2%). The matrix underneath crosses the two, so Single Malt Whisky in American Oak reads $3,324,362.
Page 4 – Distillery Ops
Production Cost $15.77M, Cost per Litre $10.01, Rejected Litres 68,798 and Rejection Rate 4.4%. Production Cost and Rejection Rate by Distillery ranks eight sites – Highfield Distillery worst at 5.6%, Silverbrook Works at 5.4%, Ironbark Distillery best at 3.0%. Batches by Status splits 289 Released (57.8%), 87 In Maturation (17.4%), 54 Under QC (10.8%), 47 Reworked (9.4%) and 23 Rejected (4.6%). The Distillery Scorecard lists revenue and average quality score per site, from Glenmoor Works at $5,455,712 down to Ironbark at $3,811,765.
Page 5 – Sales & Channels
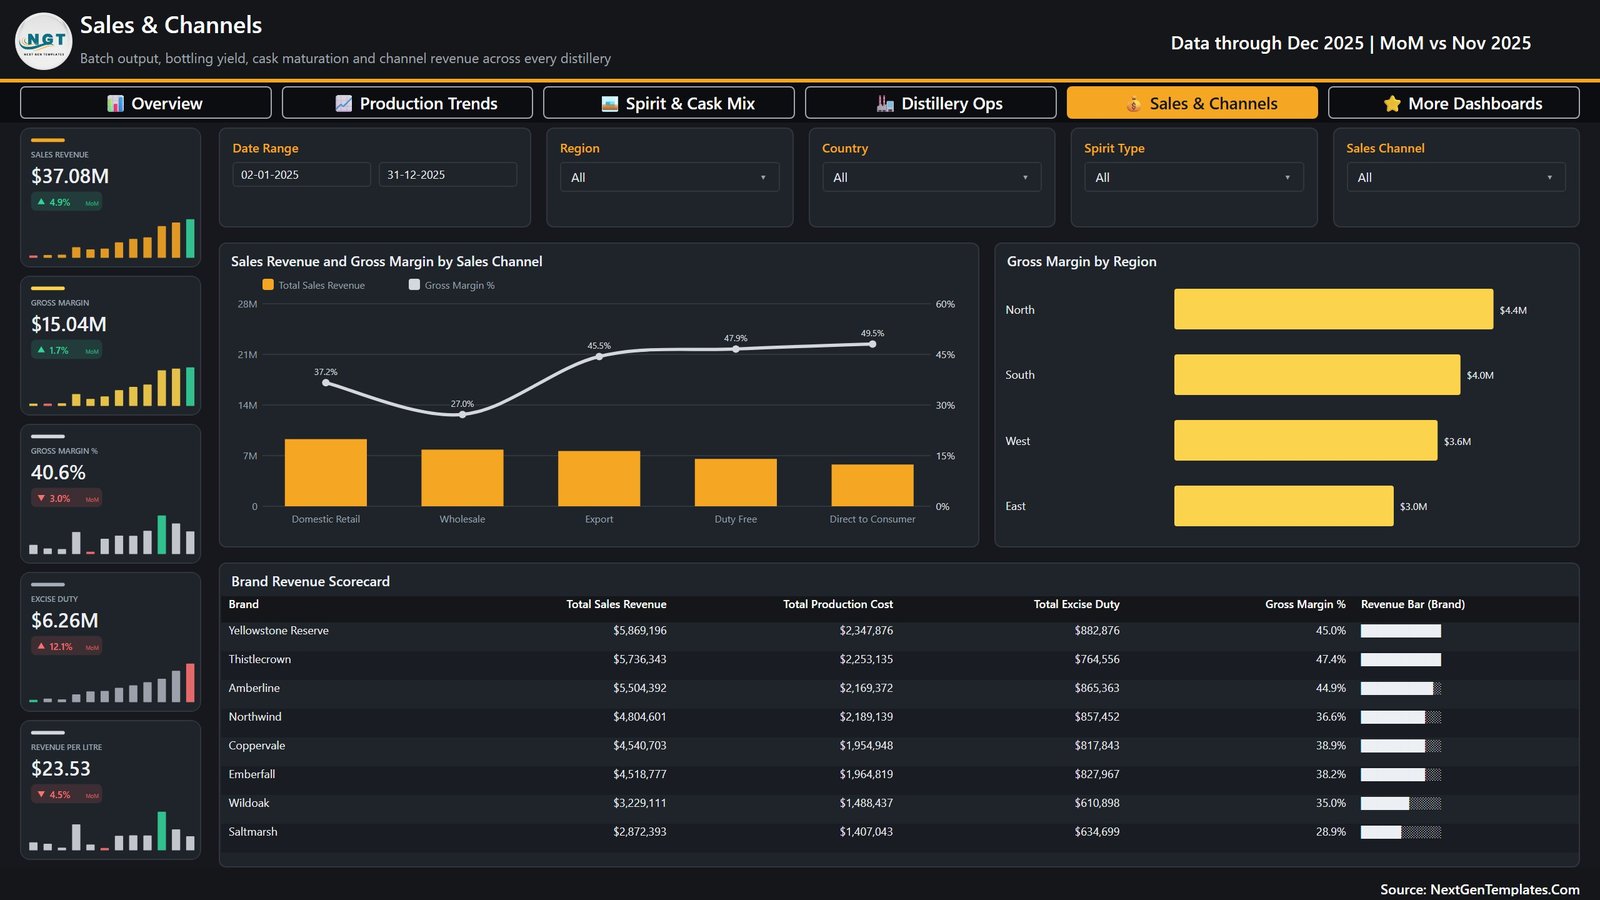
Gross Margin $15.04M and Excise Duty $6.26M lead here. Sales Revenue and Gross Margin by Sales Channel shows the trade-off plainly: Domestic Retail carries the most revenue at a 37.2% margin, Wholesale the thinnest at 27.0%, while Direct to Consumer is the richest at 49.5%. Gross Margin by Region runs North $4.4M, South $4.0M, West $3.6M, East $3.0M. The Brand Revenue Scorecard puts Yellowstone Reserve first at $5,869,196 and a 45.0% margin, Saltmarsh last at $2,872,393 and 28.9%.
Distilleries Dashboard in Power BI vs. an Excel Build vs. a Paid Distillery ERP
| This template | Excel dashboard build | Paid distillery ERP / BI suite | |
|---|---|---|---|
| Cost | $29.99 one time | $0 plus your build time | $300-$1,200 per month |
| Platform | Power BI Desktop (free) | Microsoft Excel | Vendor cloud |
| Setup time | Under 15 minutes | 20-40 hours | 4-12 weeks |
| Real-time team collaboration | Yes, once published to the service | Shared workbook only | Yes |
| Mobile access | Power BI mobile app | Limited | Yes |
| Customisable fields | Full – it is your .pbix | Full | Vendor-controlled |
| Share with a link | Yes | No | Yes |
| Year-1 cost at 5 users | $29.99 | $0 plus 30 hours of labour | $18,000-$72,000 |
| Cask maturation analysis | Built in | Manual | Usually a paid module |
| Excise duty as a first-class measure | Yes | Manual | Yes |
Who Should Use This Template
Group operations managers running three to twelve sites who need one weekly view of yield, cost and rejection. Spirits brand owners who contract-distil and care about brand-level margin more than plant detail. Production planners reconciling litres produced against litres bottled. Finance analysts who want excise duty separated from cost of goods. And any Power BI learner who wants a finished, non-trivial model to take apart – the DAX and the page layout are all visible.
Real-World Use Cases
The Monday operations review. Open Distillery Ops, leave every slicer on All, and read the rejection-rate line. Two sites above the 4.4% group average get the quality review; the rest do not. The Batches by Status donut says how much spirit is sitting Under QC before anyone asks.
The brand portfolio decision. Filter Sales & Channels to a brand family and read the scorecard. A brand at 28.9% margin and a brand at 47.4% margin are not the same business, even when their revenue looks similar.
The cask buying conversation. Page 3 puts revenue per cask type beside average maturation months. If American Oak is carrying 29.1% of revenue while Virgin Oak carries 8.2%, that is a purchasing argument with a number attached.
Advantages of This Dashboard
- It opens finished. No data modelling step, no blank canvas – the measures, formatting and page layout already exist.
- The visual titles say what they measure, in the {Metric} by {Category} form, rather than naming a chart type.
- Rate and volume always appear together, so a rising yield percentage on falling volume cannot be mistaken for good news.
- It is a plain .pbix. Nothing is locked, so you can add a measure, remove a page, or lift the theme into another report.
- Free to run. Power BI Desktop costs nothing; you only pay Microsoft if you publish to the service for sharing.
Opportunities for Improvement
Being honest about the limits: the model is single-currency, so multi-country groups must convert before loading. There is no row-level security, so a published report shows every site to every viewer until you add RLS yourself. The date intelligence is calendar-based rather than fiscal. Cask maturation is reported as an average number of months rather than as an ageing cohort or an inventory valuation. And the excise duty figures are management reporting, not a regulatory filing – they are not a substitute for a TTB, HMRC or local revenue submission.
Best Practices
- Keep the 20 column headers in Data.xlsx exactly as shipped; renaming one breaks the visual that uses it.
- Load one row per production batch, not per bottle or per shipment, or the batch counts and rates will be wrong.
- Set the Date Range slicer first, then narrow by Region or Spirit Type – it is the fastest way to a comparable view.
- Use the Status slicer on Distillery Ops to separate released stock from stock still in maturation before quoting a yield.
- Publish to a workspace rather than emailing the .pbix, and set a scheduled refresh against a shared copy of the source file.
- Read the Microsoft Power BI data connection guidance before switching the source from Excel to a live database.
Explore Relevant Templates
- Distilleries Dashboard in Excel – the same analysis for teams without Power BI.
- Distilleries KPI Dashboard in Power BI – a target-versus-actual scorecard rather than an analytical report.
- Micro Breweries and Pubs Dashboard in Power BI – the beer-side equivalent.
- Craft Winery and Vineyard Dashboard in Power BI – harvest, cellar and vineyard analytics.
- Distillery KPI Scorecard in Excel – a monthly traffic-light scorecard.
Frequently Asked Questions
Do I need a paid Power BI licence?
No. Power BI Desktop is free and opens the .pbix. A Pro or Premium licence is only needed to publish and share through the Power BI service.
How do I load my own data?
Replace the rows in Data.xlsx, keeping the 20 headers, then use Transform data > Data source settings in Power BI to point at your file and click Refresh.
Is the sample data real?
No. The eight distillery names, eight brands and all figures are invented but realistic, so the report is explorable before you load anything confidential.
Can I add pages or measures?
Yes. Nothing in the file is locked or password-protected.
Will it work with more than 500 rows?
Yes. 500 is the sample size only; the same model handles millions of rows.
Where do I buy it?
The download is on our store: Distilleries Dashboard in Power BI on NextGenTemplates, $29.99 with a launch price of $17.99.
About the Author
Built by PK – Microsoft Certified Professional with 15+ years of Excel, Google Sheets, and Power BI experience. Founder of NextGenTemplates, reaching 300K+ subscribers across YouTube channels. Every template is hand-built and tested before release.
Conclusion
Batch logs are where distillery insight goes to be ignored. Five pages, 25 KPI cards and a handful of slicers turn the same 500 rows into a yield conversation, a rejection conversation and a margin conversation that a production meeting can actually run on. Download it, point it at your own batch export, and you will have a working group report inside fifteen minutes. For more Excel and Power BI walkthroughs, subscribe at youtube.com/@PKAnExcelExpert.