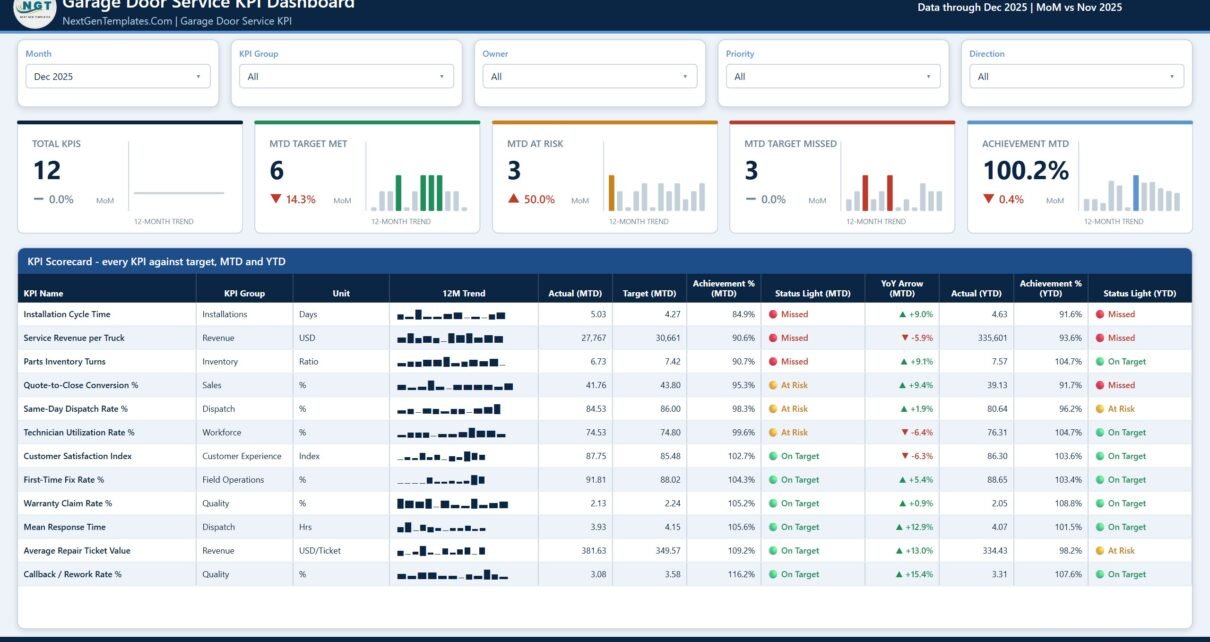
The Garage Door Service KPI Dashboard in Power BI tracks 12 service KPIs across 9 KPI groups on 4 report pages, driven by 5 synced slicers and a full 12 months of actuals, targets and prior-year figures. Every card, chart and traffic light is generated from three input sheets — nothing in the report hard-codes a KPI name, so the model survives your metric list changing.
Most garage door companies already know their numbers. The problem is that the numbers live in a job-management system that reports on jobs, in a spreadsheet the office manager maintains, and in the owner’s head — and none of the three answers the only question that matters at a monthly review: which metrics missed target this month, by how much, and are they getting worse. This template is the layer that answers it.
Key Features of the Garage Door Service KPI Dashboard in Power BI
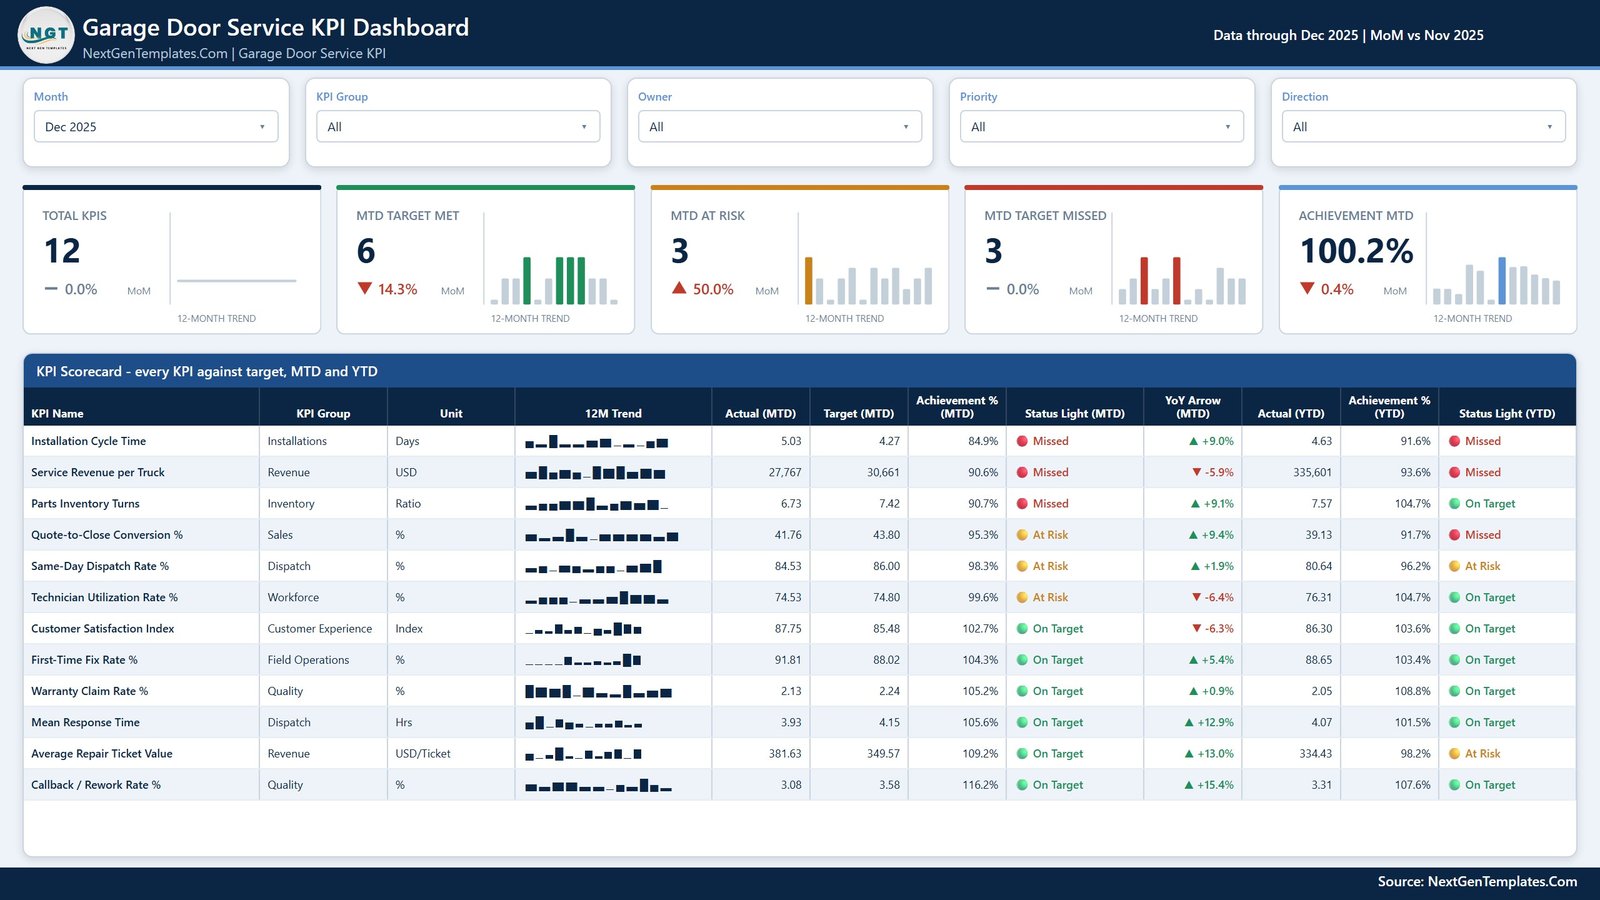
12 KPIs, grouped and scored. The scorecard covers Installation Cycle Time (Installations), Service Revenue per Truck and Average Repair Ticket Value (Revenue), Parts Inventory Turns (Inventory), Quote-to-Close Conversion % (Sales), Same-Day Dispatch Rate % and Mean Response Time (Dispatch), Technician Utilization Rate % (Workforce), Customer Satisfaction Index (Customer Experience), First-Time Fix Rate % (Field Operations), and Warranty Claim Rate % and Callback / Rework Rate % (Quality).
Direction-aware achievement. Every KPI carries a UTB (higher is better) or LTB (lower is better) flag. Higher-is-better metrics score Actual ÷ Target; lower-is-better metrics score Target ÷ Actual. That single rule is why a falling Mean Response Time reads as a win instead of a miss, and it is the detail most home-built KPI packs get wrong.
Fixed, defensible status bands. On Target is 100% of target or more, At Risk is 95% to 100%, Missed is below 95%. The same three bands apply to every KPI and to both the MTD and YTD columns, so nobody argues about what amber means halfway through a review.
Five synced slicers. Month, KPI Group, Owner, Priority and Direction filter the scorecard page together. Filter to Dispatch and you get a dispatch review; filter to High priority and you get the owner’s shortlist.
Prior year on every trend. Because Input_ Actual holds both the reporting year and the year before it, every YoY arrow, prior-year line and PY comparison on the report is real data rather than a placeholder.
Native visuals only. No custom visuals to import, no locked objects, and a single custom theme drives the colour of every visual — change the theme once and the whole report re-skins.
Dashboard Pages Explanation
Page 1: KPI Scorecard
The review page. Five slicers sit across the top, then five summary cards — Total KPIs, MTD Target Met, MTD At Risk, MTD Target Missed and Achievement MTD — each carrying a month-on-month percentage and a 12-month sparkline. Below sits the full scorecard table: KPI Name, KPI Group, Unit, 12M Trend, Actual (MTD), Target (MTD), Achievement % (MTD), Status Light (MTD), YoY Arrow (MTD), Actual (YTD), Achievement % (YTD) and Status Light (YTD). In the shipped sample for December 2025, 6 KPIs are on target, 3 at risk and 3 missed, at 100.2% overall achievement.
Page 2: KPI Trend
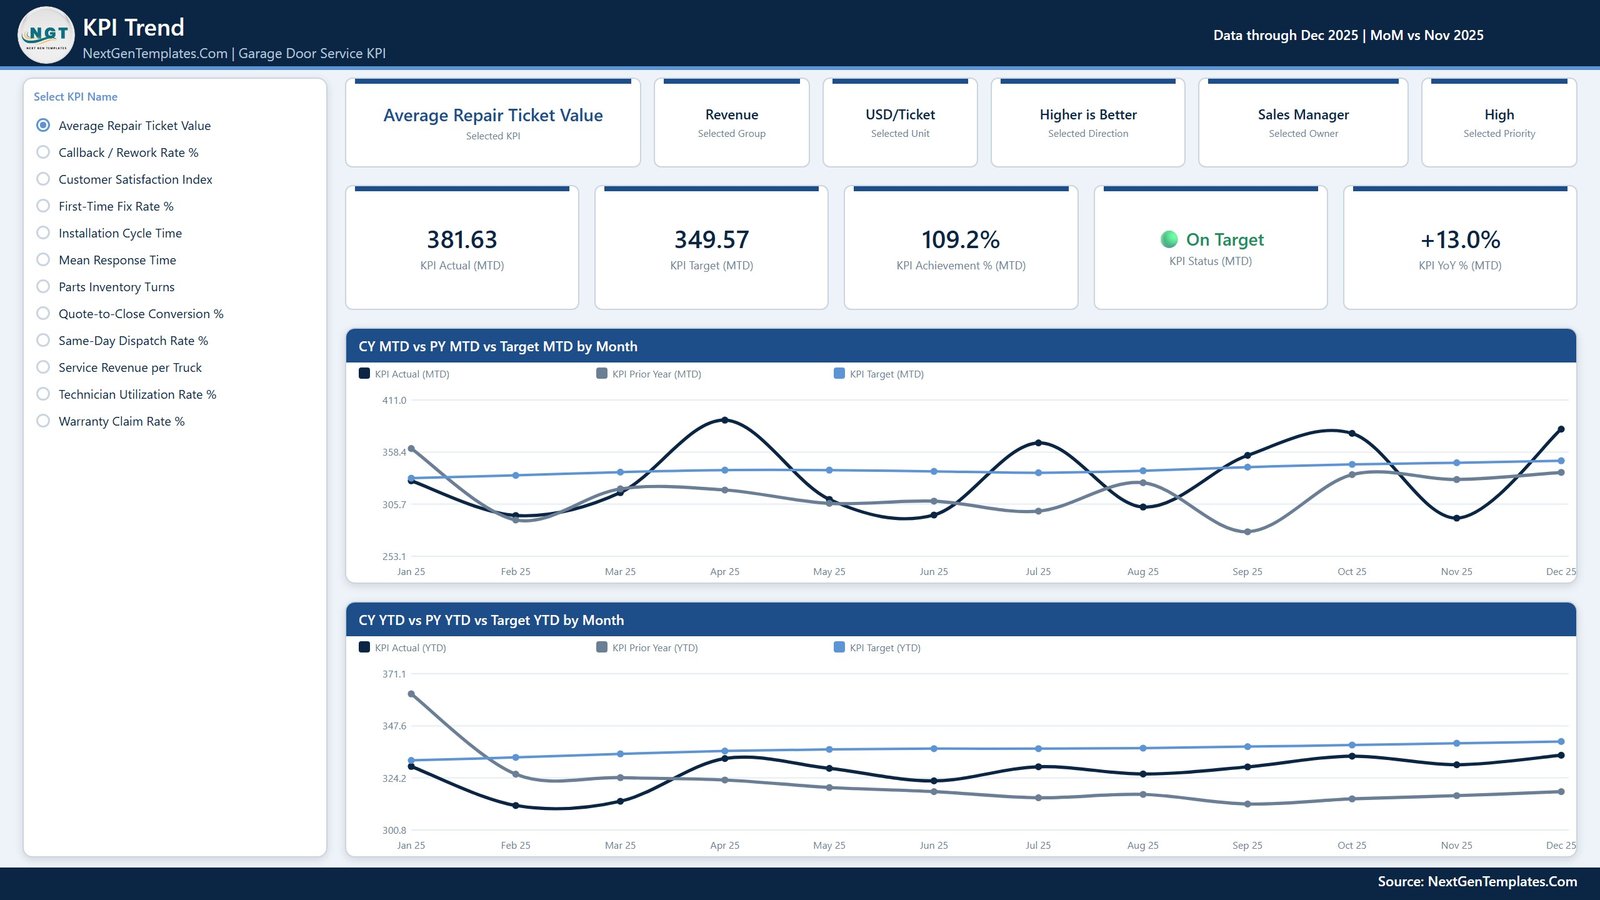
Choose one KPI from the radio list on the left and the entire page follows it. Six context cards restate the selected KPI, its group, unit, direction, owner and priority. Five value cards show KPI Actual (MTD), KPI Target (MTD), KPI Achievement % (MTD), KPI Status (MTD) and KPI YoY % (MTD). Two line charts close the page: CY MTD vs PY MTD vs Target MTD by Month, and CY YTD vs PY YTD vs Target YTD by Month.
Page 3: KPI Definition
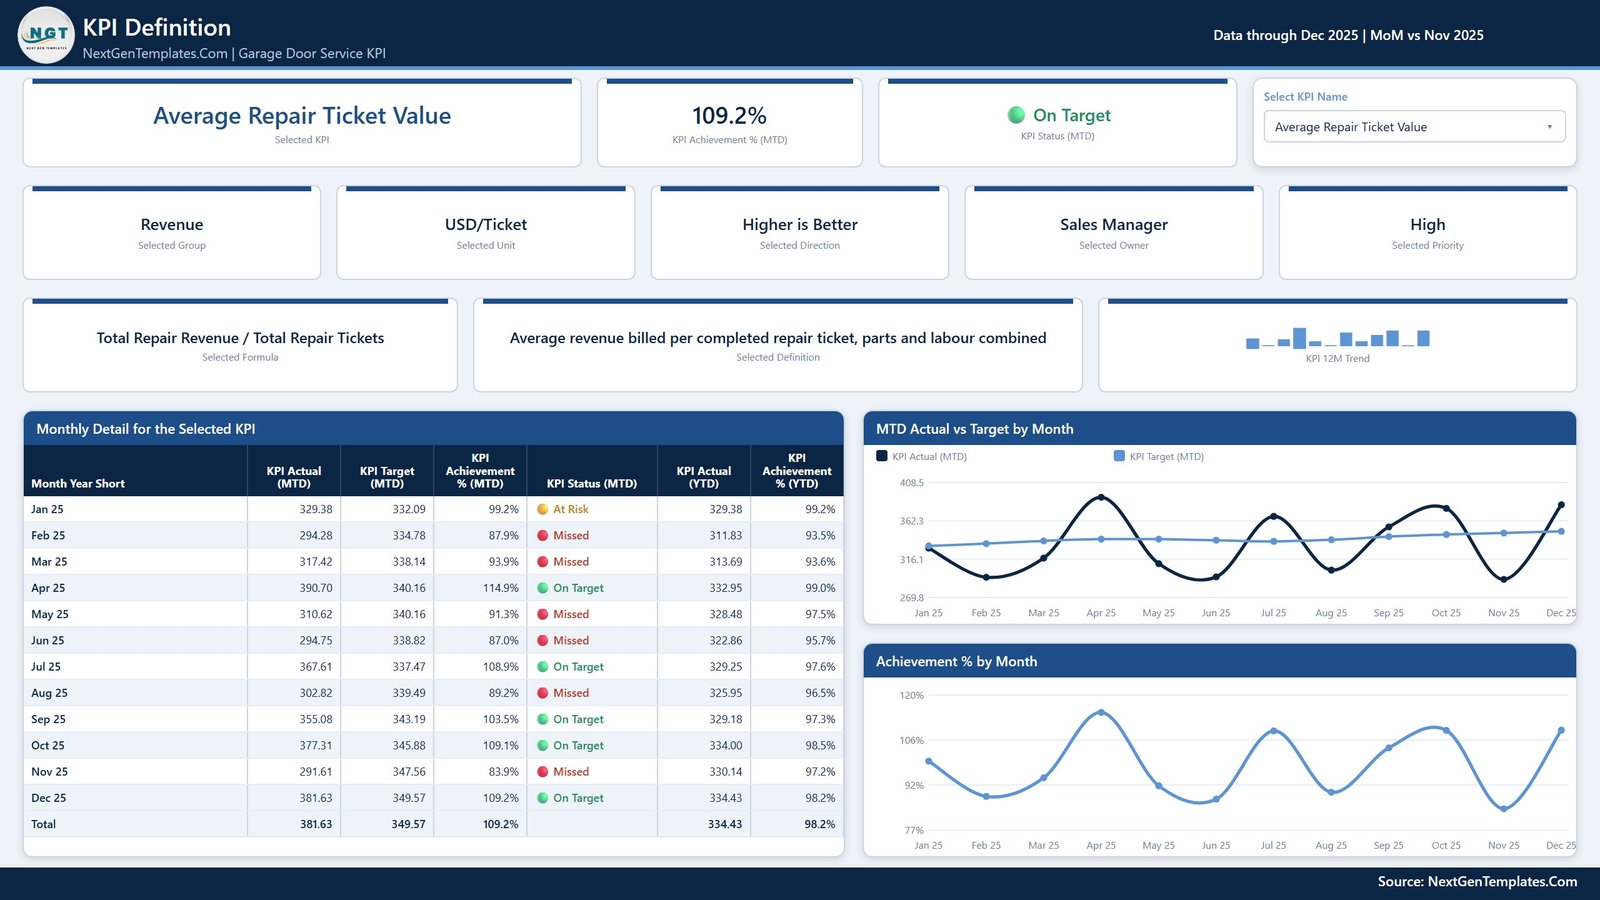
The page that settles arguments. A synced Select KPI Name dropdown drives cards showing the KPI’s achievement, status, group, unit, direction, owner, priority, its written formula and its plain-English definition, plus a 12-month sparkline. Underneath, Monthly Detail for the Selected KPI lists every month with Actual (MTD), Target (MTD), Achievement % (MTD), Status (MTD), Actual (YTD) and Achievement % (YTD), with a total row. Two charts sit alongside it: MTD Actual vs Target by Month and Achievement % by Month.
Page 4: Get More Templates
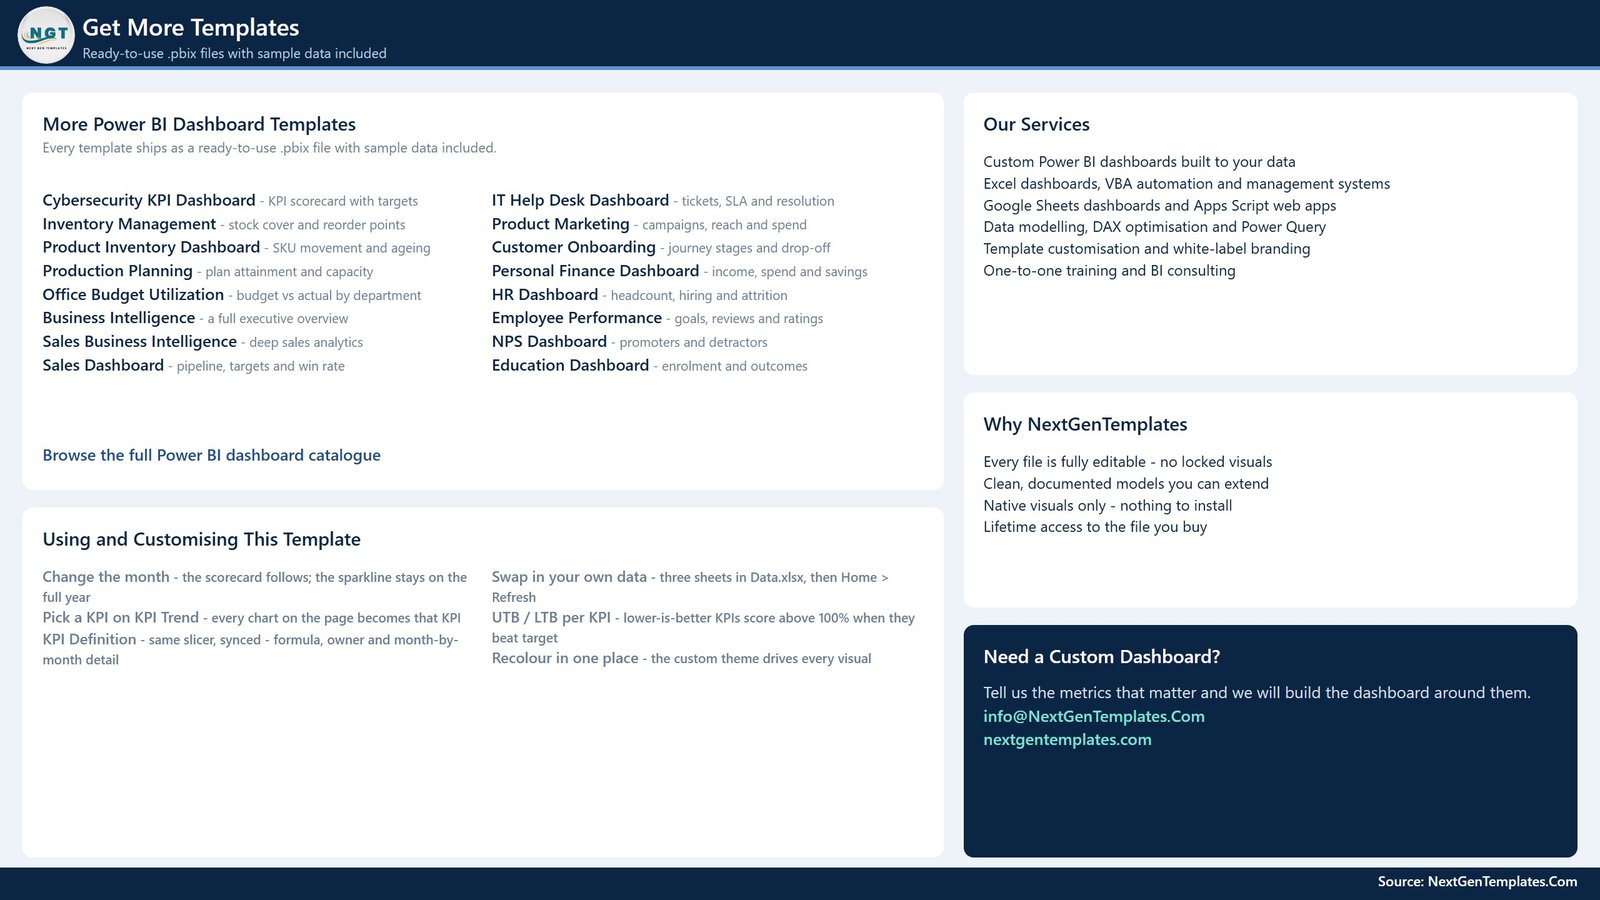
A reference page rather than an analysis page. It lists the wider Power BI catalogue, the customisation notes for this file — change the month, pick a KPI on KPI Trend, swap in your own data, how UTB and LTB scoring behaves, and where to recolour the report — plus how to commission a custom build.
Garage Door Service KPI Dashboard in Power BI vs. Tableau / Qlik vs. ServiceTitan / Jobber — Feature Comparison
| Feature | This template | Tableau / Qlik build | ServiceTitan / Jobber |
|---|---|---|---|
| Cost | $12.99 one-time ✅ | $70-$115 per Creator seat, monthly | $49-$400+ per month, plan dependent |
| Platform | Power BI Desktop, free ✅ | Tableau or Qlik licence required | Vendor cloud only |
| Setup time | Under 10 minutes ✅ | Days of modelling and chart building | Weeks of onboarding and data migration |
| KPIs pre-built | 12, already scored against target ✅ | None — you build every measure | Fixed vendor metric set |
| Lower-is-better handling | Built in via UTB / LTB ✅ | Hand-written per measure | Varies by report |
| Customisable fields | Add, rename or delete any KPI ✅ | Yes, with developer effort | Limited to the vendor schema |
| Data stays on your machine | Yes — local .pbix and Excel ✅ | Depends on deployment | No, hosted by the vendor |
| Runs your dispatch and invoicing | No — reporting only | No | Yes ✅ |
| Year-1 cost at 5 users | $12.99 total ✅ | $4,200-$6,900 | $2,900-$24,000+ |
For garage door companies that want a real monthly KPI review without a BI licence or a field-service SaaS contract, this template sits in the sweet spot.
Who Should Use This Template
Perfect for:
- Owners and operations managers at garage door install and repair firms running 2-30 trucks
- Service managers who already compile monthly numbers by hand and want a proper review pack
- Franchise and multi-branch operators needing one comparable scorecard per location
- Analysts who want a working, documented Power BI KPI model to adapt rather than a blank canvas
- Anyone presenting monthly performance to a board, a lender or a franchisor
Not a fit if:
- You need live dispatch, scheduling or invoicing — this reports on your numbers, it does not run the jobs
- You want an automatic connection to ServiceTitan, Jobber or a CRM; the input is an Excel file you refresh
- You are on macOS only, because Power BI Desktop is Windows-only
- You require SSO, row-level security and a governed enterprise tenant out of the box
Real-World Use Cases
Dave owns a 6-truck garage door company in Ohio. On the first Monday of each month he opens the scorecard, filters to the Dispatch group and sees Same-Day Dispatch Rate % sitting At Risk at 98.3% of target while Mean Response Time is comfortably On Target. That single screen sets the agenda for the morning meeting, and the 12-month sparkline tells him whether it is a blip or a slide.
Priya runs service operations across three branches. She uses the KPI Trend page to put Installation Cycle Time against last year and against plan, then drops the CY MTD vs PY MTD chart straight into her quarterly board pack. What used to be three hours of rebuilding charts is now one screenshot.
Marcus is the analyst at a garage door franchise group. He kept the model and replaced the KPI list entirely, adding two franchise-specific metrics in the KPI Definition sheet and removing three he did not use. Because nothing in the report names a KPI, the card counts, the selector list and every visual picked up the new metrics on the first refresh.
Advantages of This Power BI KPI Dashboard
- One-time cost. $12.99 against $2,900-$24,000 a year for a field-service platform at five users. Even if you keep your existing job-management system, this replaces the reporting add-on rather than the platform.
- No modelling work. The DAX, the date table, the direction-aware achievement measures and the traffic-light logic are already written and readable.
- Your data stays local. The .pbix reads an Excel file on your own machine. Nothing is uploaded unless you choose to publish to the Power BI service.
- It survives your metric list changing. Most KPI packs break the moment you rename a metric. This one joins on the KPI name across three sheets, so a rename is a find-and-replace and a refresh.
- It teaches the model. The KPI Definition page shows the formula and owner for every metric on screen, so the pack doubles as the documentation.
Opportunities for Improvement
Being straight about the limits: this is a reporting layer, not an operations system, and there are four things it genuinely does not do.
- The refresh is manual. There is no live connector to ServiceTitan, Jobber or a CRM. You export monthly figures, paste them into Data.xlsx and press Home > Refresh. For a monthly review that is fine; for a daily dispatch board it is not.
- There is no job-level drillthrough. You can see that First-Time Fix Rate % missed target; you cannot click through to the individual work orders that caused it. That detail stays in your job system.
- Multi-branch reporting needs a small edit. The Owner slicer is the only dimension beyond KPI Group, Priority and Direction. Running several branches side by side means adding a branch column to the three input sheets and a slicer to the page — straightforward, but it is work.
- The fourth page is a catalogue, not analysis. Get More Templates is a reference page. If you want a fifth analytical page — a group roll-up, or a top and bottom five — you will need to build it.
Best Practices
- Fill KPI Definition first. It is the join key for the whole model. Get the KPI names, groups, units and UTB / LTB flags right before you type a single monthly figure.
- Never sum a rate for YTD. For percentages, ratios, days and index values, the year-to-date figure is the average of the months so far. A compliance percentage that reaches 1,900% by December is the single most common mistake in a KPI pack, and it makes every YTD chart useless.
- Load the prior year properly. Input_ Actual needs both the reporting year and the year before it, or every YoY arrow and prior-year line reads as blank.
- Set targets you will defend. The status bands are fixed at 100 / 95, so the honesty of the report depends entirely on the honesty of the target column.
- Keep the workbook beside the report. If you move Data.xlsx, repoint it with Home > Transform data > Data source settings > Change Source.
- Start narrow. Eight KPIs you actually review beat twelve you skim. Delete the rows you will not use rather than leaving them blank.
Explore Relevant Templates
The same 12-KPI model ships on two other platforms, so you can pick whichever your team already uses: the Garage Door Service KPI Dashboard in Excel and the Garage Door Service KPI Dashboard in Google Sheets. For a lighter one-page monthly review there is the Garage Door Service KPI Scorecard in Google Sheets.
If you run an adjacent trade, the identical model is available for other field-service businesses. We have written up the Locksmith Business KPI Dashboard in Power BI and the Pest Control Business KPI Dashboard in Power BI in detail, and the Excel editions are covered in our guides to the Septic Tank Service KPI Dashboard in Excel and the Pest Control Business KPI Dashboard in Excel. If you would rather run a scorecard than a dashboard, start with the Pest Control Business KPI Scorecard in Excel.
Frequently Asked Questions
What KPIs does this garage door dashboard track?
It tracks 12 KPIs across 9 groups: Installation Cycle Time, Service Revenue per Truck, Parts Inventory Turns, Quote-to-Close Conversion %, Same-Day Dispatch Rate %, Technician Utilization Rate %, Customer Satisfaction Index, First-Time Fix Rate %, Warranty Claim Rate %, Mean Response Time, Average Repair Ticket Value and Callback / Rework Rate %.
How long does setup take?
Under 10 minutes if your figures are already in a spreadsheet. Unzip the download, open the .pbix in Power BI Desktop, paste your monthly targets and actuals into the three input sheets of Data.xlsx, then choose Home > Refresh. No DAX editing and no data modelling are required.
Can I add, rename or delete KPIs?
Yes, and this is the point of the model. Nothing in the report hard-codes a KPI name. Add a row to KPI Definition plus its monthly Target and Actual rows, or remove a KPI from all three sheets, then refresh. The card counts, the selector list, the scorecard and every chart follow automatically.
How are lower-is-better metrics scored?
Each KPI carries a UTB or LTB flag. Higher-is-better metrics score Actual ÷ Target; lower-is-better metrics such as Mean Response Time and Callback / Rework Rate % score Target ÷ Actual, so beating the target scores above 100%. Status bands are On Target at 100% or more, At Risk 95-100%, Missed below 95%.
How does this compare to ServiceTitan or Jobber?
Those platforms run dispatch, scheduling and invoicing on a monthly subscription. The Garage Door Service KPI Dashboard in Power BI is a reporting layer you own outright for a one-time $12.99. Export your monthly numbers from whatever system you already use, paste them in, and get a board-ready review pack with no recurring bill.
Do I need a paid Power BI licence?
No. The report opens in Power BI Desktop, which Microsoft gives away free. A Power BI Pro licence is only needed if you want to publish the report to the Power BI service and share it online with colleagues.
What is in the download?
A ZIP holding the .pbix report file, Data.xlsx with a Read Me sheet and the three input sheets pre-filled with a full year of realistic sample data, and a Power BI Dashboard user manual PDF. Everything is fully editable, with no locked visuals and no custom visuals to install.
About the Author
Built by PK — Microsoft Certified Professional with 15+ years of Excel, Google Sheets and Power BI experience. Founder of NextGenTemplates, reaching 300K+ subscribers across YouTube channels. Every template is hand-built and tested before release.
Conclusion
A monthly KPI review only works when the same 12 numbers appear the same way every month, scored the same way, against targets nobody can quietly move. That is what the Garage Door Service KPI Dashboard in Power BI gives you for the price of a service call: a month picker, a traffic-light grid, prior-year comparison on every metric, and a definition page that shows the formula behind each figure on screen.
👉 Click here to Purchase the Garage Door Service KPI Dashboard in Power BI
Instant download · One-time payment · No subscription · Lifetime access
🎥 For step-by-step video tutorials, visit Youtube.com/@PK-AnExcelExpert.
Last updated: September 2026