The Pest Control Business KPI Dashboard in Power BI scores 13 pest control KPIs across 10 KPI groups on 4 report pages, and ships with 24 months of sample actuals (January 2024 to December 2025) plus a full 12-month 2025 target line. Every card, traffic light, sparkline and chart in the file is driven by three sheets in a single Data.xlsx — nothing is hard-coded — so adding a fourteenth KPI is a spreadsheet row, not a DAX edit.
Most pest control operators are not short of numbers. Stops, callbacks, renewals and revenue are all recorded somewhere — in PestPac, in a route sheet, in the accountant’s export. What is usually missing is one page a month that puts each of those numbers next to the target you set for it, tells you whether you beat it, and remembers what the same month looked like last year. That is the job this file does, and the only job it does.

Key Features of the Pest Control Business KPI Dashboard in Power BI
- 13 KPIs across 10 groups. Service Revenue and Recurring Contract Revenue Share % (Financial); Customer Retention Rate % and Average Response Time to Service Request (Customer); Callback Re-Treatment Rate % and First-Time Completion Rate % (Service Quality); Missed Service Visits (Operations); Technician Stops Per Day (Productivity); Termite Contract Renewals (Contracts); Chemical Cost Per Service Stop (Cost Control); License and Label Compliance Score (Compliance); Technician Turnover Rate % (Workforce); New Commercial Accounts Won (Sales).
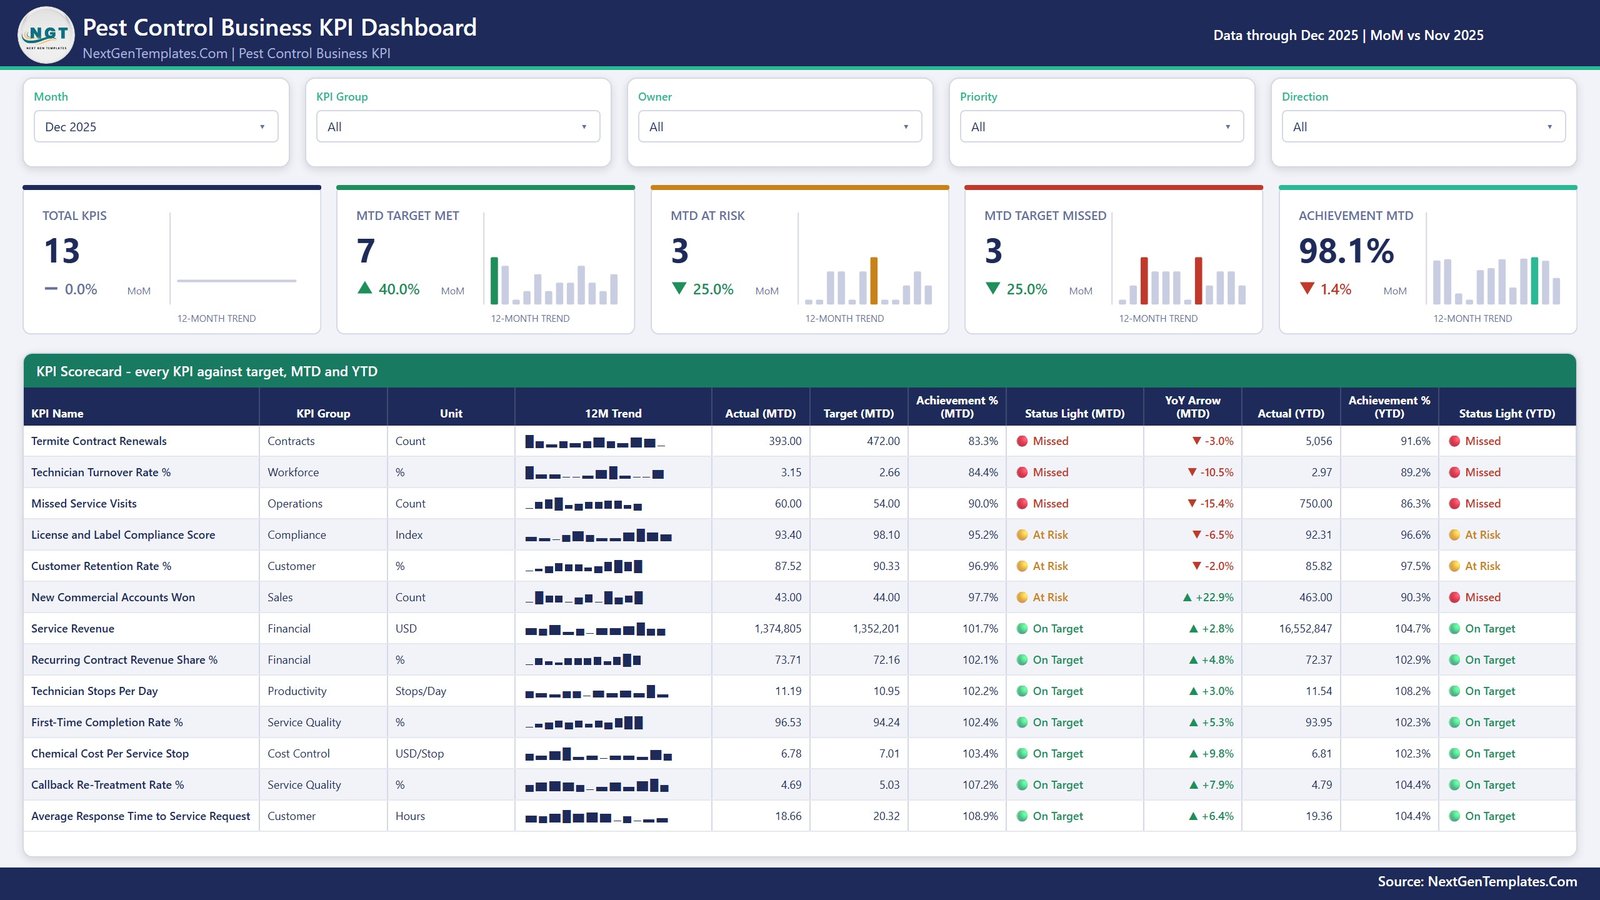
- Direction-aware achievement. Each KPI is tagged UTB or LTB. Higher-is-better KPIs score Actual ÷ Target; lower-is-better ones score Target ÷ Actual. Callback Re-Treatment Rate % at 4.69 against a 5.03 target therefore reads 107.2% and lights green, rather than looking like a miss.
- MTD and YTD side by side. Every scorecard row carries Actual MTD, Target MTD, Achievement % MTD, an MTD status light, a YoY arrow, Actual YTD, Achievement % YTD and a YTD status light. A KPI can be green for the month and red for the year, and the file shows both — New Commercial Accounts Won is exactly that in the sample data.
- Five slicers, plus a synced KPI picker. Month, KPI Group, Owner, Priority and Direction filter the scorecard; the KPI Name selection is synced between the trend and definition pages through Power BI’s sync-slicer groups, so choosing a KPI once follows you across.
- Native visuals only. 31 cards, 7 slicers, 4 line charts, 2 tables and 2 bar charts, all stock Power BI. Nothing to install from AppSource, nothing locked, no external dependency to break.
Dashboard Pages Explanation
Page 1: KPI Scorecard
The landing page and the one you will actually live in. Five header cards report Total KPIs (13), MTD Target Met (7), MTD At Risk (3), MTD Target Missed (3) and Achievement MTD (98.1%), each with a month-on-month delta and its own 12-month mini trend. Beneath them the scorecard lists all 13 KPIs with group, unit, a 12-month sparkline, MTD actual and target, achievement, status light, YoY arrow and the matching YTD block. The five slicers along the top filter the whole page at once.
Page 2: KPI Trend
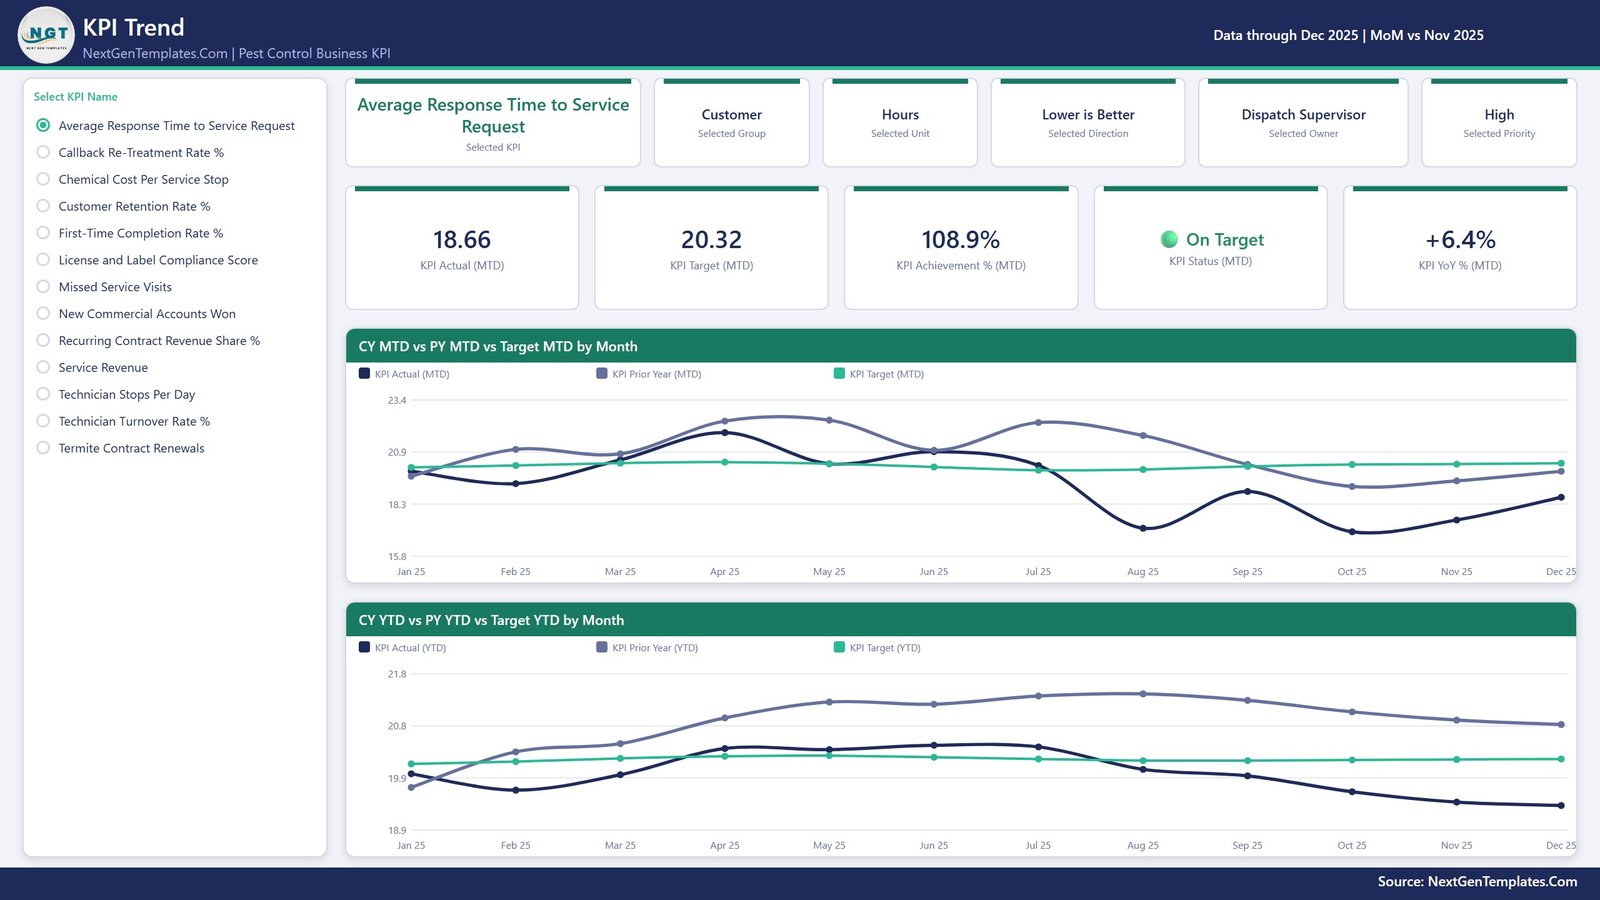
Single-KPI analysis. A radio list on the left selects one of the 13 KPIs; six context cards confirm the Selected KPI, Group, Unit, Direction, Owner and Priority, and five value cards show KPI Actual MTD, KPI Target MTD, KPI Achievement % MTD, KPI Status MTD and KPI YoY % MTD. Two full-width charts follow — CY MTD vs PY MTD vs Target MTD by Month, and CY YTD vs PY YTD vs Target YTD by Month — putting this year, last year and the target on one axis.
Page 3: KPI Definition
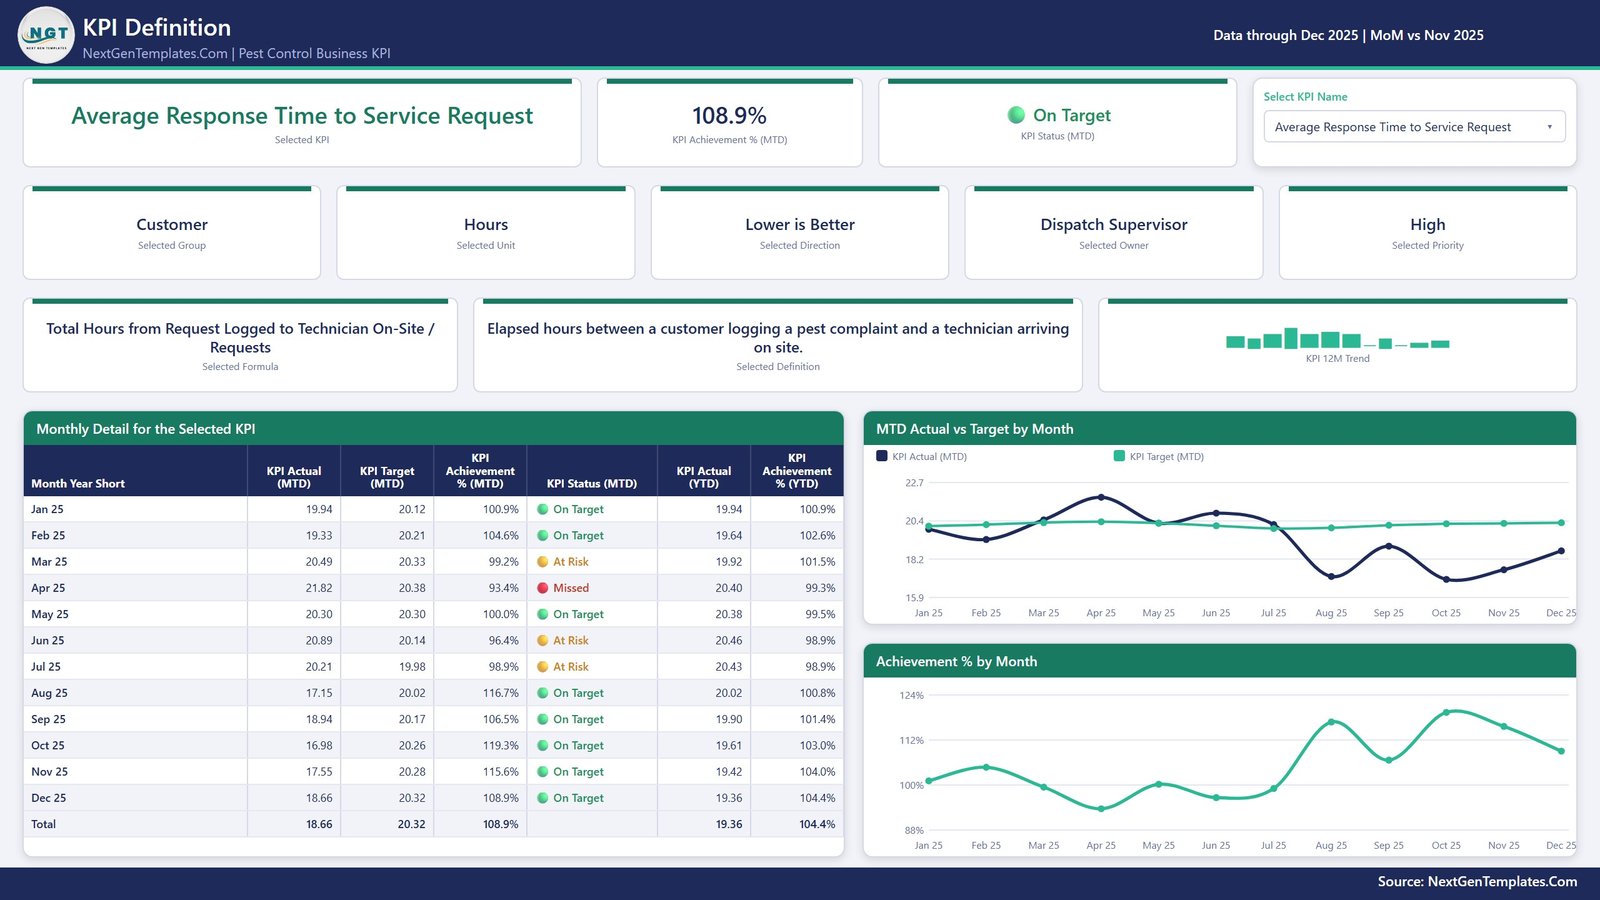
The page that ends the “how is this calculated?” argument. It repeats the selected KPI, its achievement and its status, then shows Group, Unit, Direction, Owner and Priority, then prints that KPI’s Formula and Definition in full alongside a 12-month trend. Below, a Monthly Detail table lists every month of the reporting year with actual, target, achievement, status and the YTD pair, next to MTD Actual vs Target by Month and Achievement % by Month charts.
Page 4: Get More Templates
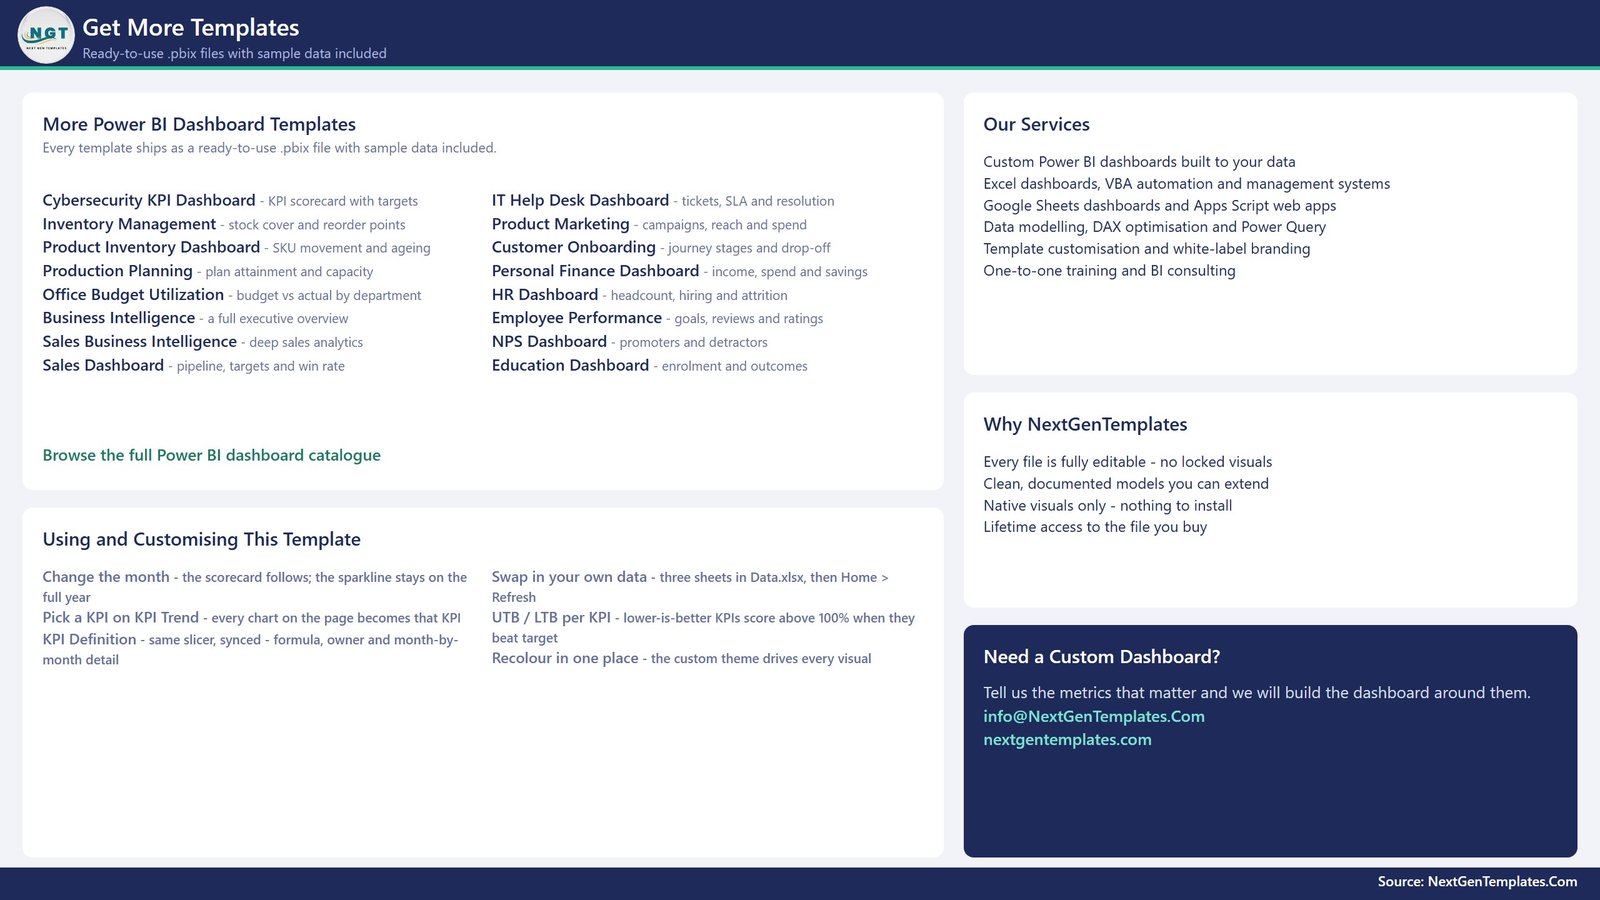
A catalogue page inside the report listing other ready-to-use .pbix templates, a short Using and Customising This Template guide, and contact details for a custom build. It carries no pest control data and we would rather say so than pad the page count.
There are also two hidden 280×360 pages, KPI Detail and Trend Detail. They are native Power BI report-page tooltips, wired to visuals on the first three pages, so hovering a scorecard row or a trend point surfaces that KPI’s detail without a click. There is no drillthrough menu in this build — the KPI Definition page is reached by the synced KPI picker, not by right-clicking a row.
Pest Control Business KPI Dashboard in Power BI vs. Tableau / Qlik vs. PestPac / ServiceTitan / Briostack — Feature Comparison
| Feature | Pest Control Business KPI Dashboard in Power BI | Tableau / Qlik build | PestPac / ServiceTitan / Briostack |
|---|---|---|---|
| Cost | ✅ $12.99 one-time | $70-$115 / user / month | $100-$300+ / user / month |
| Platform | ✅ Power BI Desktop (free from Microsoft) | Paid desktop + server licence | Vendor cloud only |
| Setup time | ✅ Under 10 minutes — swap Data.xlsx and Refresh | Days of modelling | Weeks of onboarding and data migration |
| Add or rename a KPI | ✅ Edit a row in Data.xlsx, press Refresh | Rebuild the sheet and calculations | Limited to the vendor’s metric list |
| Real-time team collaboration | Publish to the Power BI Service (separate licence) | ✅ Server-based sharing | ✅ Built in |
| Mobile access | Power BI mobile app once published | ✅ Native apps | ✅ Field technician apps |
| Routing, dispatch and invoicing | ❌ Not included — this is a reporting layer | ❌ Not included | ✅ Core product |
| Own your file forever | ✅ Yes — unlocked .pbix, no expiry | Access ends with the licence | Access ends with the subscription |
| Year-1 cost at 5 users | ✅ $12.99 total | $4,200-$6,900 | $6,000-$18,000 |
For a pest control operator who already runs jobs in field software and just wants an owner-level scorecard on top of it, the Pest Control Business KPI Dashboard in Power BI sits in the sweet spot — it reports on the numbers, it does not try to replace the system that produces them.
Who Should Use This Template
Perfect for:
- Owners and general managers of residential and commercial pest control firms with roughly 3-60 technicians
- Operations and route supervisors accountable for stops per day, missed visits and first-time completion
- Finance and revenue managers tracking recurring plan revenue, termite renewals and chemical cost per stop
- Multi-branch and franchise operators who want the same 13 KPIs reported identically everywhere
- Analysts who would rather adapt a working Power BI KPI model than start from an empty canvas
Not a fit if:
- You need scheduling, routing, dispatch, work orders or invoicing — this is a reporting file, not field-service software
- You expect a live connector to PestPac, ServiceTitan, Briostack or FieldRoutes. There is none; you export to Data.xlsx and refresh
- You want a regulatory tool. It does not check EPA or state pesticide registrations, does not track applicator licence expiry dates, does not store application records, label rates or re-entry intervals, and is not a safety or OSHA record-keeping system
- You need row-level security or scheduled refresh out of the box — those are Power BI Service settings you would configure yourself
- You are hoping for industry benchmarks. Every target in the file is a number you type
Real-World Use Cases
Marcus owns a 22-technician pest control company in Georgia. First Monday of the month he opens the .pbix, picks the closed month, and reads the header cards: seven KPIs met, three at risk, three missed, overall achievement 98.1%. The three red rows set the agenda for the management meeting. Last month they were Termite Contract Renewals at 83.3% of target, technician turnover, and missed service visits.
Priya supervises routes at a commercial-only branch. She filters the scorecard to KPI Group = Operations and Owner = Route Supervisor and looks only at what she owns. Technician Stops Per Day at 11.19 against a 10.95 target is green. Missed Service Visits at 60 against 54 is not, and the sparkline shows it has been drifting for three months rather than spiking once.
Dev runs finance across three branches. He uses the KPI Trend page to put Recurring Contract Revenue Share % against last year and target, then drops the CY vs PY vs Target chart straight into the board pack — without paying a per-seat BI licence for a report he opens twice a month.
Advantages of the Pest Control Business KPI Dashboard in Power BI
- A month of setup work you do not have to do. The measure layer, the direction-aware scoring, the RAG banding and the PY/YoY logic are already built and already tested against 24 months of data.
- It survives your KPI list changing. Most bought dashboards break the first time somebody renames a metric. This one joins on the KPI name across three sheets, so a rename in all three and a Refresh is the whole migration.
- One-time cost instead of a per-seat subscription. At five users the year-one arithmetic is $12.99 against several thousand dollars for a BI licence, or five figures for field-service software you may not need.
- Honest about YTD. The Read Me sheet is explicit that YTD sums for money, volume and counts but averages for percentages, indices and hours — the mistake that quietly makes most KPI packs useless by December.
- It teaches the pattern. The .pbix is unlocked, so it doubles as a worked example of a direction-aware KPI model you can lift into another trade.
Opportunities for Improvement
Three honest limitations. First, there is no drillthrough in this build — zero drillthrough definitions exist in the report. Navigation between the scorecard and the definition page runs through synced slicers instead, which works but will surprise anyone who right-clicks a row expecting a menu.
Second, the data path is manual. There is no connector to pest control field software; you export to Data.xlsx and refresh. If your first Refresh fails, it is almost always the source path — use Home > Transform data > Data source settings > Change Source to point at your own copy of the file, as described in Microsoft’s Power BI data source documentation.
Third, the compliance KPI is an input, not a check. License and Label Compliance Score is a weighted internal audit index that somebody in your business types in. It is a useful discipline and a terrible substitute for an actual licensing and record-keeping process, and the file makes no attempt to be the latter.
Best Practices
- Fill the prior year before the current one. Every PY and YoY figure on the dashboard reads from it, and a half-filled 2024 makes the trend charts misleading rather than empty.
- Set targets once a year and leave them alone. A target you move mid-year turns the achievement column into a record of your optimism rather than your performance.
- Get the UTB/LTB flag right on day one. It is the single field that decides whether beating a callback target reads as 107% or 93%.
- Assign a real owner name per KPI. The Owner slicer is what turns one shared dashboard into thirteen personal ones.
- Work the red rows top-down. The scorecard sorts worst-first by achievement, so the meeting agenda writes itself.
- Keep the three files together in one folder, and re-point the source after you move them.
Explore Relevant Templates
- Pest Control Dashboard in Power BI — the analytical sibling. That file slices jobs, services and revenue for exploration; this one scores 13 KPIs against target. Complementary, not duplicate.
- Insulation Contractor KPI Dashboard in Power BI and Paving Contractor KPI Dashboard in Power BI — the same scorecard architecture written up for two other trades, useful if you want to see how the KPI list changes and the mechanics do not.
- Fencing Contractor KPI Dashboard in Power BI and Concrete Contractor KPI Dashboard in Power BI — two more field-service builds on the identical month-picker pattern.
- Plumbing Business KPI Dashboard in Excel — the closest write-up if you would rather stay in a workbook than open Power BI Desktop.
- Pest Control Business KPI Scorecard in Google Sheets — a lighter, link-shareable scorecard for a branch manager who does not run Power BI.
- Also available as: Pest Control Business KPI Dashboard in Excel — the direct twin of this file, same 13 KPIs, built in a workbook.
Frequently Asked Questions
What KPIs does the Pest Control Business KPI Dashboard in Power BI track?
The Pest Control Business KPI Dashboard in Power BI tracks 13 KPIs across 10 groups: Service Revenue, Recurring Contract Revenue Share %, Customer Retention Rate %, Callback Re-Treatment Rate %, Missed Service Visits, Technician Stops Per Day, First-Time Completion Rate %, Termite Contract Renewals, Average Response Time to Service Request, Chemical Cost Per Service Stop, License and Label Compliance Score, Technician Turnover Rate % and New Commercial Accounts Won.
How does it score lower-is-better metrics like callbacks?
Each KPI carries a UTB or LTB flag in Data.xlsx. The Pest Control Business KPI Dashboard in Power BI scores higher-is-better KPIs as Actual ÷ Target and lower-is-better KPIs as Target ÷ Actual, so beating a callback, cost or response-time target produces an achievement above 100% and a green traffic light rather than a false miss.
Does it prove pesticide or licensing compliance?
No. The License and Label Compliance Score in the Pest Control Business KPI Dashboard in Power BI is an internal weighted audit index you enter yourself. The file does not verify EPA or state registrations, track applicator licence expiry, or store pesticide application records, label rates or re-entry intervals. It reports the score you type and nothing else.
How long does setup take?
Opening the file and seeing it work takes under 10 minutes: open the .pbix, use Transform data > Data source settings > Change Source to point at your own Data.xlsx, and press Refresh. Loading your own 13 KPIs, 12 months of targets and 24 months of actuals is usually one focused sitting.
Can I add my own KPIs?
Yes. Nothing in the Pest Control Business KPI Dashboard in Power BI hard-codes a KPI. Add a row to KPI Definition plus its monthly Target and Actual rows, press Home > Refresh, and the KPI counts, the scorecard, the KPI picker and every chart update on their own — no DAX or visual editing.
How does this compare to PestPac or ServiceTitan?
Different tools for different jobs. PestPac and ServiceTitan run scheduling, routing, work orders and invoicing on a per-user monthly subscription. The Pest Control Business KPI Dashboard in Power BI is a $12.99 one-time reporting layer that scores 13 KPIs against target on top of whatever system produces your numbers.
What software do I need, and what is in the download?
You need Power BI Desktop, which Microsoft provides free for Windows. The ZIP contains three files: the .pbix report, the Data.xlsx model with its Read Me, Input_ Target, Input_ Actual and KPI Definition sheets, and a Power BI user manual PDF.
About the Author
Built by PK — Microsoft Certified Professional with 15+ years of Excel, Google Sheets and Power BI experience. Founder of NextGenTemplates, reaching 300K+ subscribers across YouTube channels. Every template is hand-built and tested before release.
Conclusion
If your pest control business already produces the numbers and simply lacks the one page that scores them, the Pest Control Business KPI Dashboard in Power BI is a short route to it: 13 KPIs, direction-aware traffic lights, MTD and YTD together, prior-year context, and a model that survives you changing your mind about which KPIs matter.
👉 Click here to Purchase the Pest Control Business KPI Dashboard in Power BI
Instant download · One-time payment · No subscription
🎥 More step-by-step tutorials: Youtube.com/@PK-AnExcelExpert
Last updated: September 2026