New: NextGenTemplates Academy - video courses on Excel formulas with AI and Pivot Tables & dashboards. Early-bird: 20% off with code EARLYBIRD20 - first 20 orders only. See the courses →
  • Learn Excel (Free Course)
    • 1. Shortcut Keys
    • 2. Fill & Flash Fill
    • 3. Find & Replace
    • 4. Sort & Filter
    • 5. Formulas & Functions
    • 6. Data Validation
    • 7. Conditional Formatting
    • 8. Basic Charts
    • 9. Advanced Charts
    • 10. Pivot Tables
    • 11. Excel Dashboards
    • 12. VBA Course
    • 13. Excel Formulas with AI
  • Templates
  • Tutorials
    • Charts and Visualization
    • VBA
    • Excel Tips and Tricks
    • Excel Dashboards
    • Power Pivot & DAX
  • Power BI
  • Template Store
    • Ready to Use Templates
  • Courses
  • Academy
    • Excel + AI Mastery: 100 Formulas
    • Excel Pivot Tables & Dashboards
  • About Us
  • Contact Us

PK: An Excel Expert

Transforming Data into Decisions

Tag: Business Intelligence Power BI

Dashboard Power BI

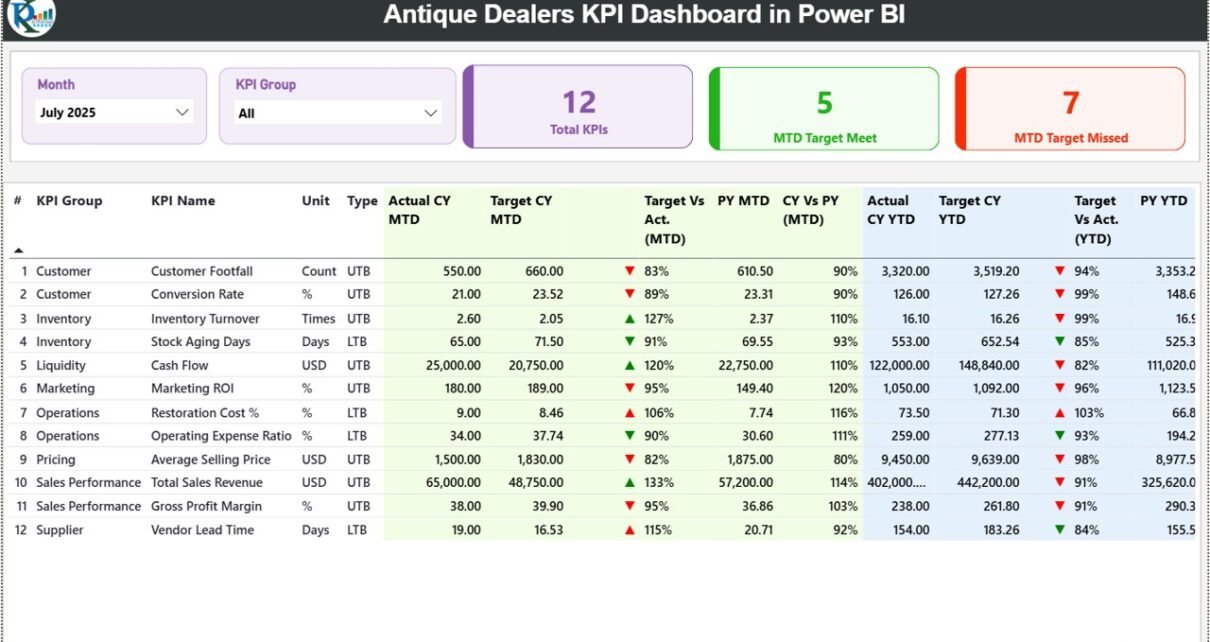
Antique Dealers KPI Dashboard in Power BI

February 21, 2026February 21, 2026 PKComments Off on Antique Dealers KPI Dashboard in Power BI
The antique business demands precision, expertise, and strong financial control. Antique dealers handle rare collectibles, estate items, auction pieces, and vintage treasures. Therefore, they must monitor performance closely. However, many
Read More
Dashboard Power BI

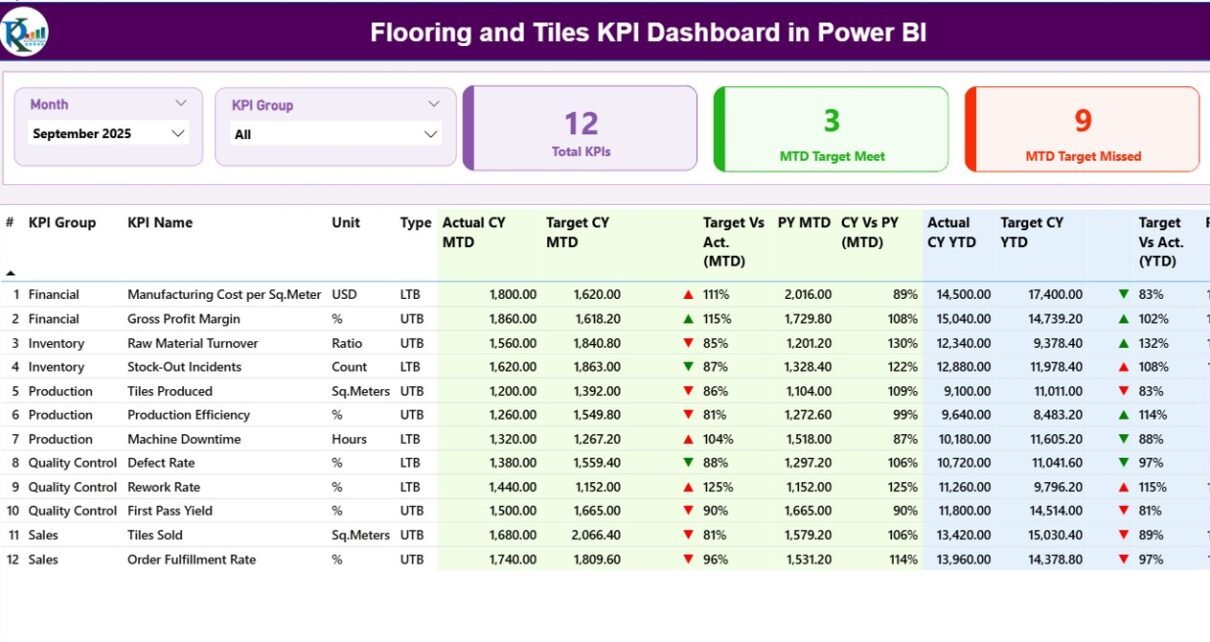
Flooring and Tiles KPI Dashboard in Power BI

February 9, 2026February 9, 2026 PKComments Off on Flooring and Tiles KPI Dashboard in Power BI
The Flooring and Tiles KPI Dashboard changes fast. Customer taste shifts quickly. Moreover, builders demand faster delivery. At the same time, raw material costs move up and down. Therefore, flooring
Read More
Dashboard Power BI

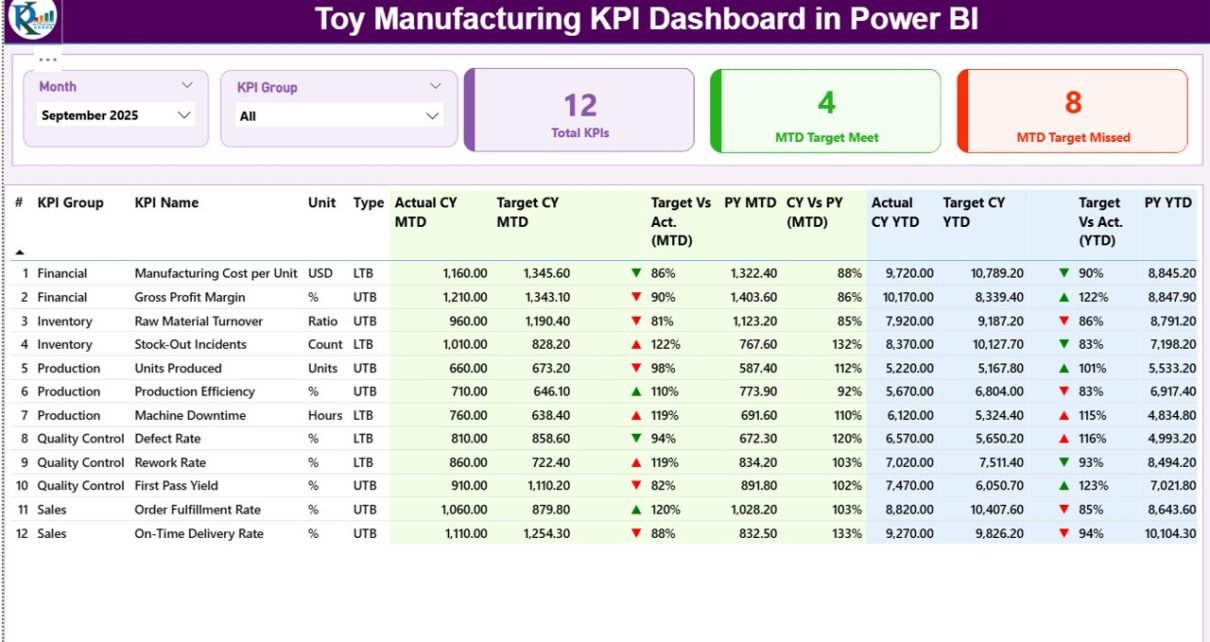
Toy Manufacturing KPI Dashboard in Power BI

February 7, 2026February 7, 2026 PKComments Off on Toy Manufacturing KPI Dashboard in Power BI
The toy industry moves fast. Trends change quickly. Seasonal demand rises sharply. Retail pressure increases daily. Therefore, toy manufacturers must track production, quality, sales, and delivery metrics in real time.
Read More
Dashboard Power BI

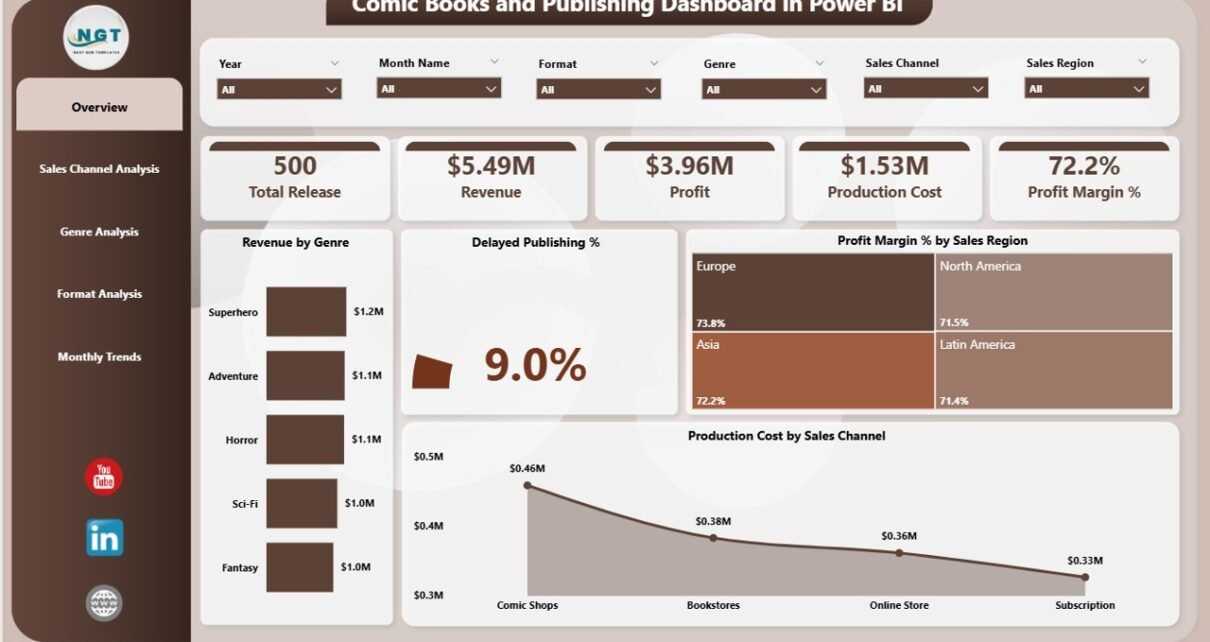
Comic Books and Publishing Dashboard in Power BI

February 5, 2026February 5, 2026 PKComments Off on Comic Books and Publishing Dashboard in Power BI
The comic books and publishing industry continues to grow rapidly. At the same time, competition keeps increasing, production costs keep rising, and reader preferences keep changing. Therefore, comic publishers, studios,
Read More
Dashboard Power BI

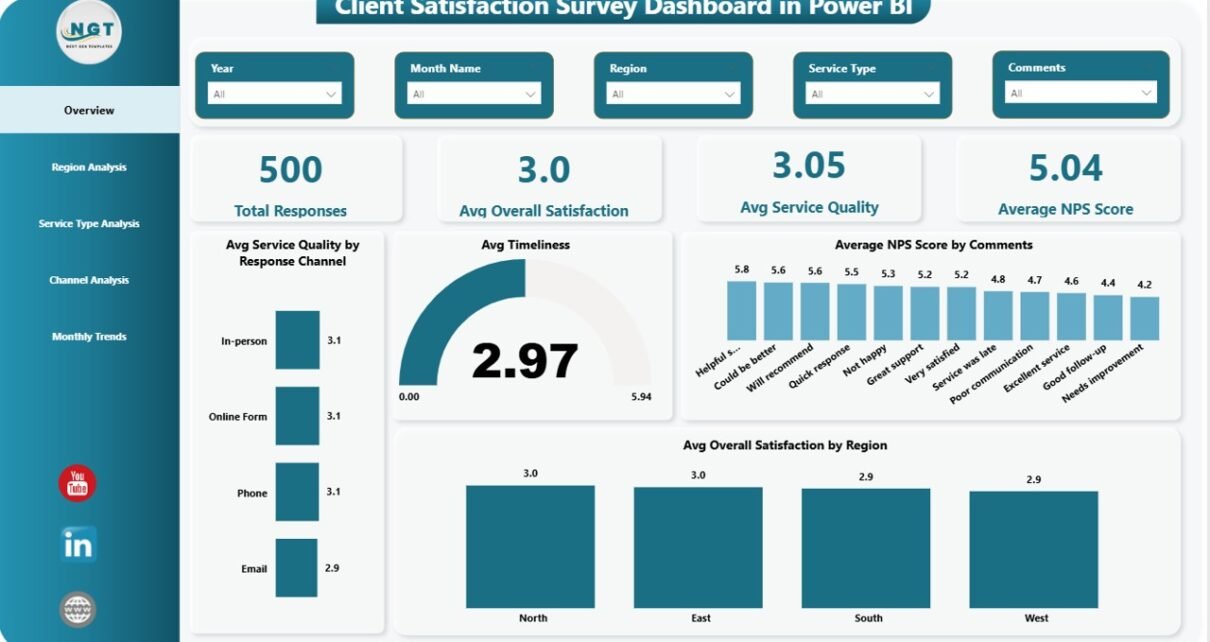
Client Satisfaction Survey Dashboard in Power BI

February 2, 2026October 10, 2026 PKComments Off on Client Satisfaction Survey Dashboard in Power BI
Client satisfaction plays a critical role in business success. Every organization wants happy clients, repeat business, and positive word-of-mouth. However, without proper tracking and analysis, client feedback often stays unused.
Read More
Dashboard Power BI

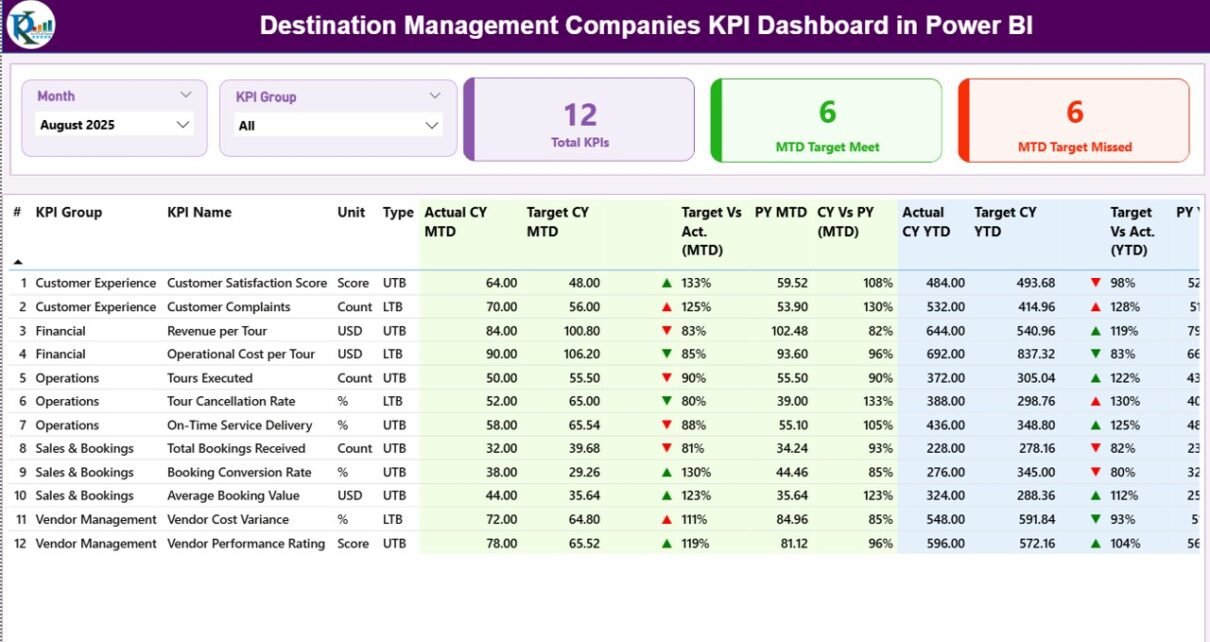
Destination Management Companies KPI Dashboard in Power BI

February 2, 2026February 2, 2026 PKComments Off on Destination Management Companies KPI Dashboard in Power BI
Destination Management Companies (DMCs) operate in a fast-moving, service-driven environment. They manage tours, events, transportation, hotels, vendors, and client expectations—all at the same time. Because of this complexity, DMCs need
Read More
Dashboard Power BI

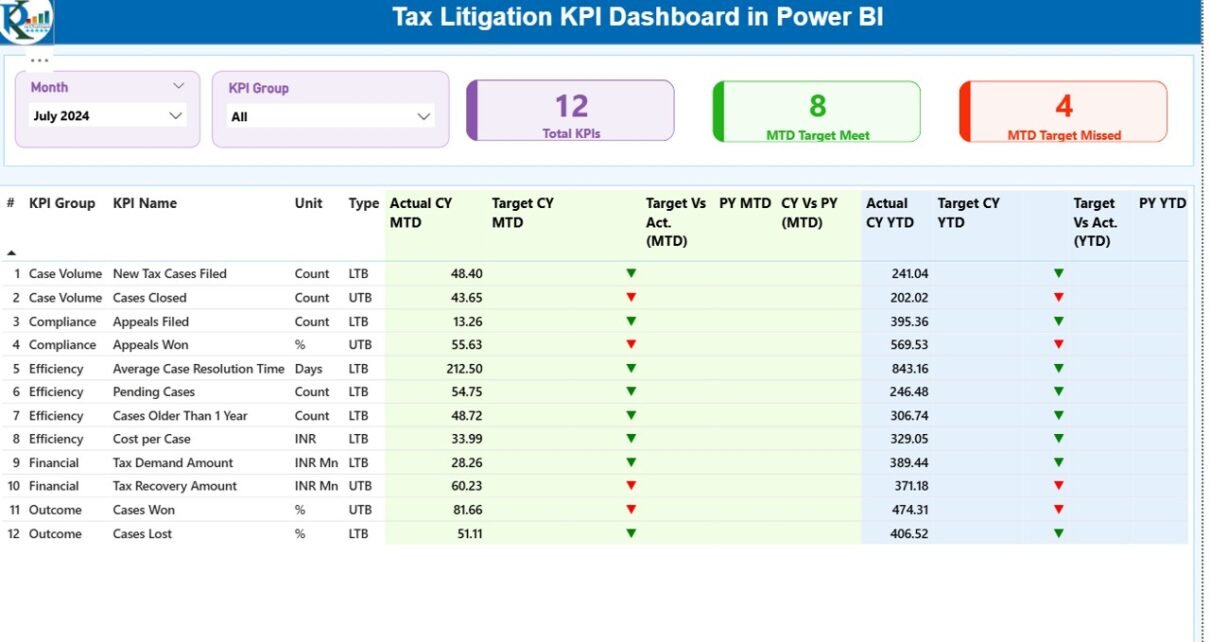
Tax Litigation KPI Dashboard in Power BI

February 2, 2026February 2, 2026 PKComments Off on Tax Litigation KPI Dashboard in Power BI
Managing tax litigation has become more complex than ever. Because regulations change frequently and tax authorities demand strict compliance, organizations must track every tax case, appeal, and resolution carefully. However,
Read More
Dashboard Power BI

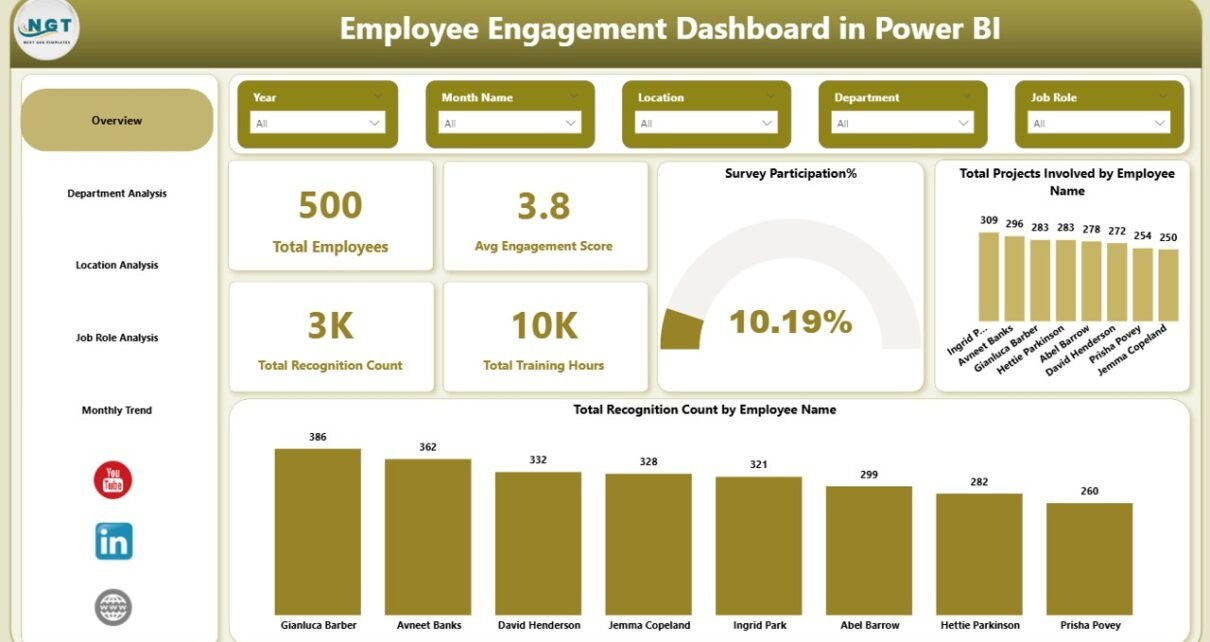
Employee Engagement Dashboard in Power BI

February 1, 2026February 1, 2026 PKComments Off on Employee Engagement Dashboard in Power BI
Employee engagement plays a critical role in organizational success. When employees feel connected, motivated, and valued, productivity increases, retention improves, and workplace culture becomes stronger. However, measuring engagement manually through
Read More
Dashboard Power BI

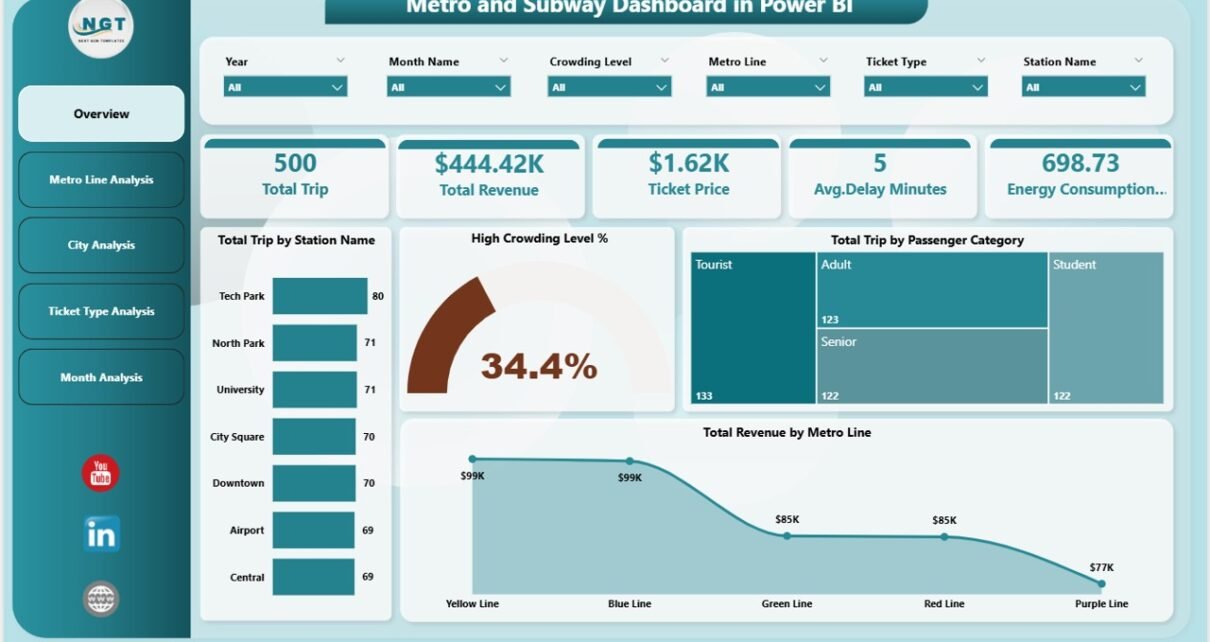
Metro and Subway Dashboard in Power BI

January 31, 2026January 31, 2026 PKComments Off on Metro and Subway Dashboard in Power BI
Urban transportation systems handle millions of passengers every single day. Because of this scale, metro and subway operators constantly face challenges related to crowding, delays, revenue tracking, and operational efficiency.
Read More
Dashboard Power BI

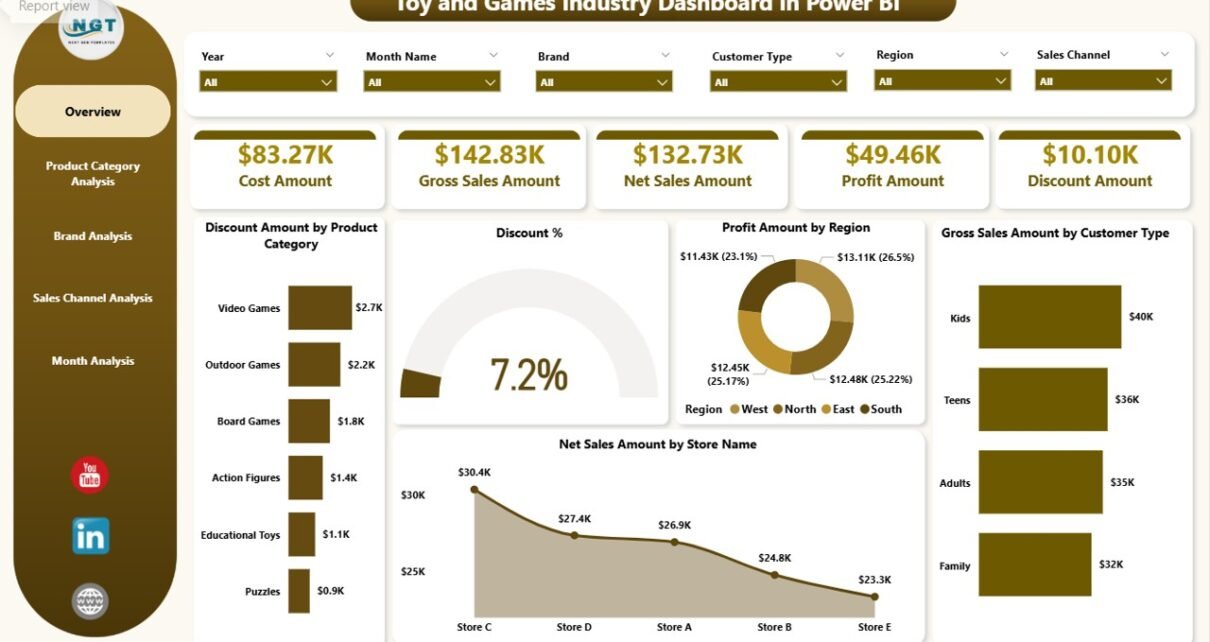
Toy and Games Industry Dashboard in Power BI

January 29, 2026January 29, 2026 PKComments Off on Toy and Games Industry Dashboard in Power BI
The toy and games industry thrives on creativity, trends, and seasonal demand. However, without clear data visibility, even the most innovative toy businesses struggle to grow. That is exactly where
Read More

Posts pagination

Previous 1 2 3 … 5 Next
  • Learn Excel (Free Course)
    • 1. Shortcut Keys
    • 2. Fill & Flash Fill
    • 3. Find & Replace
    • 4. Sort & Filter
    • 5. Formulas & Functions
    • 6. Data Validation
    • 7. Conditional Formatting
    • 8. Basic Charts
    • 9. Advanced Charts
    • 10. Pivot Tables
    • 11. Excel Dashboards
    • 12. VBA Course
    • 13. Excel Formulas with AI
  • Templates
  • Tutorials
    • Charts and Visualization
    • VBA
    • Excel Tips and Tricks
    • Excel Dashboards
    • Power Pivot & DAX
  • Power BI
  • Template Store
    • Ready to Use Templates
  • Courses
  • Academy
    • Excel + AI Mastery: 100 Formulas
    • Excel Pivot Tables & Dashboards
  • About Us
  • Contact Us
Copyright © 2023 PK-AnExcelExpert.com - Privacy Policy