New: NextGenTemplates Academy - video courses on Excel formulas with AI and Pivot Tables & dashboards. Early-bird: 20% off with code EARLYBIRD20 - first 20 orders only. See the courses →
  • Learn Excel (Free Course)
    • 1. Shortcut Keys
    • 2. Fill & Flash Fill
    • 3. Find & Replace
    • 4. Sort & Filter
    • 5. Formulas & Functions
    • 6. Data Validation
    • 7. Conditional Formatting
    • 8. Basic Charts
    • 9. Advanced Charts
    • 10. Pivot Tables
    • 11. Excel Dashboards
    • 12. VBA Course
    • 13. Excel Formulas with AI
  • Templates
  • Tutorials
    • Charts and Visualization
    • VBA
    • Excel Tips and Tricks
    • Excel Dashboards
    • Power Pivot & DAX
  • Power BI
  • Template Store
    • Ready to Use Templates
  • Courses
  • Academy
    • Excel + AI Mastery: 100 Formulas
    • Excel Pivot Tables & Dashboards
  • About Us
  • Contact Us

PK: An Excel Expert

Transforming Data into Decisions

Tag: Construction Analytics Power BI

Power BI Templates

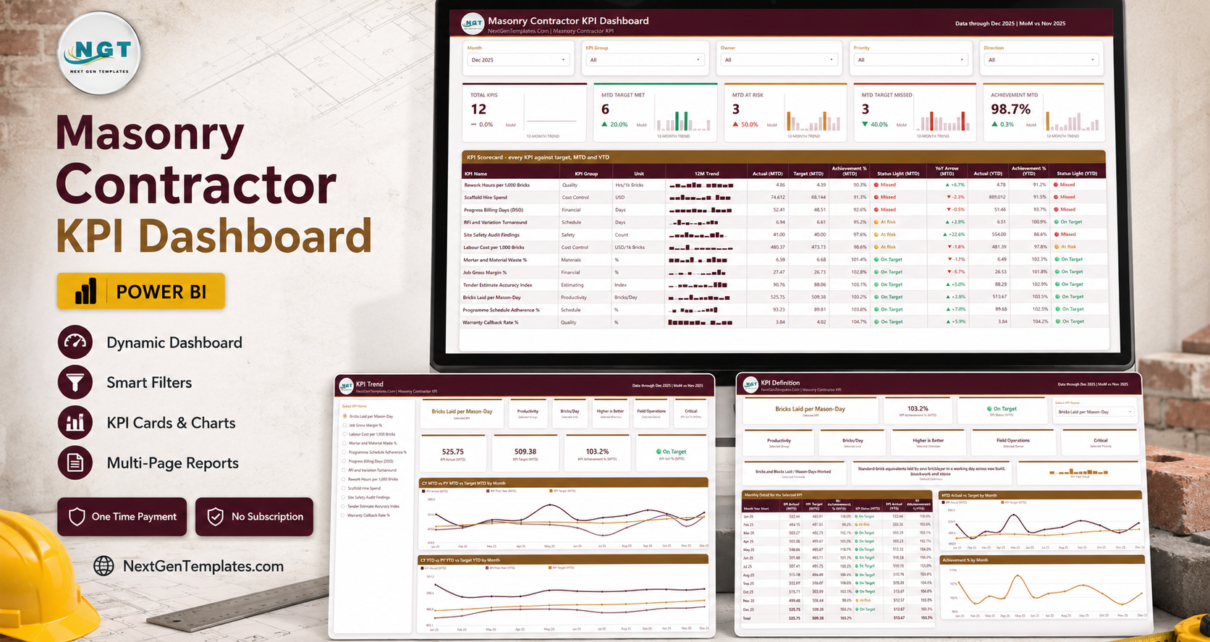
Masonry Contractor KPI Dashboard in Power BI

September 1, 2026September 1, 2026 PKComments Off on Masonry Contractor KPI Dashboard in Power BI
Most masonry subcontractors already have the numbers. Bricks laid, mason-days worked, scaffold invoices, cut-out and rebuild hours, the retention that has not landed yet - all of it exists somewhere
Read More
Power BI Templates

Flooring Installation KPI Dashboard in Power BI

August 31, 2026August 31, 2026 PKComments Off on Flooring Installation KPI Dashboard in Power BI
Most flooring contractors already know their revenue. Far fewer can tell you, on the first Monday of the month, whether Material Waste % beat target, whether Install Callback Rate %
Read More
Dashboard Power BI Templates

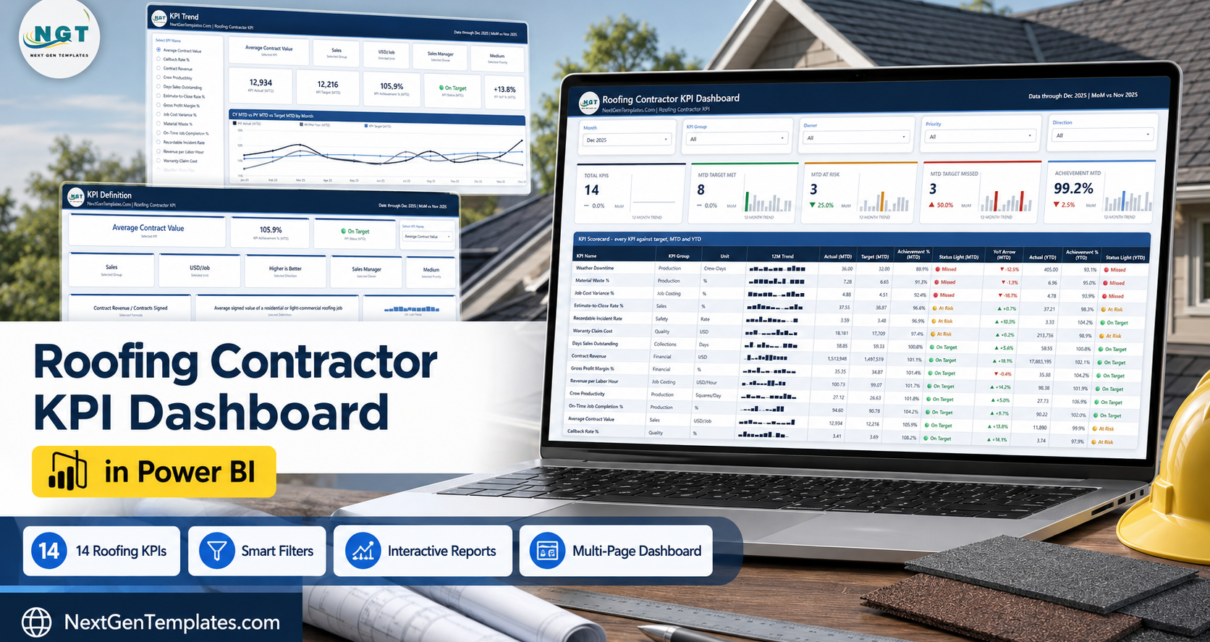
Roofing Contractor KPI Dashboard in Power BI

August 30, 2026August 30, 2026 PKComments Off on Roofing Contractor KPI Dashboard in Power BI
Roofing is one of the few trades where a single wet fortnight can wipe out a quarter, and where the difference between a good year and a bad one usually
Read More
Dashboard Power BI

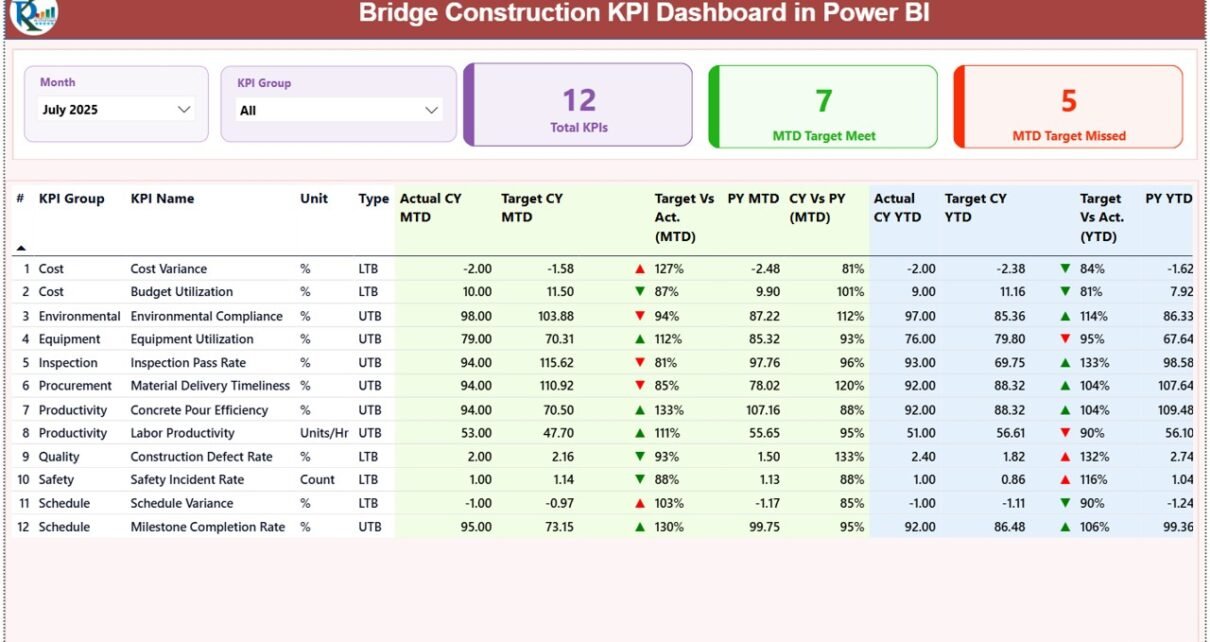
Bridge Construction KPI Dashboard in Power BI

March 6, 2026March 6, 2026 PKComments Off on Bridge Construction KPI Dashboard in Power BI
Bridge construction projects require precise planning, strict monitoring, and continuous performance tracking. However, many construction companies still rely on scattered spreadsheets and manual reports. As a result, project managers often
Read More
  • Learn Excel (Free Course)
    • 1. Shortcut Keys
    • 2. Fill & Flash Fill
    • 3. Find & Replace
    • 4. Sort & Filter
    • 5. Formulas & Functions
    • 6. Data Validation
    • 7. Conditional Formatting
    • 8. Basic Charts
    • 9. Advanced Charts
    • 10. Pivot Tables
    • 11. Excel Dashboards
    • 12. VBA Course
    • 13. Excel Formulas with AI
  • Templates
  • Tutorials
    • Charts and Visualization
    • VBA
    • Excel Tips and Tricks
    • Excel Dashboards
    • Power Pivot & DAX
  • Power BI
  • Template Store
    • Ready to Use Templates
  • Courses
  • Academy
    • Excel + AI Mastery: 100 Formulas
    • Excel Pivot Tables & Dashboards
  • About Us
  • Contact Us
Copyright © 2023 PK-AnExcelExpert.com - Privacy Policy