New: NextGenTemplates Academy - video courses on Excel formulas with AI and Pivot Tables & dashboards. Early-bird: 20% off with code EARLYBIRD20 - first 20 orders only.See the courses →
PKComments Off on AI in Customer Service Dashboard in Power BI
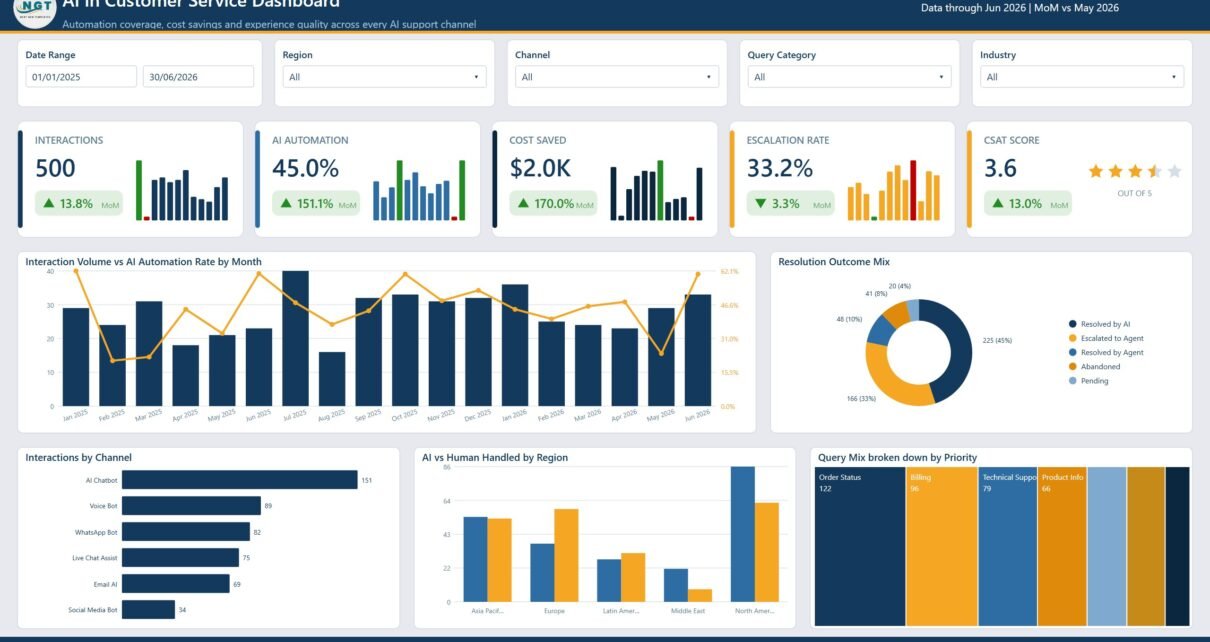
Once AI is live in a support operation, the reporting question changes shape. It stops being "how many contacts did the bot handle" and becomes "how many did it actually
PKComments Off on AI in Customer Service Dashboard in Excel
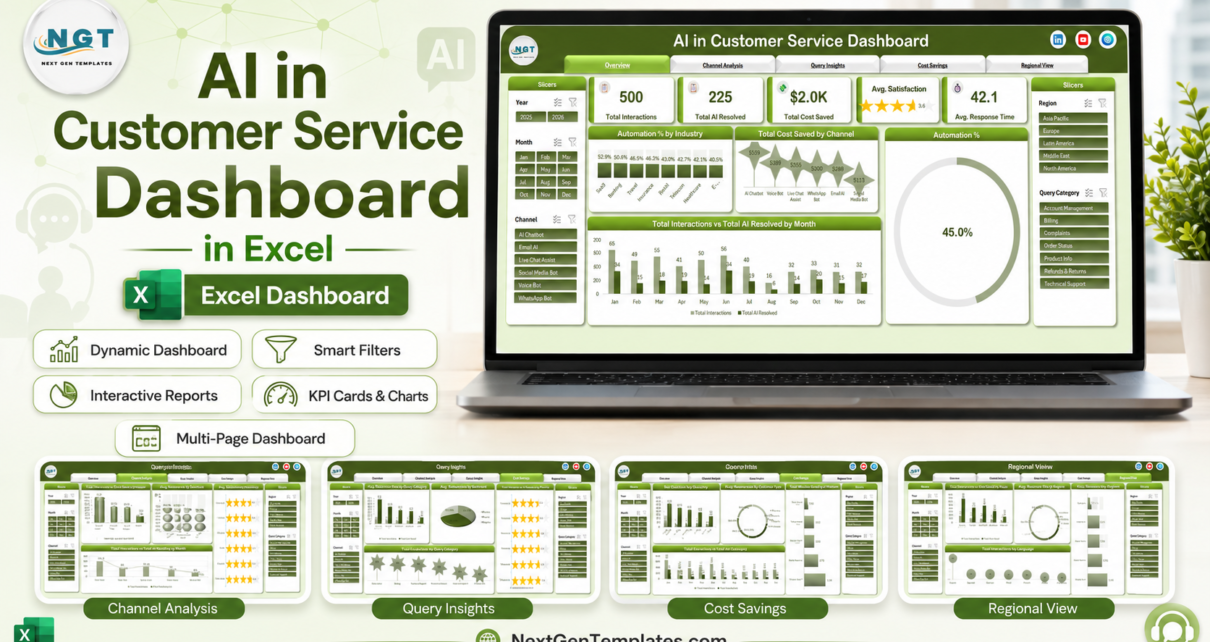
Any support team that has deployed a chatbot eventually faces the same board question, and vendor deflection numbers rarely answer it. They tend to count contacts the bot touched rather
PKComments Off on Contact Center AI Dashboard in Excel
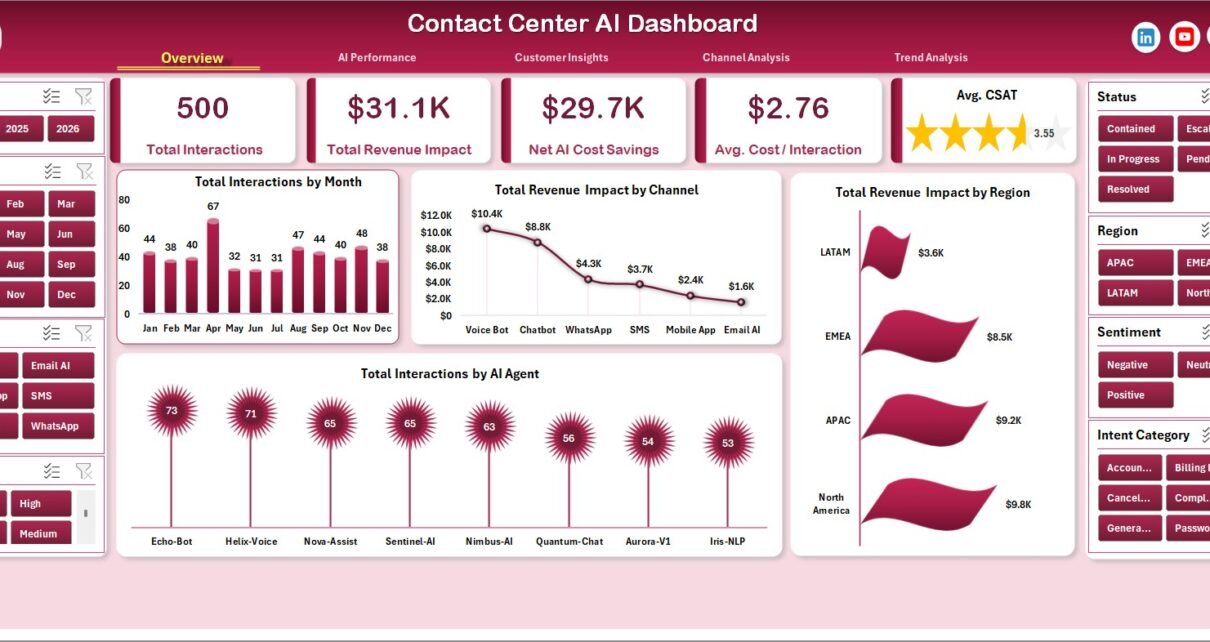
Contact centers can spend thousands of dollars per year on AI analytics, QA reporting, and help-desk dashboard add-ons, especially when agent seats, chatbot reporting, and CRM analytics are priced separately.
PKComments Off on Customer Support SLA KPI Dashboard in Power BI
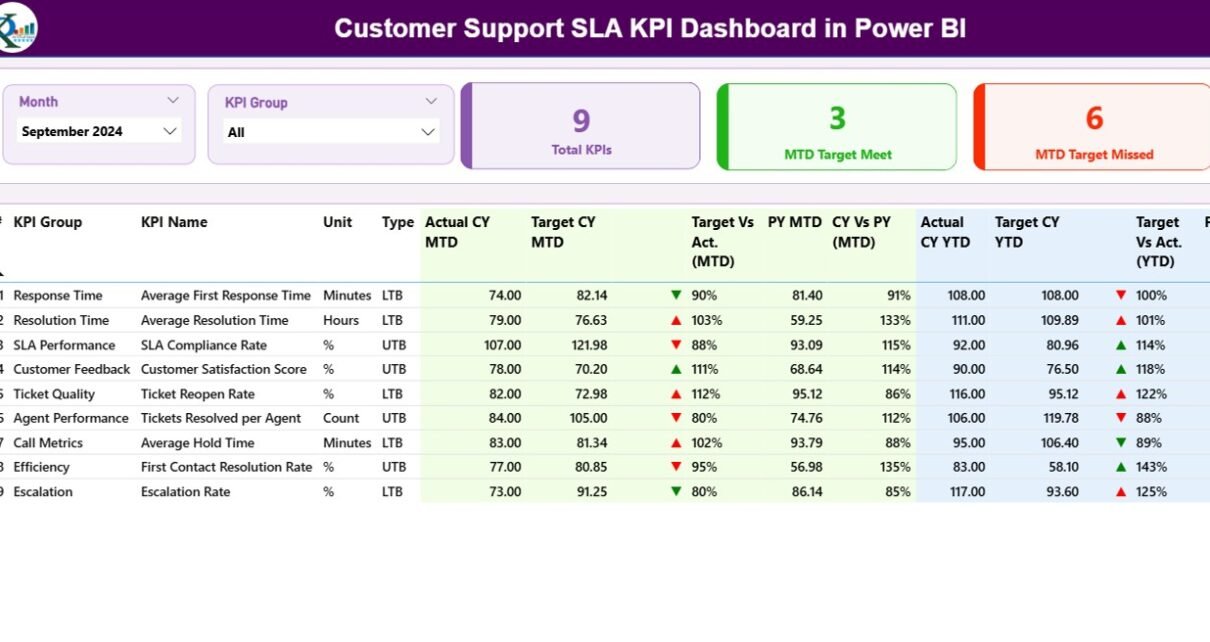
The Customer Support SLA KPI Dashboard in Power BI tracks customer support SLA performance across 3 interactive pages, with MTD and YTD comparisons against targets and prior-year benchmarks. Setup takes
PKComments Off on Customer Service and Support Revenue Tracking KPI Dashboard in Excel
In today’s fast-paced business world, customer service has evolved beyond just answering queries or resolving complaints. It now plays a key role in generating revenue. That’s why tracking and analyzing