New: NextGenTemplates Academy - video courses on Excel formulas with AI and Pivot Tables & dashboards. Early-bird: 20% off with code EARLYBIRD20 - first 20 orders only. See the courses →
  • Learn Excel (Free Course)
    • 1. Shortcut Keys
    • 2. Fill & Flash Fill
    • 3. Find & Replace
    • 4. Sort & Filter
    • 5. Formulas & Functions
    • 6. Data Validation
    • 7. Conditional Formatting
    • 8. Basic Charts
    • 9. Advanced Charts
    • 10. Pivot Tables
    • 11. Excel Dashboards
    • 12. VBA Course
    • 13. Excel Formulas with AI
  • Templates
  • Tutorials
    • Charts and Visualization
    • VBA
    • Excel Tips and Tricks
    • Excel Dashboards
    • Power Pivot & DAX
  • Power BI
  • Template Store
    • Ready to Use Templates
  • Courses
  • Academy
    • Excel + AI Mastery: 100 Formulas
    • Excel Pivot Tables & Dashboards
  • About Us
  • Contact Us

PK: An Excel Expert

Transforming Data into Decisions

Tag: dialysis

Templates VBA

Dialysis Session Calendar in Excel

August 30, 2026August 30, 2026 PK0
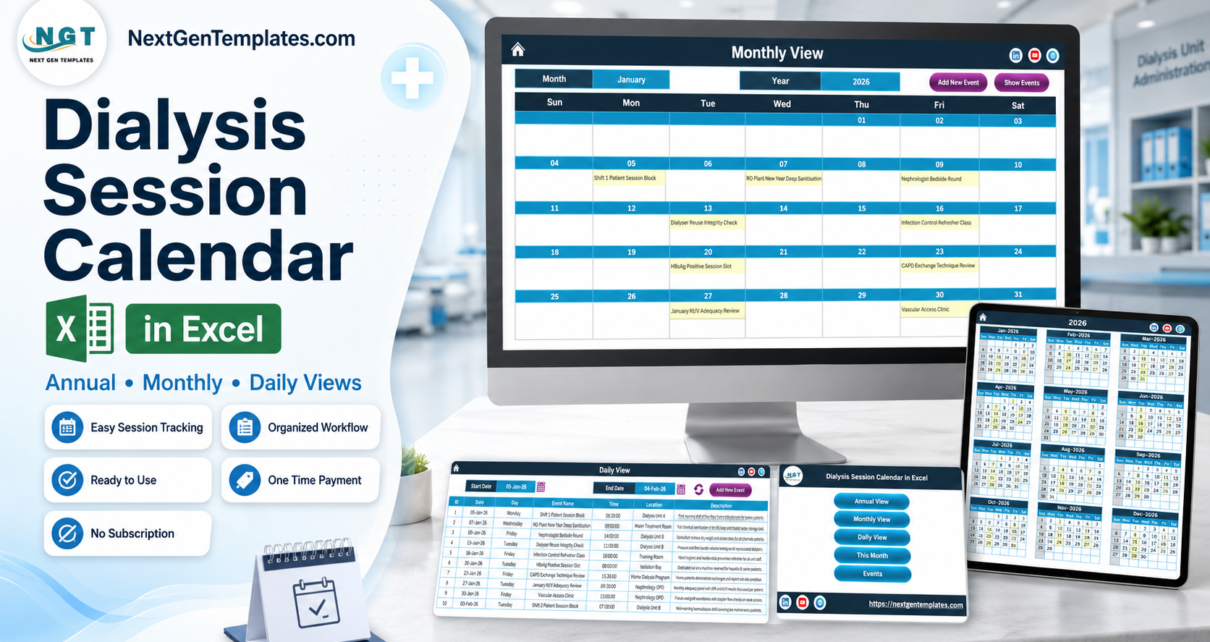
A dialysis unit runs on a timetable that never stops. Four shift blocks a day, isolation slots that cannot move, an RO plant that has to be sanitised on schedule,
Read More
Power BI Templates

Dialysis Centers Dashboard in Power BI

June 2, 2026June 2, 2026 PKComments Off on Dialysis Centers Dashboard in Power BI
The Dialysis Centers Dashboard in Power BI is a ready-made analytics report for dialysis center administrators, healthcare finance teams, regional clinic managers, and nephrology analysts who need a clearer way
Read More
Dashboard Templates

Dialysis Centers Dashboard in Excel

June 2, 2026June 2, 2026 PKComments Off on Dialysis Centers Dashboard in Excel
The Dialysis Centers Dashboard in Excel gives dialysis center teams a practical way to monitor sessions, revenue, cost, profit, satisfaction, adequacy, treatment mix, and center performance from one editable workbook.
Read More
Dashboard

Dialysis Centers KPI Dashboard in Excel

March 16, 2026March 16, 2026 PKComments Off on Dialysis Centers KPI Dashboard in Excel
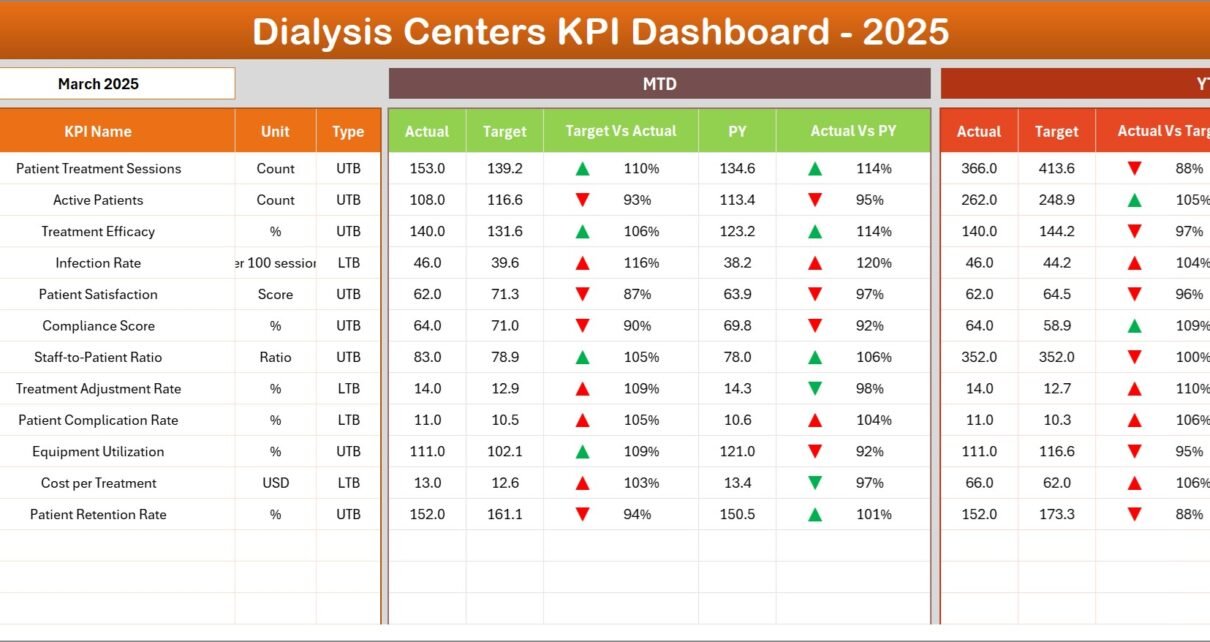
Dialysis Centers KPI Dashboard — Introduction Dialysis Centers KPI Dashboard is a ready-to-use Excel template designed to help clinic managers and analysts monitor clinical and operational KPIs. This post explains
Read More
  • Learn Excel (Free Course)
    • 1. Shortcut Keys
    • 2. Fill & Flash Fill
    • 3. Find & Replace
    • 4. Sort & Filter
    • 5. Formulas & Functions
    • 6. Data Validation
    • 7. Conditional Formatting
    • 8. Basic Charts
    • 9. Advanced Charts
    • 10. Pivot Tables
    • 11. Excel Dashboards
    • 12. VBA Course
    • 13. Excel Formulas with AI
  • Templates
  • Tutorials
    • Charts and Visualization
    • VBA
    • Excel Tips and Tricks
    • Excel Dashboards
    • Power Pivot & DAX
  • Power BI
  • Template Store
    • Ready to Use Templates
  • Courses
  • Academy
    • Excel + AI Mastery: 100 Formulas
    • Excel Pivot Tables & Dashboards
  • About Us
  • Contact Us
Copyright © 2023 PK-AnExcelExpert.com - Privacy Policy