New: NextGenTemplates Academy - video courses on Excel formulas with AI and Pivot Tables & dashboards. Early-bird: 20% off with code EARLYBIRD20 - first 20 orders only. See the courses →
  • Learn Excel (Free Course)
    • 1. Shortcut Keys
    • 2. Fill & Flash Fill
    • 3. Find & Replace
    • 4. Sort & Filter
    • 5. Formulas & Functions
    • 6. Data Validation
    • 7. Conditional Formatting
    • 8. Basic Charts
    • 9. Advanced Charts
    • 10. Pivot Tables
    • 11. Excel Dashboards
    • 12. VBA Course
    • 13. Excel Formulas with AI
  • Templates
  • Tutorials
    • Charts and Visualization
    • VBA
    • Excel Tips and Tricks
    • Excel Dashboards
    • Power Pivot & DAX
  • Power BI
  • Template Store
    • Ready to Use Templates
  • Courses
  • Academy
    • Excel + AI Mastery: 100 Formulas
    • Excel Pivot Tables & Dashboards
  • About Us
  • Contact Us

PK: An Excel Expert

Transforming Data into Decisions

Tag: Excel KPI Dashboard

Dashboard

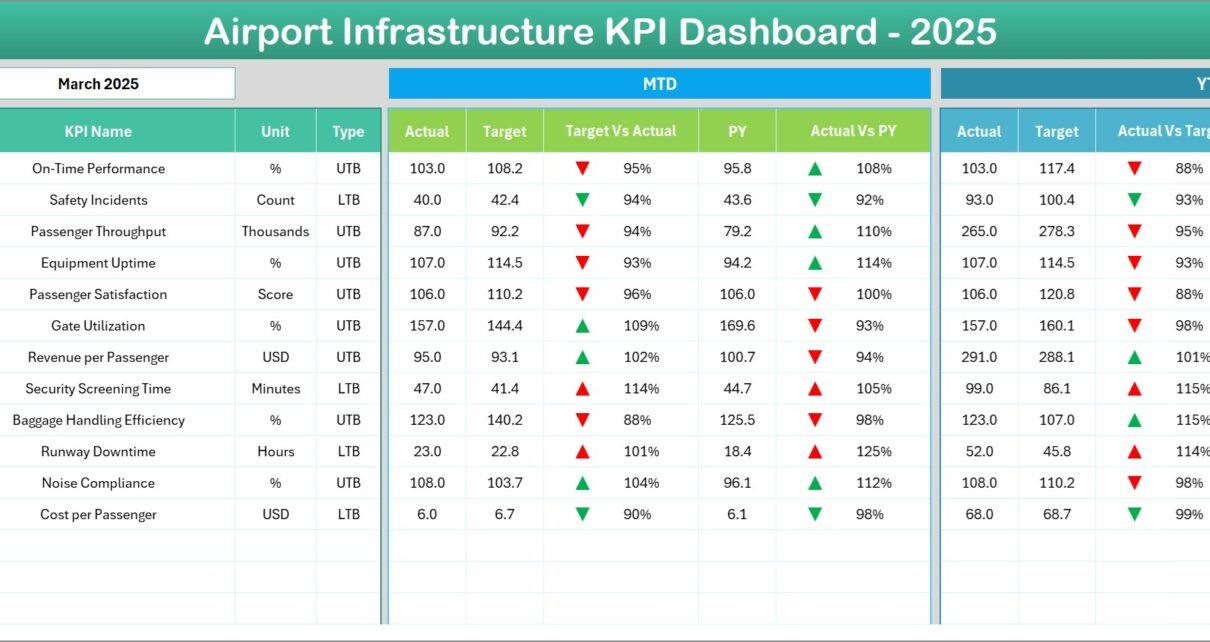
Airport Infrastructure KPI Dashboard in Excel

March 7, 2026March 7, 2026 PKComments Off on Airport Infrastructure KPI Dashboard in Excel
Airports operate as complex infrastructure hubs that connect cities, countries, and global trade routes. Every day, thousands of passengers, aircraft, and cargo shipments pass through airport facilities. Therefore, airport authorities
Read More
Dashboard

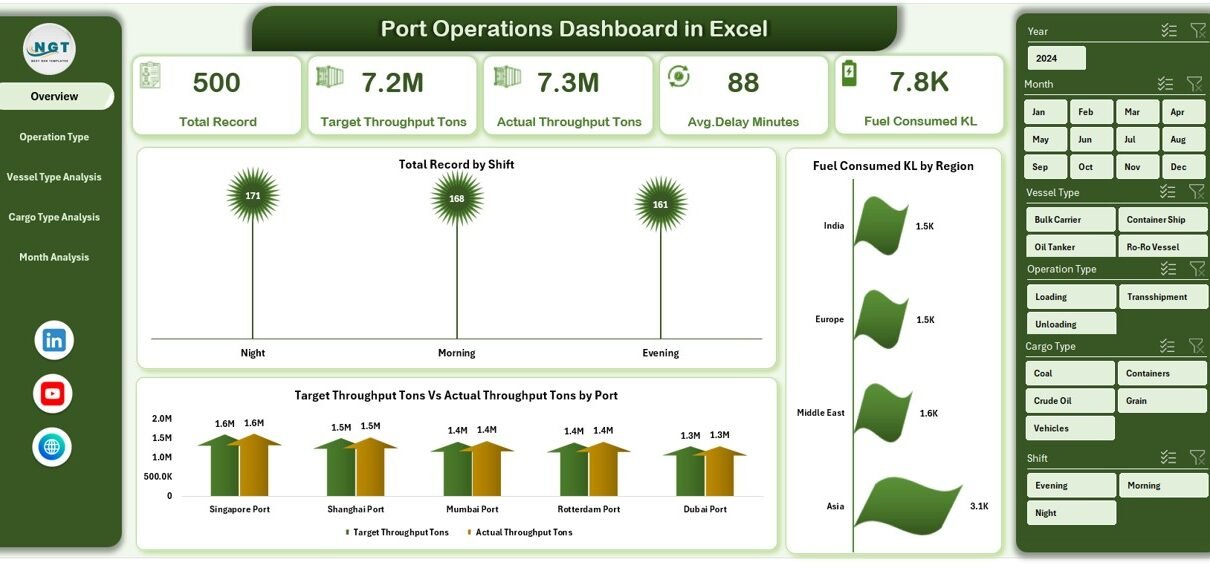
Port Operations Dashboard in Excel

March 6, 2026March 6, 2026 PKComments Off on Port Operations Dashboard in Excel
Ports play a crucial role in global trade and logistics. Every day, ports handle thousands of vessels, cargo shipments, fuel operations, and logistics activities. Therefore, port authorities and operations teams
Read More
Templates

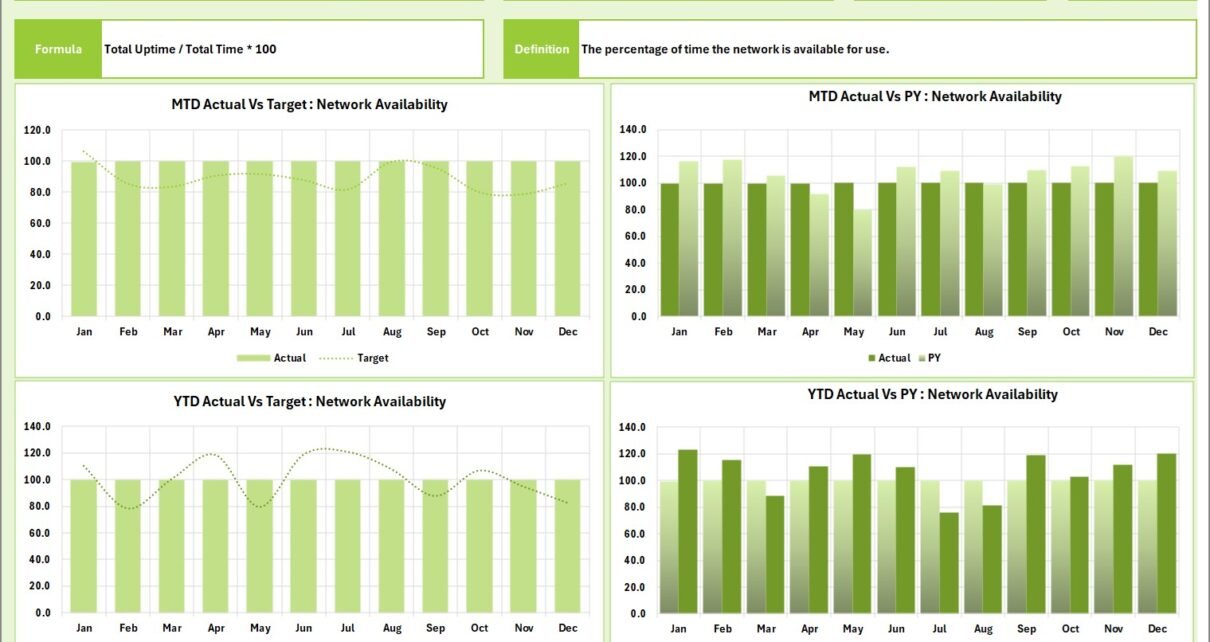
Telecom Network KPI Scorecard in Excel

March 6, 2026March 6, 2026 PKComments Off on Telecom Network KPI Scorecard in Excel
Telecom networks generate massive amounts of operational data every day. Network availability, call quality, data speed, service reliability, and customer experience all depend on continuous monitoring of key performance indicators
Read More
Dashboard

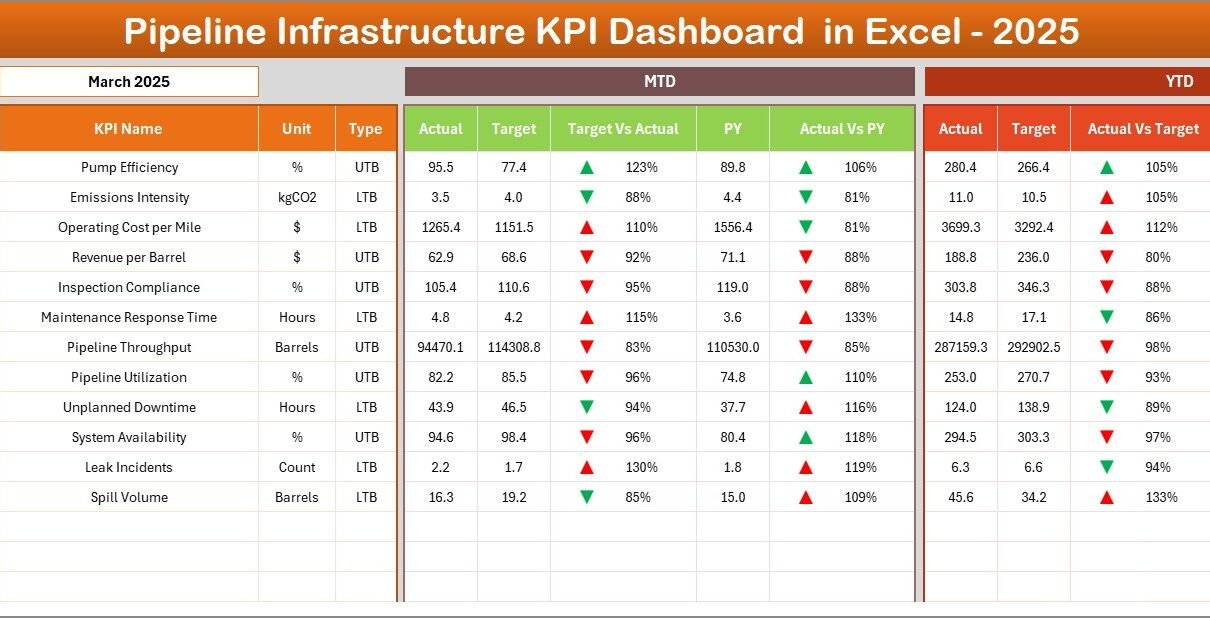
Pipeline Infrastructure KPI Dashboard in Excel

March 6, 2026March 6, 2026 PKComments Off on Pipeline Infrastructure KPI Dashboard in Excel
Infrastructure projects require precise monitoring, accurate reporting, and consistent performance tracking. However, managing pipeline infrastructure projects using scattered spreadsheets and manual reports often creates confusion and delays. As a result,
Read More
Dashboard

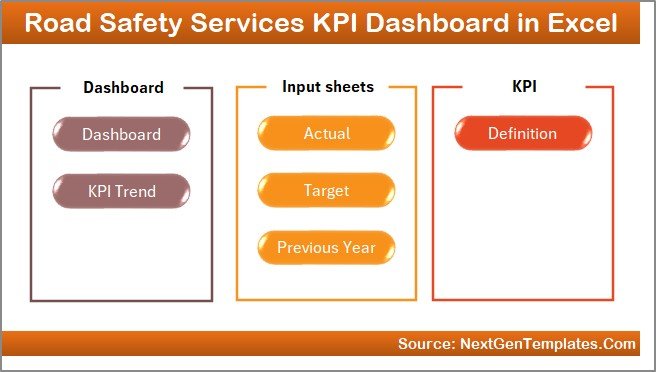
Road Safety Services KPI Dashboard in Excel

March 6, 2026March 6, 2026 PKComments Off on Road Safety Services KPI Dashboard in Excel
Road safety management plays a critical role in protecting lives, improving traffic control, and reducing accidents on roads. However, many road safety departments still manage performance data using scattered spreadsheets,
Read More
Dashboard

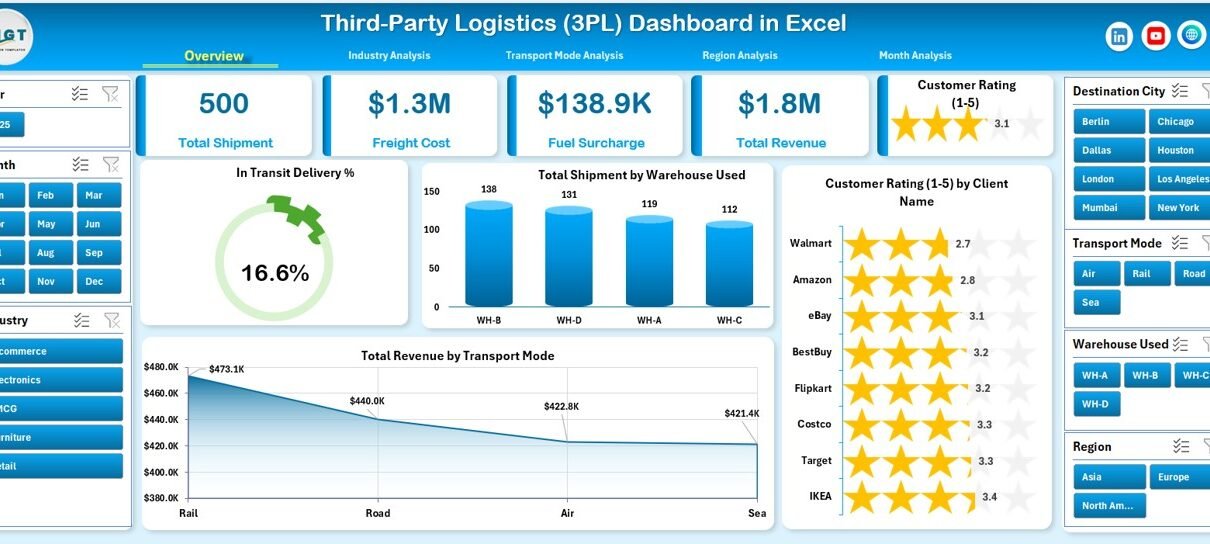
Third-Party Logistics (3PL) Dashboard in Excel

March 3, 2026March 3, 2026 PKComments Off on Third-Party Logistics (3PL) Dashboard in Excel
In today’s fast-moving supply chain world, logistics companies must track shipments, freight costs, fuel surcharges, and customer satisfaction in real time. However, many 3PL providers still rely on scattered spreadsheets
Read More
Power Pivot

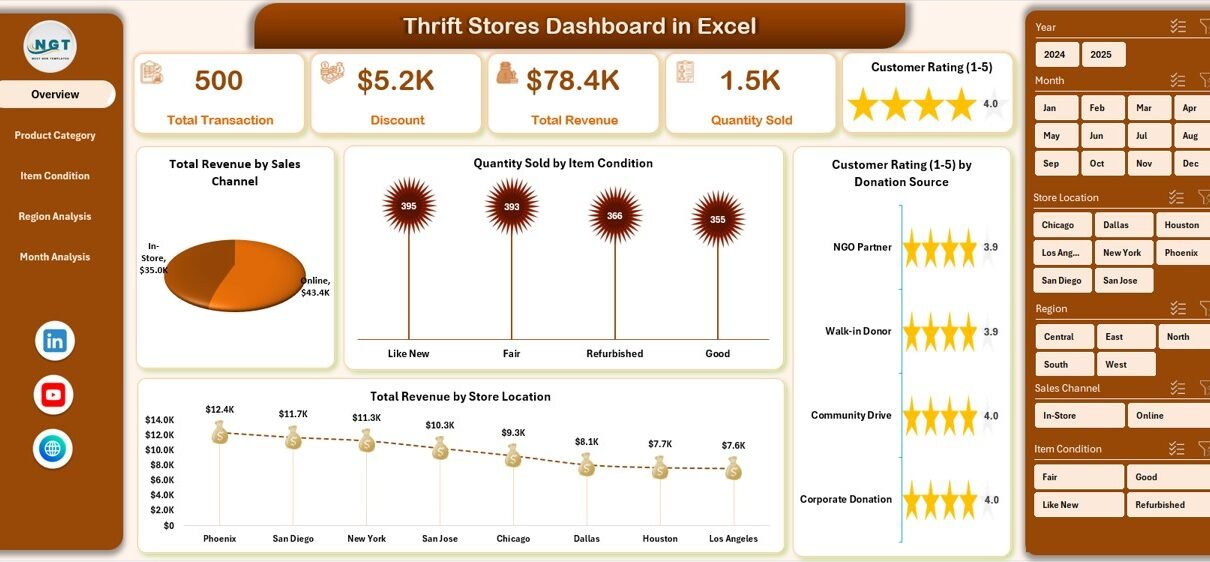
Thrift Stores Dashboard in Excel

March 2, 2026March 2, 2026 PKComments Off on Thrift Stores Dashboard in Excel
Thrift stores continue to grow rapidly across the world. Customers now prefer sustainable shopping, affordable products, and recycled fashion. As a result, thrift store owners must manage donations, pricing, inventory,
Read More
Dashboard

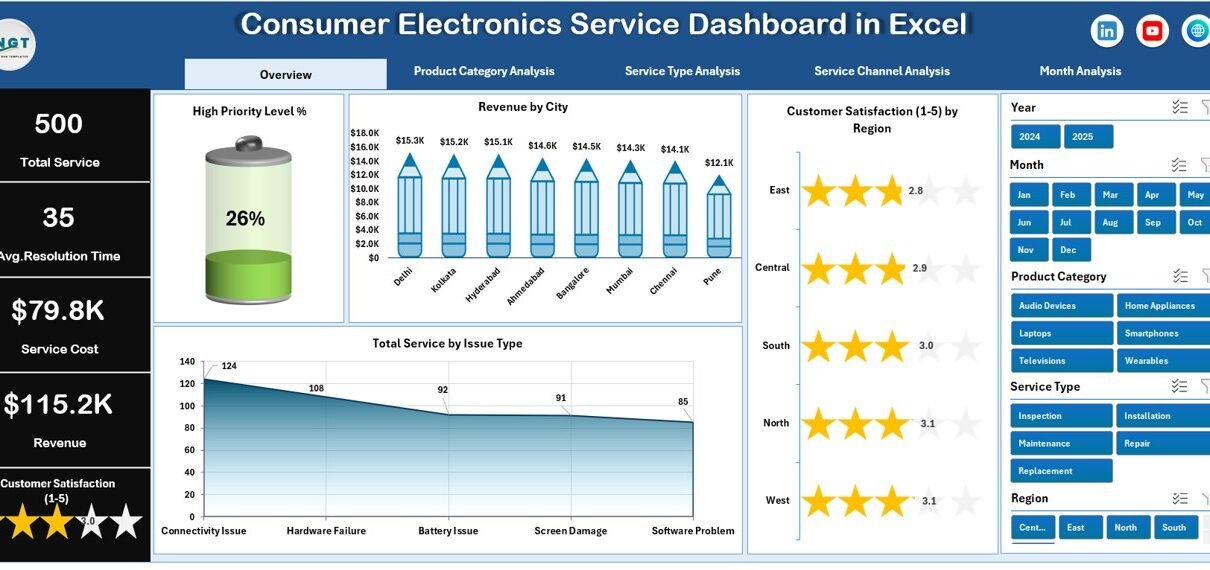
Consumer Electronics Service Dashboard in Excel

March 2, 2026March 2, 2026 PKComments Off on Consumer Electronics Service Dashboard in Excel
Consumer electronics companies handle thousands of service requests every month. Customers expect fast repairs, quick responses, and high-quality service experiences. However, managing service data manually creates confusion, delays decision-making, and
Read More
Dashboard

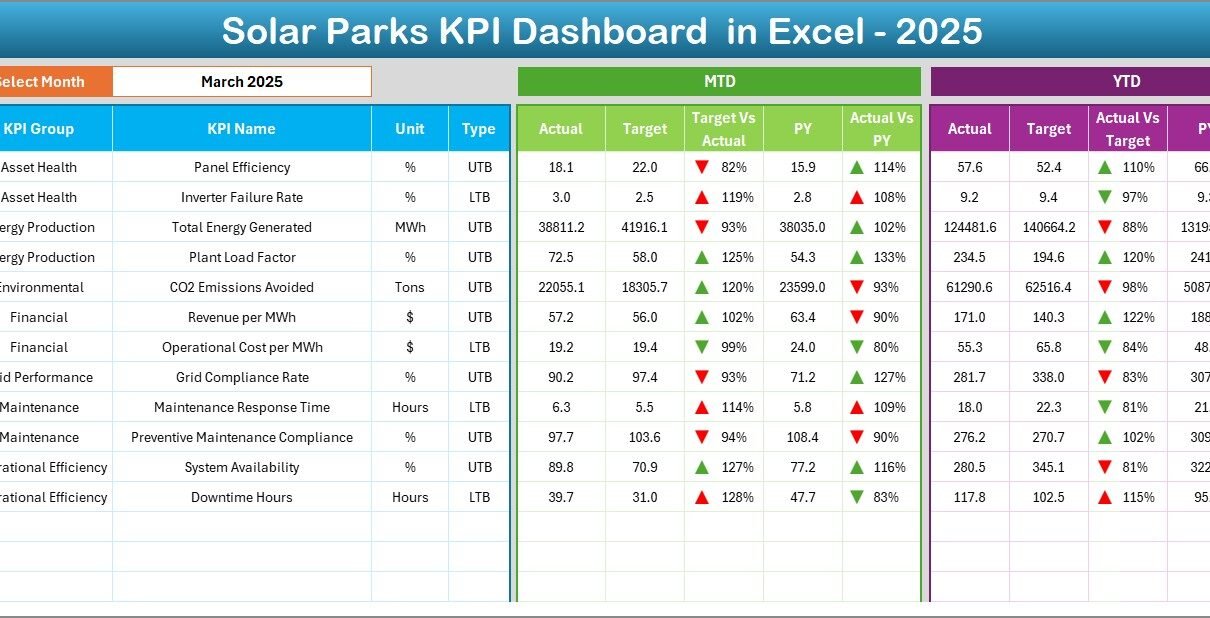
Solar Parks KPI Dashboard in Excel

March 2, 2026March 2, 2026 PKComments Off on Solar Parks KPI Dashboard in Excel
The renewable energy industry continues to grow rapidly, and solar parks now play a major role in global electricity production. However, managing solar park operations requires continuous monitoring, accurate reporting,
Read More
Dashboard

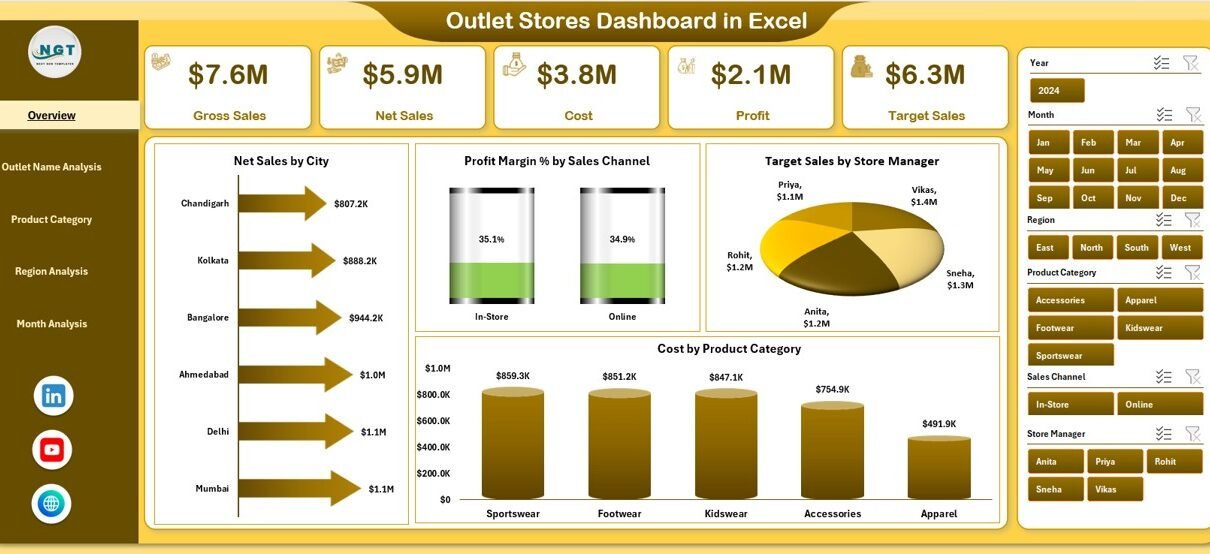
Outlet Stores Dashboard in Excel

March 1, 2026March 1, 2026 PKComments Off on Outlet Stores Dashboard in Excel
Retail businesses operate in a fast-moving and highly competitive environment. Outlet stores especially face constant pressure to increase sales, manage operational costs, and understand customer behavior across multiple locations. Therefore,
Read More

Posts pagination

Previous 1 … 12 13 14 … 44 Next
  • Learn Excel (Free Course)
    • 1. Shortcut Keys
    • 2. Fill & Flash Fill
    • 3. Find & Replace
    • 4. Sort & Filter
    • 5. Formulas & Functions
    • 6. Data Validation
    • 7. Conditional Formatting
    • 8. Basic Charts
    • 9. Advanced Charts
    • 10. Pivot Tables
    • 11. Excel Dashboards
    • 12. VBA Course
    • 13. Excel Formulas with AI
  • Templates
  • Tutorials
    • Charts and Visualization
    • VBA
    • Excel Tips and Tricks
    • Excel Dashboards
    • Power Pivot & DAX
  • Power BI
  • Template Store
    • Ready to Use Templates
  • Courses
  • Academy
    • Excel + AI Mastery: 100 Formulas
    • Excel Pivot Tables & Dashboards
  • About Us
  • Contact Us
Copyright © 2023 PK-AnExcelExpert.com - Privacy Policy