New: NextGenTemplates Academy - video courses on Excel formulas with AI and Pivot Tables & dashboards. Early-bird: 20% off with code EARLYBIRD20 - first 20 orders only. See the courses →
  • Learn Excel (Free Course)
    • 1. Shortcut Keys
    • 2. Fill & Flash Fill
    • 3. Find & Replace
    • 4. Sort & Filter
    • 5. Formulas & Functions
    • 6. Data Validation
    • 7. Conditional Formatting
    • 8. Basic Charts
    • 9. Advanced Charts
    • 10. Pivot Tables
    • 11. Excel Dashboards
    • 12. VBA Course
    • 13. Excel Formulas with AI
  • Templates
  • Tutorials
    • Charts and Visualization
    • VBA
    • Excel Tips and Tricks
    • Excel Dashboards
    • Power Pivot & DAX
  • Power BI
  • Template Store
    • Ready to Use Templates
  • Courses
  • Academy
    • Excel + AI Mastery: 100 Formulas
    • Excel Pivot Tables & Dashboards
  • About Us
  • Contact Us

PK: An Excel Expert

Transforming Data into Decisions

Tag: Excel KPI Dashboard

Dashboard

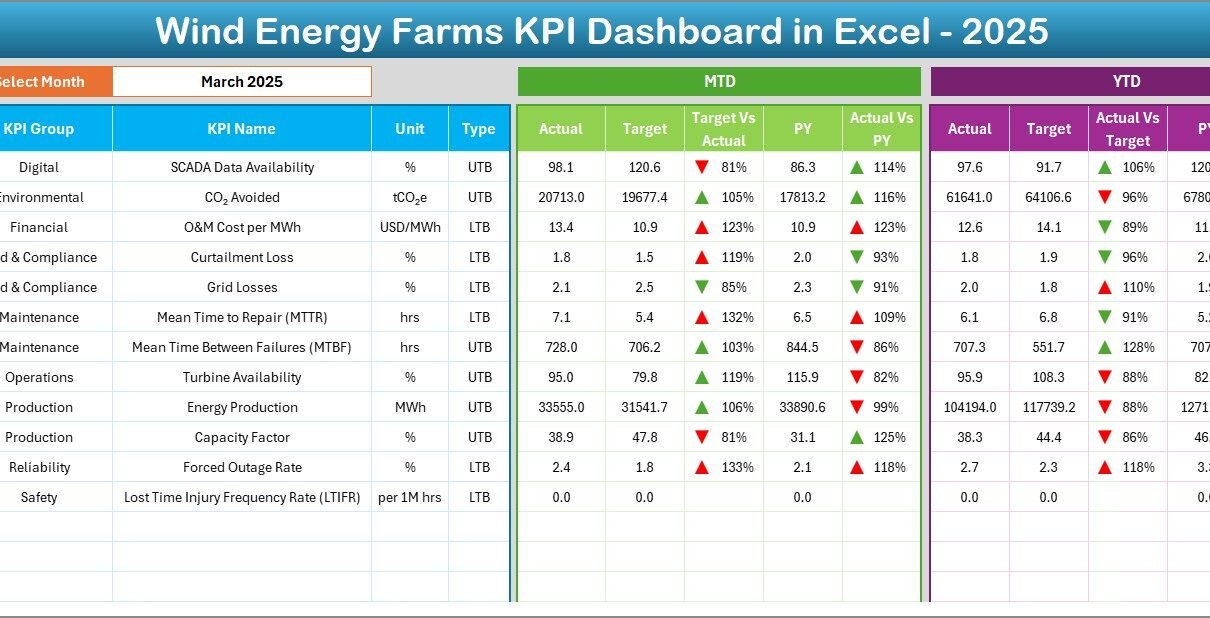
Wind Energy Farms KPI Dashboard in Excel

March 1, 2026March 1, 2026 PKComments Off on Wind Energy Farms KPI Dashboard in Excel
Wind energy continues to grow rapidly across the world. Governments, private investors, and renewable energy companies invest heavily in wind farms to produce clean electricity and reduce carbon emissions. However,
Read More
Templates

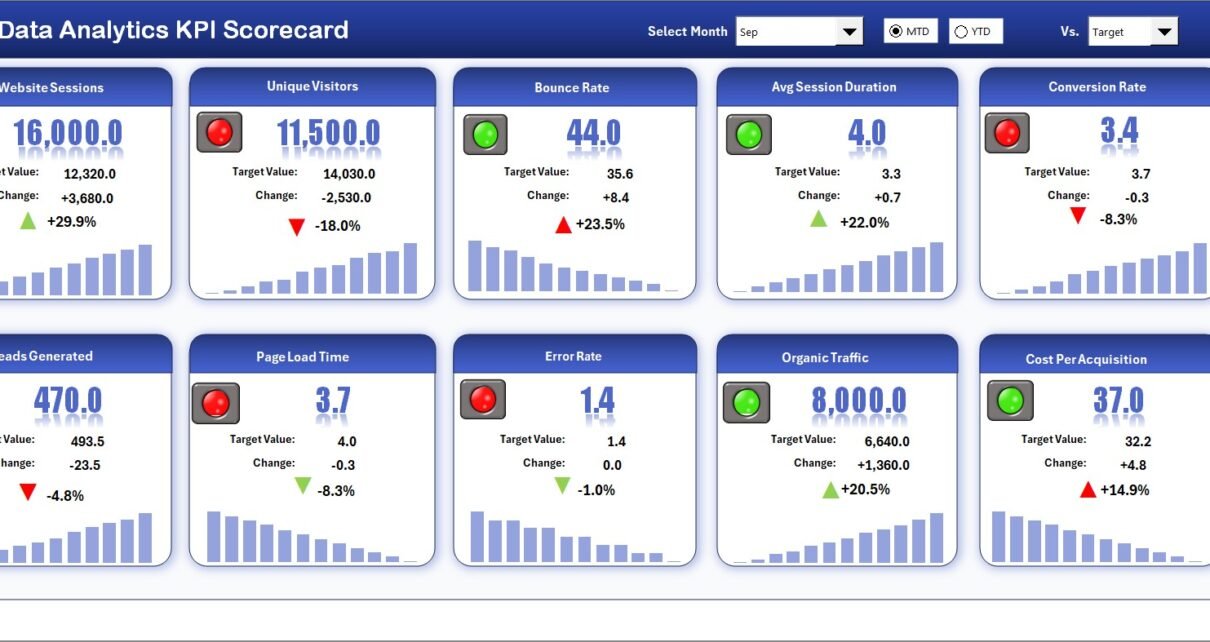
Data Analytics KPI Scorecard in Excel

February 28, 2026February 28, 2026 PKComments Off on Data Analytics KPI Scorecard in Excel
In today’s data-driven business environment, organizations rely heavily on data analytics to make smarter decisions, improve operational efficiency, and gain competitive advantages. Companies collect massive volumes of data every day.
Read More
Dashboard

Commodities Trading Dashboard in Excel

February 28, 2026February 28, 2026 PKComments Off on Commodities Trading Dashboard in Excel
In today’s fast-moving financial markets, commodities trading requires speed, accuracy, and data-driven decision-making. Traders, brokers, and financial analysts continuously monitor trade values, brokerage costs, settlement status, and profit & loss
Read More
Dashboard

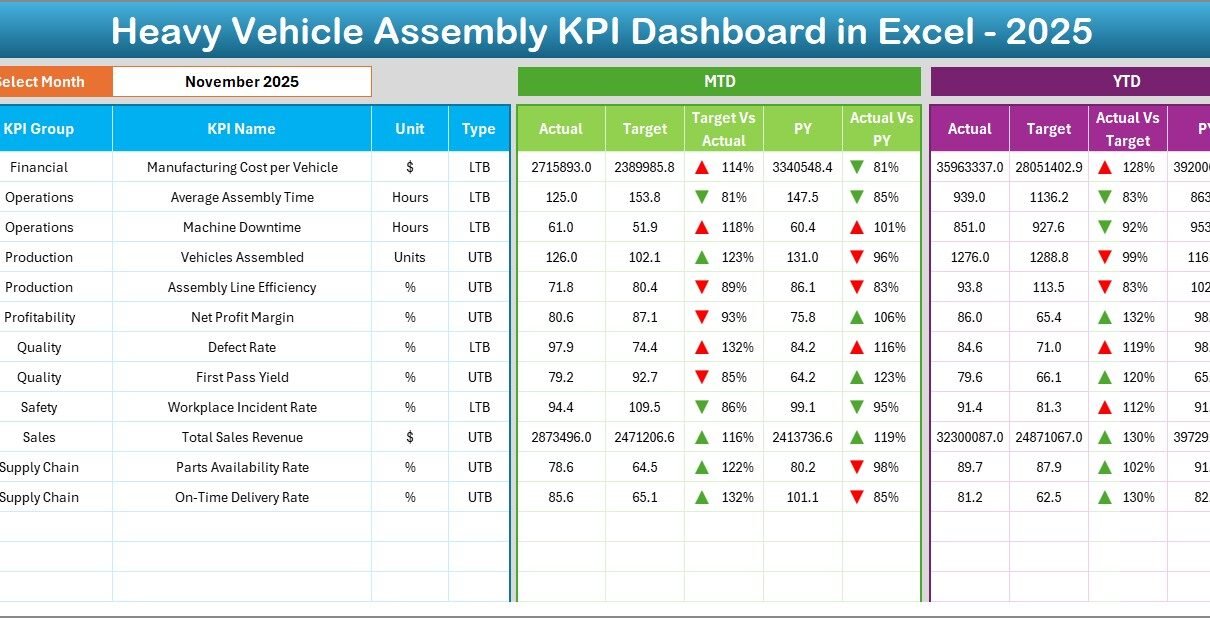
Heavy Vehicle Assembly KPI Dashboard in Excel

February 28, 2026February 28, 2026 PKComments Off on Heavy Vehicle Assembly KPI Dashboard in Excel
In today’s competitive manufacturing environment, heavy vehicle assembly companies must monitor production efficiency, quality performance, operational costs, and workforce productivity continuously. However, many organizations still rely on disconnected spreadsheets and
Read More
Dashboard

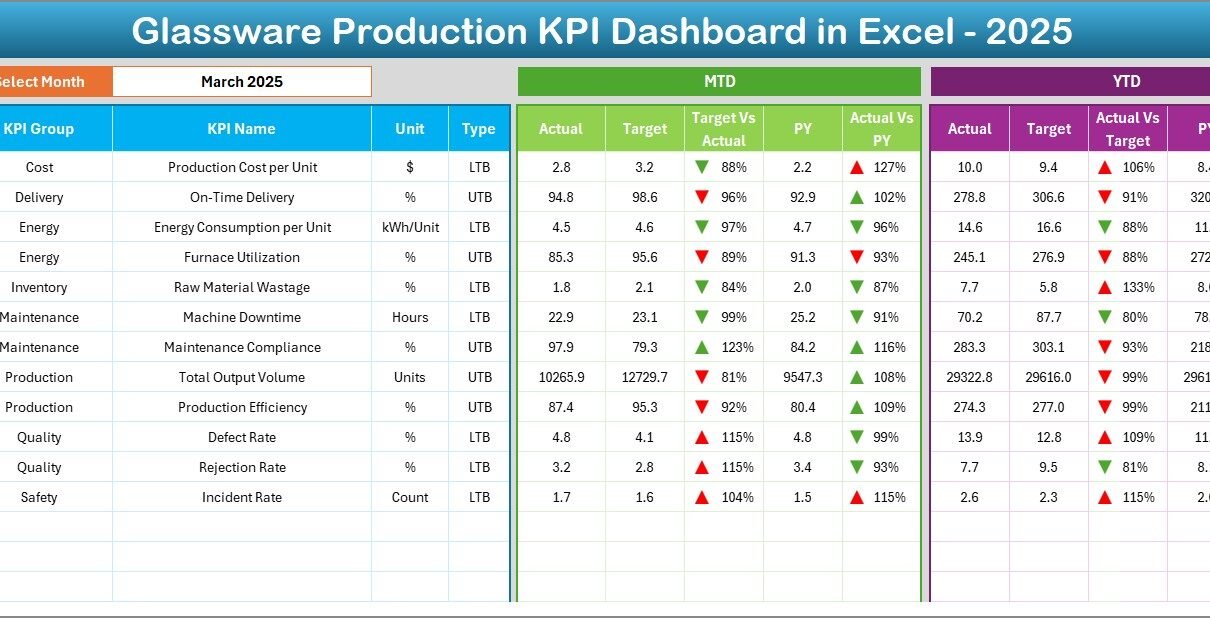
Glassware Production KPI Dashboard in Excel

February 27, 2026February 27, 2026 PKComments Off on Glassware Production KPI Dashboard in Excel
In today’s competitive manufacturing environment, glassware production companies must monitor performance closely to maintain quality, reduce waste, and improve operational efficiency. Manufacturers continuously face challenges such as production losses, quality
Read More
Dashboard

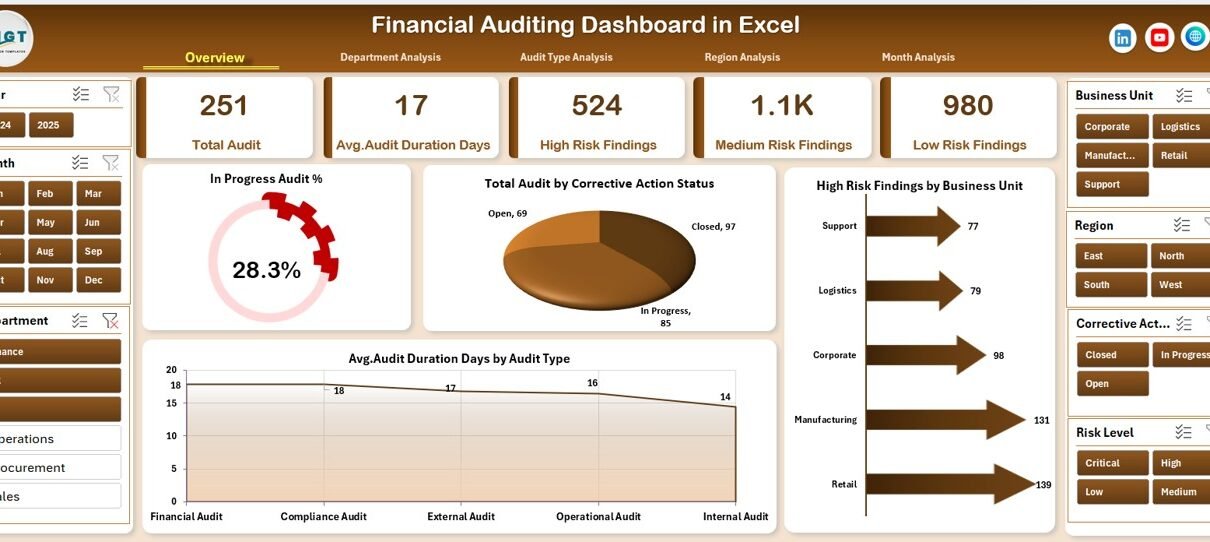
Financial Auditing Dashboard in Excel

February 27, 2026February 27, 2026 PKComments Off on Financial Auditing Dashboard in Excel
In today’s fast-changing business environment, organizations must maintain strong financial controls, ensure regulatory compliance, and monitor operational risks continuously. However, many companies still manage audits using scattered spreadsheets, manual reports,
Read More
Dashboard

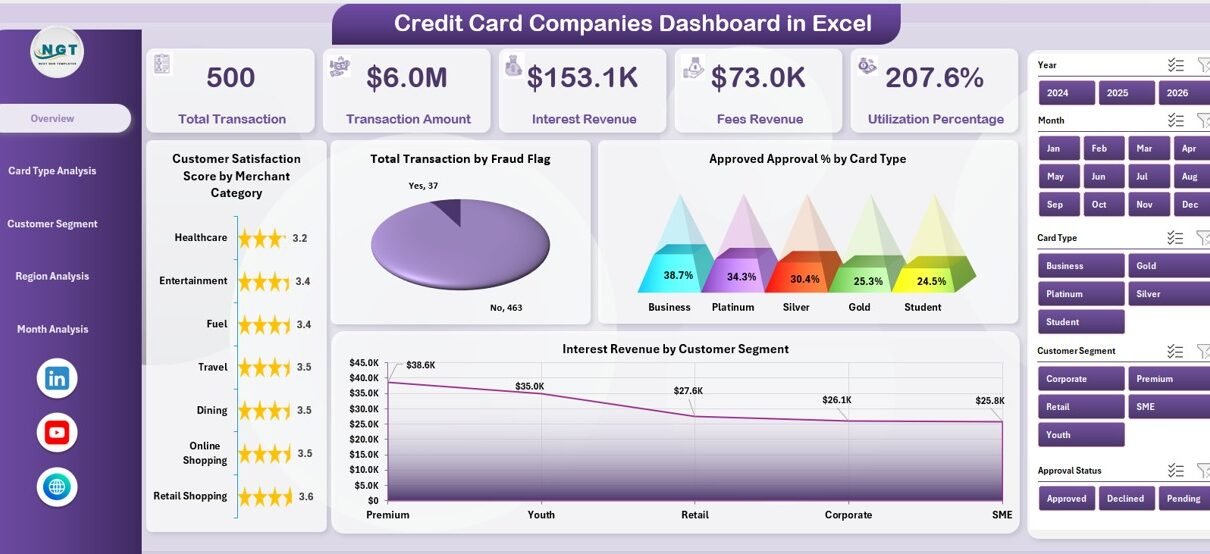
Credit Card Companies Dashboard in Excel

February 26, 2026February 26, 2026 PKComments Off on Credit Card Companies Dashboard in Excel
Credit card companies operate in a highly competitive and data-driven environment. Every day, organizations process thousands of transactions, monitor customer behavior, manage approval rates, analyze fraud risks, and track revenue
Read More
Dashboard

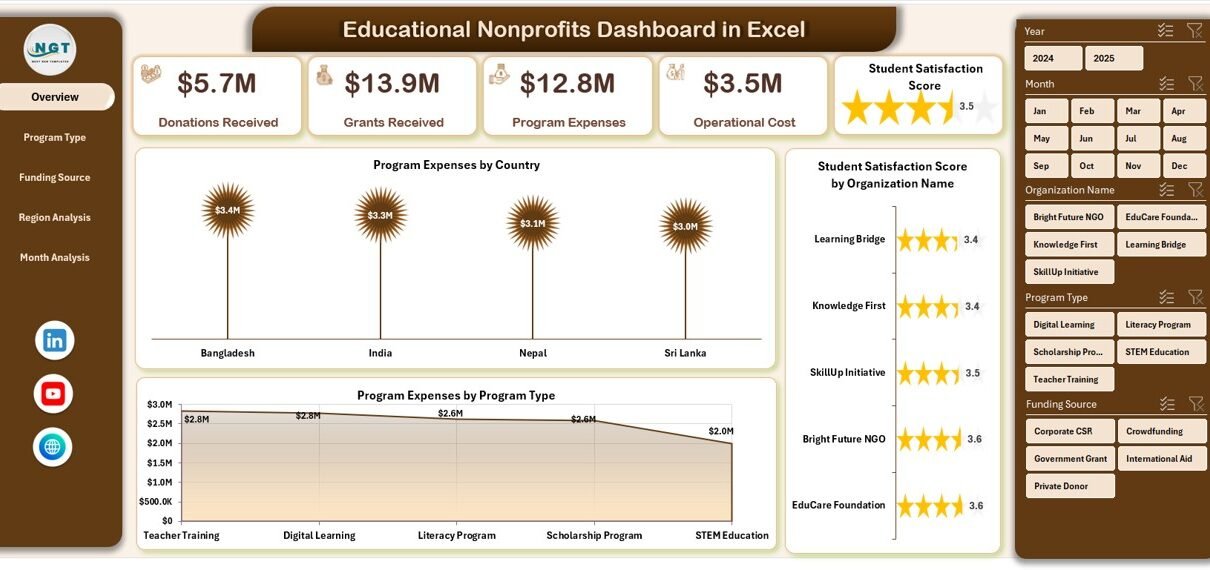
Educational Nonprofits Dashboard in Excel

February 26, 2026February 26, 2026 PKComments Off on Educational Nonprofits Dashboard in Excel
Educational nonprofits play a vital role in shaping communities, supporting students, and improving access to learning opportunities. However, managing programs, tracking donations, monitoring expenses, and measuring impact often becomes challenging
Read More
Dashboard

Nanomaterials KPI Dashboard in Excel

February 26, 2026February 26, 2026 PKComments Off on Nanomaterials KPI Dashboard in Excel
Nanotechnology continues to transform modern industries. Today, companies use nanomaterials in electronics, healthcare, energy storage, coatings, aerospace, and advanced manufacturing. However, as nanomaterial production grows, organizations must measure performance accurately
Read More
Dashboard

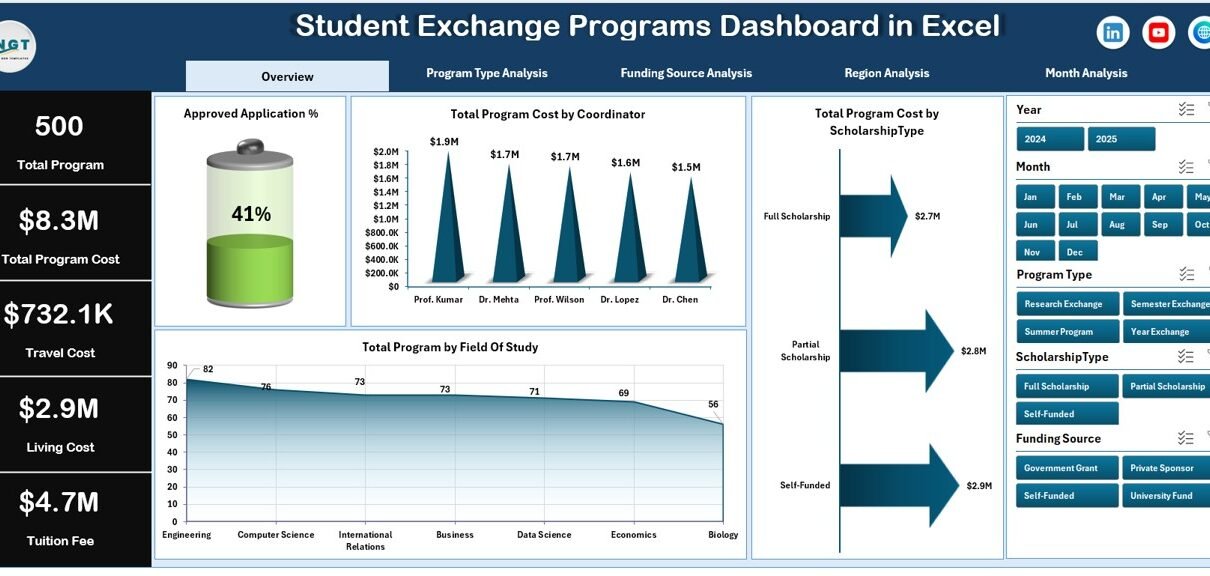
Student Exchange Programs Dashboard in Excel

February 25, 2026February 25, 2026 PKComments Off on Student Exchange Programs Dashboard in Excel
Educational institutions across the world continuously expand international collaboration through student exchange programs. Universities, colleges, and academic organizations send students abroad while also welcoming international learners. However, managing multiple exchange
Read More

Posts pagination

Previous 1 … 13 14 15 … 44 Next
  • Learn Excel (Free Course)
    • 1. Shortcut Keys
    • 2. Fill & Flash Fill
    • 3. Find & Replace
    • 4. Sort & Filter
    • 5. Formulas & Functions
    • 6. Data Validation
    • 7. Conditional Formatting
    • 8. Basic Charts
    • 9. Advanced Charts
    • 10. Pivot Tables
    • 11. Excel Dashboards
    • 12. VBA Course
    • 13. Excel Formulas with AI
  • Templates
  • Tutorials
    • Charts and Visualization
    • VBA
    • Excel Tips and Tricks
    • Excel Dashboards
    • Power Pivot & DAX
  • Power BI
  • Template Store
    • Ready to Use Templates
  • Courses
  • Academy
    • Excel + AI Mastery: 100 Formulas
    • Excel Pivot Tables & Dashboards
  • About Us
  • Contact Us
Copyright © 2023 PK-AnExcelExpert.com - Privacy Policy