New: NextGenTemplates Academy - video courses on Excel formulas with AI and Pivot Tables & dashboards. Early-bird: 20% off with code EARLYBIRD20 - first 20 orders only. See the courses →
  • Learn Excel (Free Course)
    • 1. Shortcut Keys
    • 2. Fill & Flash Fill
    • 3. Find & Replace
    • 4. Sort & Filter
    • 5. Formulas & Functions
    • 6. Data Validation
    • 7. Conditional Formatting
    • 8. Basic Charts
    • 9. Advanced Charts
    • 10. Pivot Tables
    • 11. Excel Dashboards
    • 12. VBA Course
    • 13. Excel Formulas with AI
  • Templates
  • Tutorials
    • Charts and Visualization
    • VBA
    • Excel Tips and Tricks
    • Excel Dashboards
    • Power Pivot & DAX
  • Power BI
  • Template Store
    • Ready to Use Templates
  • Courses
  • Academy
    • Excel + AI Mastery: 100 Formulas
    • Excel Pivot Tables & Dashboards
  • About Us
  • Contact Us

PK: An Excel Expert

Transforming Data into Decisions

Tag: Excel KPI Dashboard

Dashboard

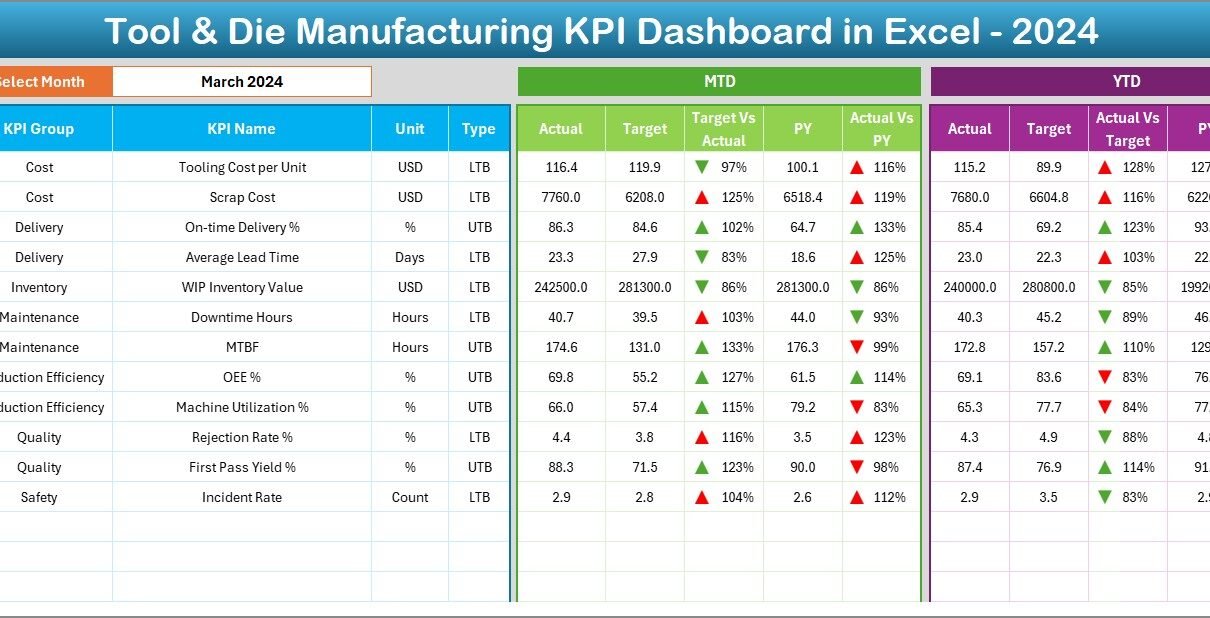
Tool & Die Manufacturing KPI Dashboard in Excel

December 11, 2025October 10, 2026 PKComments Off on Tool & Die Manufacturing KPI Dashboard in Excel
Tool and die manufacturing drives precision, accuracy, and efficiency for several industries. Automotive, aerospace, packaging, and engineering companies depend on high-quality tools and dies to run productions smoothly. Because of
Read More
Dashboard

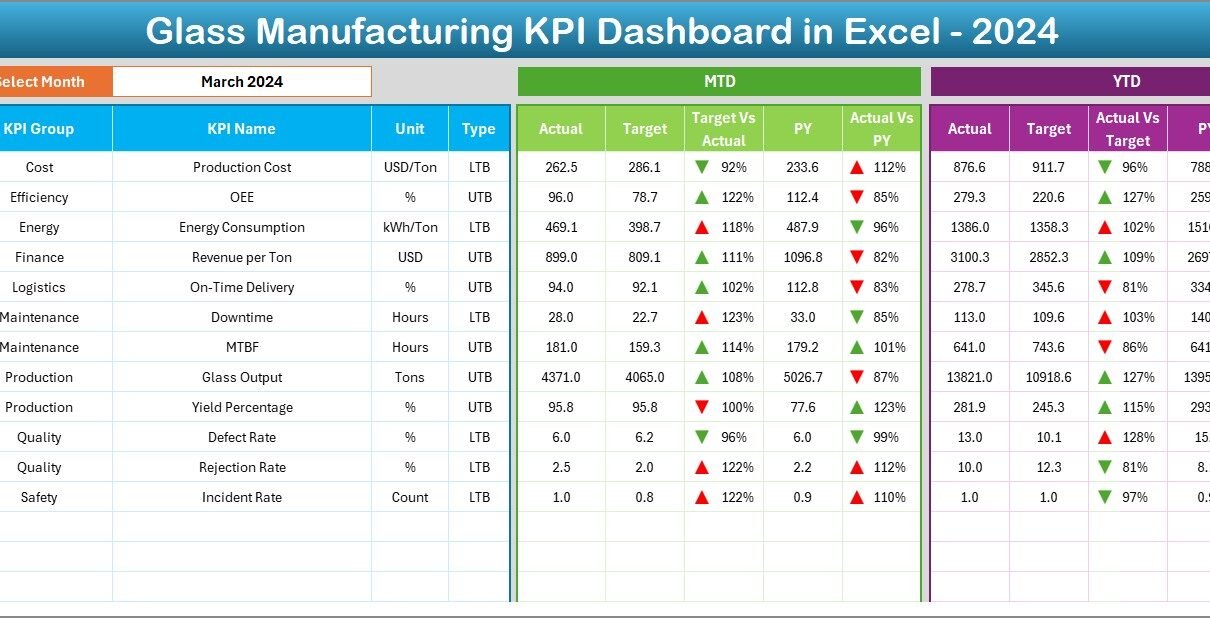
Glass Manufacturing KPI Dashboard in Excel

December 9, 2025December 9, 2025 PKComments Off on Glass Manufacturing KPI Dashboard in Excel
Running a glass manufacturing unit without clear performance visibility often leads to higher waste, increased downtime, missed targets, and delayed decisions. Although production teams generate大量 data every day, many organizations
Read More
Dashboard

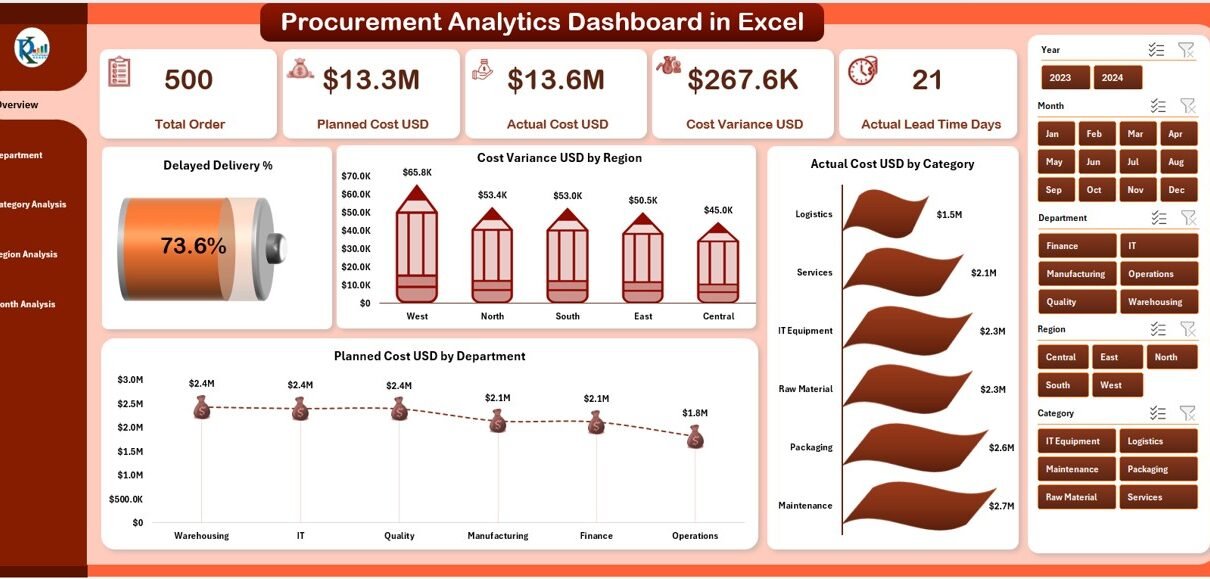
Procurement Analytics Dashboard in Excel

December 8, 2025December 8, 2025 PKComments Off on Procurement Analytics Dashboard in Excel
Procurement plays a critical role in controlling costs, improving supplier performance, and ensuring smooth operations across an organization. However, many procurement teams still struggle because they depend on manual reports,
Read More
Dashboard

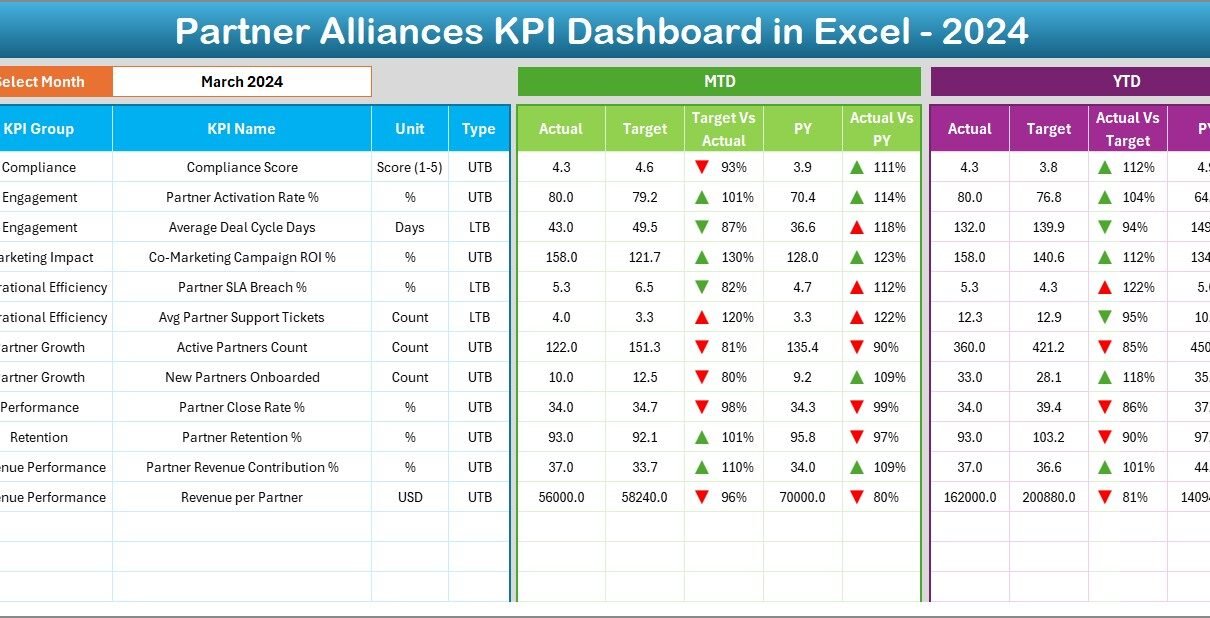
Partner Alliances KPI Dashboard in Excel

December 8, 2025December 8, 2025 PKComments Off on Partner Alliances KPI Dashboard in Excel
Managing partner alliances without proper visibility often leads to missed targets, weak collaboration, and unclear performance outcomes. However, when teams track the right KPIs in a structured way, partner relationships
Read More
Dashboard

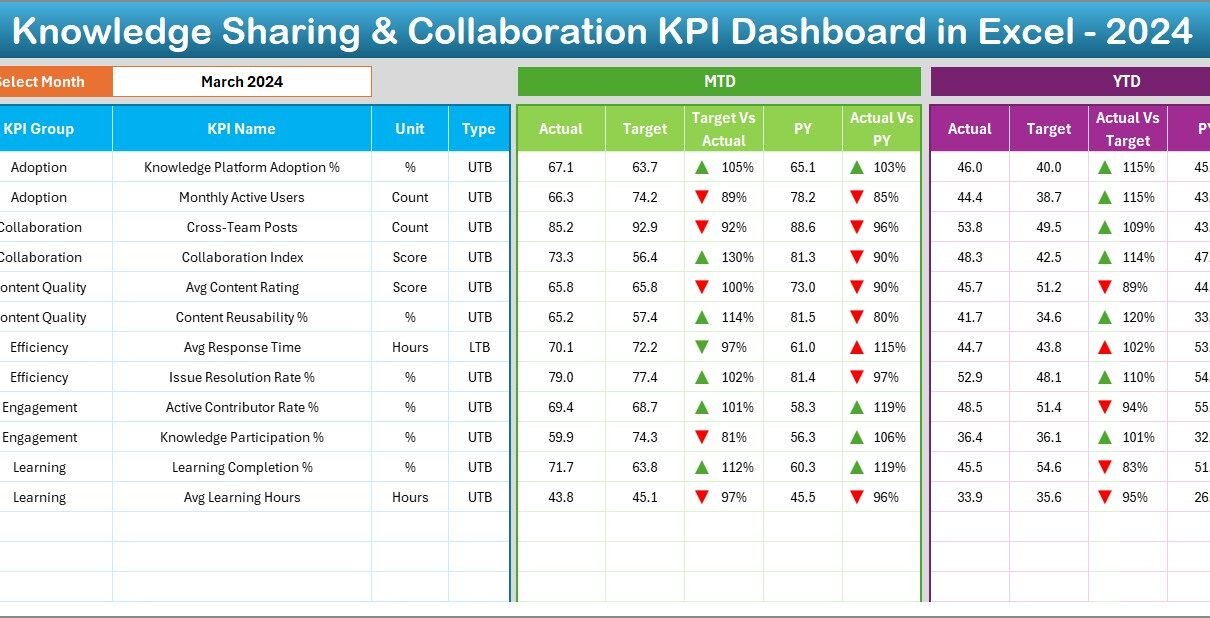
Knowledge Sharing & Collaboration KPI Dashboard in Excel

December 7, 2025December 7, 2025 PKComments Off on Knowledge Sharing & Collaboration KPI Dashboard in Excel
In today’s fast-moving digital workplaces, knowledge sharing and collaboration decide how fast teams learn, adapt, and perform. However, most organizations still struggle to measure how effectively employees share knowledge and
Read More
Dashboard

Port Logistics Dashboard in Excel

December 6, 2025December 6, 2025 PKComments Off on Port Logistics Dashboard in Excel
Port logistics plays a critical role in global trade and supply chains. Every day, ports handle thousands of containers, vessels, cargo types, shipping lines, and terminals. However, managing cost, revenue,
Read More
Dashboard

Smart Cities Development Dashboard in Excel

December 5, 2025December 5, 2025 PKComments Off on Smart Cities Development Dashboard in Excel
Smart cities continue to grow across the world, and every city leader wants better ways to track development activities, measure performance, and improve public services. However, many smart-city teams still
Read More
Dashboard

Seed & Fertilizer Manufacturing KPI Dashboard in Excel

December 5, 2025December 5, 2025 PKComments Off on Seed & Fertilizer Manufacturing KPI Dashboard in Excel
Seed and fertilizer manufacturing industries face constant pressure to improve productivity, reduce defects, optimize costs, and maintain high product quality. When operational data stays scattered across spreadsheets, emails, and manual
Read More
Dashboard

Water Utilities Dashboard in Excel

December 4, 2025December 4, 2025 PKComments Off on Water Utilities Dashboard in Excel
Managing water utilities requires constant attention, fast decision-making, and accurate visibility of operational and environmental indicators. Every region manages multiple water sources, treatment plants, consumer segments, and distribution networks. Because
Read More
Dashboard

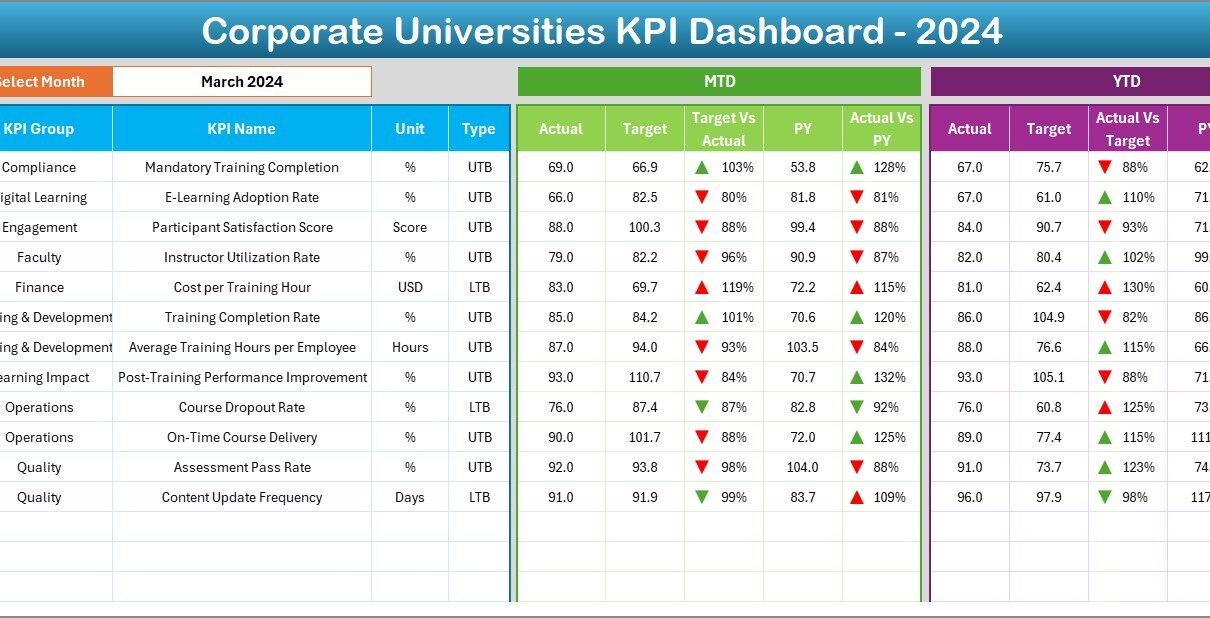
Corporate Universities KPI Dashboard in Excel

December 4, 2025December 4, 2025 PKComments Off on Corporate Universities KPI Dashboard in Excel
Corporate learning and capability development play an important role in every organization. Companies grow faster when employees learn new skills, complete training programs, and continuously improve performance. Because of this,
Read More

Posts pagination

Previous 1 … 30 31 32 … 44 Next
  • Learn Excel (Free Course)
    • 1. Shortcut Keys
    • 2. Fill & Flash Fill
    • 3. Find & Replace
    • 4. Sort & Filter
    • 5. Formulas & Functions
    • 6. Data Validation
    • 7. Conditional Formatting
    • 8. Basic Charts
    • 9. Advanced Charts
    • 10. Pivot Tables
    • 11. Excel Dashboards
    • 12. VBA Course
    • 13. Excel Formulas with AI
  • Templates
  • Tutorials
    • Charts and Visualization
    • VBA
    • Excel Tips and Tricks
    • Excel Dashboards
    • Power Pivot & DAX
  • Power BI
  • Template Store
    • Ready to Use Templates
  • Courses
  • Academy
    • Excel + AI Mastery: 100 Formulas
    • Excel Pivot Tables & Dashboards
  • About Us
  • Contact Us
Copyright © 2023 PK-AnExcelExpert.com - Privacy Policy