New: NextGenTemplates Academy - video courses on Excel formulas with AI and Pivot Tables & dashboards. Early-bird: 20% off with code EARLYBIRD20 - first 20 orders only. See the courses →
  • Learn Excel (Free Course)
    • 1. Shortcut Keys
    • 2. Fill & Flash Fill
    • 3. Find & Replace
    • 4. Sort & Filter
    • 5. Formulas & Functions
    • 6. Data Validation
    • 7. Conditional Formatting
    • 8. Basic Charts
    • 9. Advanced Charts
    • 10. Pivot Tables
    • 11. Excel Dashboards
    • 12. VBA Course
    • 13. Excel Formulas with AI
  • Templates
  • Tutorials
    • Charts and Visualization
    • VBA
    • Excel Tips and Tricks
    • Excel Dashboards
    • Power Pivot & DAX
  • Power BI
  • Template Store
    • Ready to Use Templates
  • Courses
  • Academy
    • Excel + AI Mastery: 100 Formulas
    • Excel Pivot Tables & Dashboards
  • About Us
  • Contact Us

PK: An Excel Expert

Transforming Data into Decisions

Tag: Excel KPI Dashboard

Dashboard

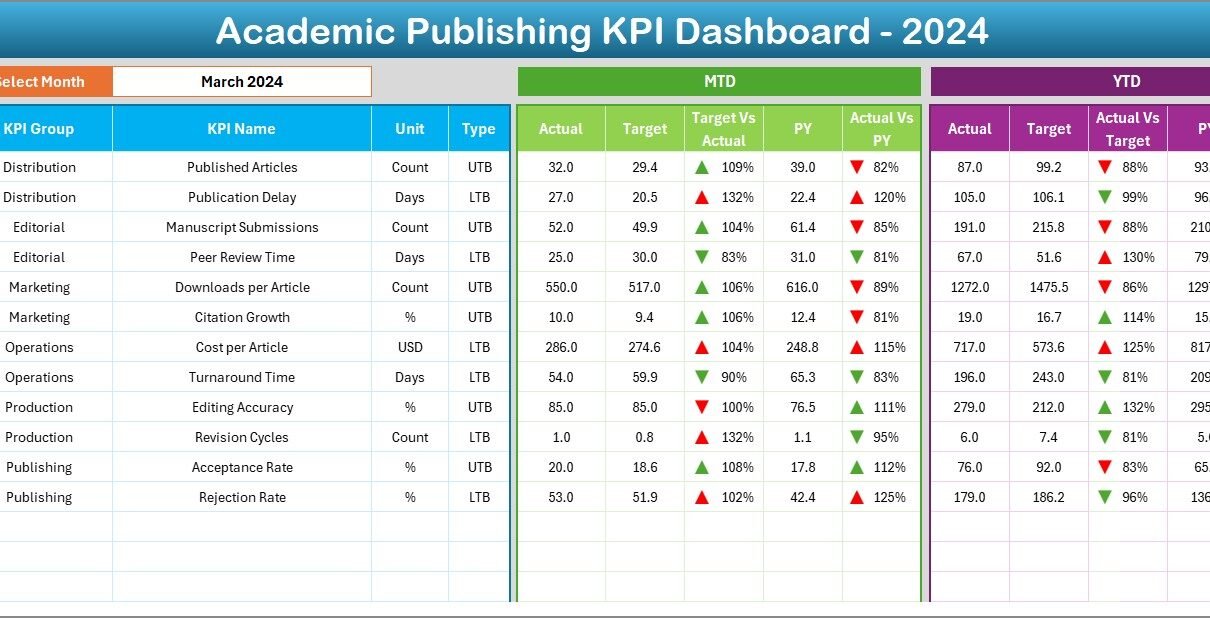
Academic Publishing KPI Dashboard in Excel

December 3, 2025December 3, 2025 PKComments Off on Academic Publishing KPI Dashboard in Excel
Academic publishing requires accuracy, speed, and visibility. Editors, researchers, reviewers, and publication managers handle large volumes of data every month. They track manuscript submissions, review timelines, acceptance ratios, proofreading quality,
Read More
Dashboard

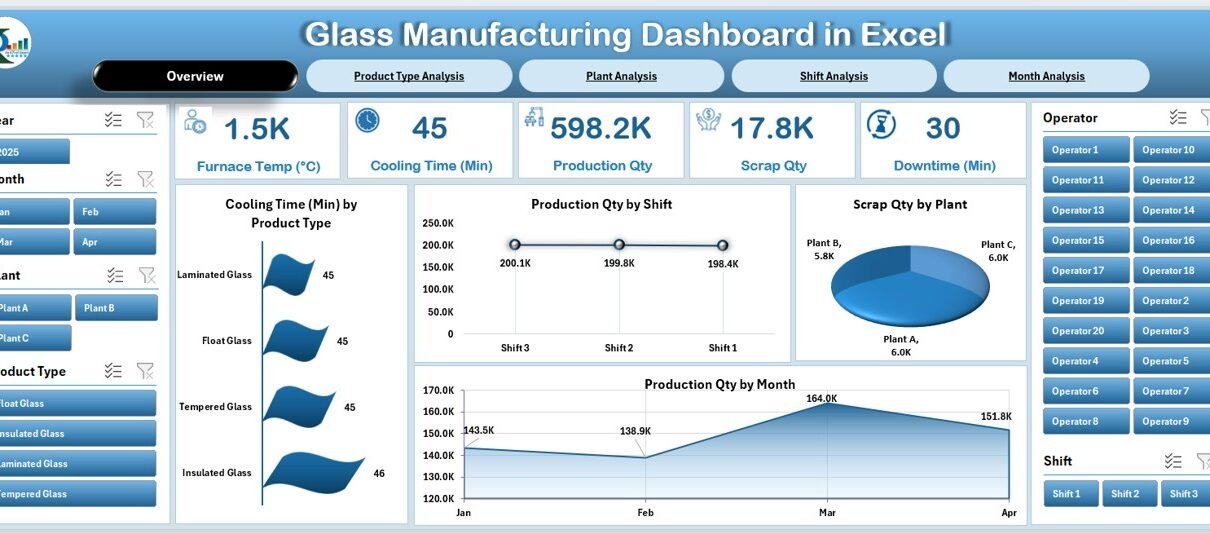
Glass Manufacturing Dashboard in Excel

December 2, 2025December 2, 2025 PKComments Off on Glass Manufacturing Dashboard in Excel
Glass manufacturing involves a long list of processes. Every stage matters—from melting and forming to cooling, cutting, and packing. Because each step affects quality, efficiency, safety, and cost, manufacturers need
Read More
Dashboard

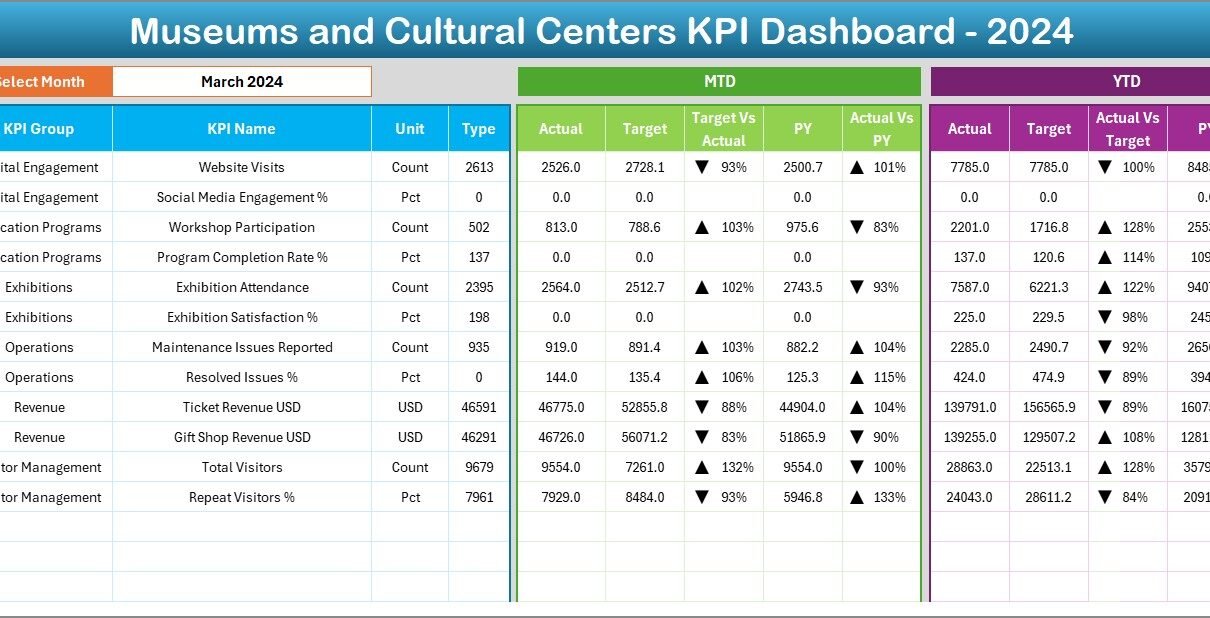
Museums and Cultural Centres KPI Dashboard in Excel

December 2, 2025December 2, 2025 PKComments Off on Museums and Cultural Centres KPI Dashboard in Excel
Museums and cultural centres play a vital role in preserving heritage, promoting education, and enriching communities. However, managing a museum requires more than exhibitions and ticketing. Teams must track visitor
Read More
Dashboard

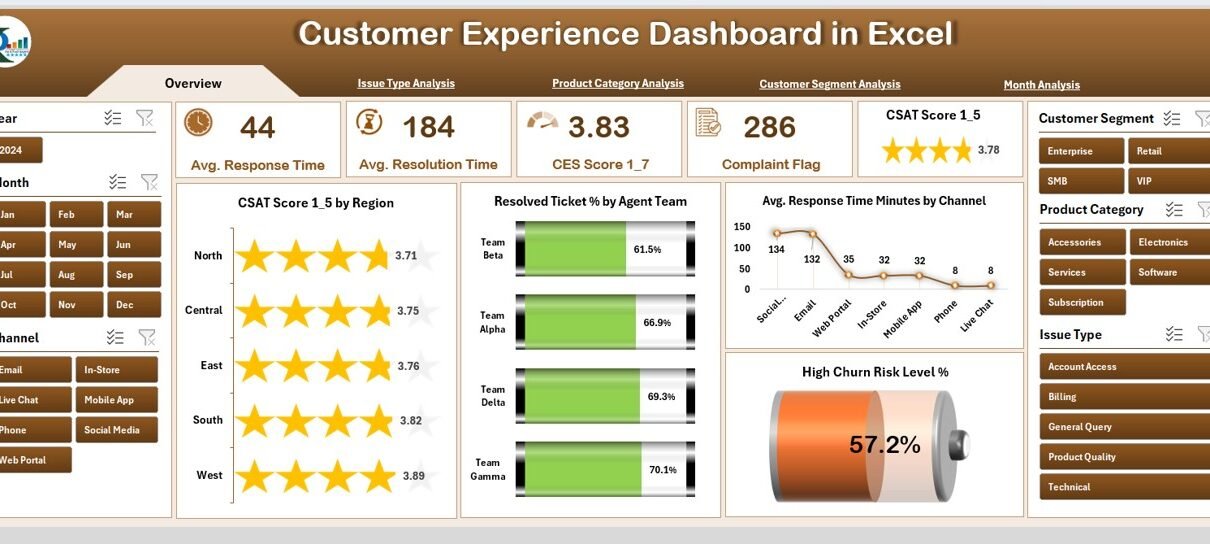
Customer Experience Dashboard in Excel

December 1, 2025December 1, 2025 PKComments Off on Customer Experience Dashboard in Excel
Customer experience plays the most important role in defining the success of any business. When customers enjoy smooth service, fast response times, and helpful support, they stay loyal for a
Read More
Dashboard

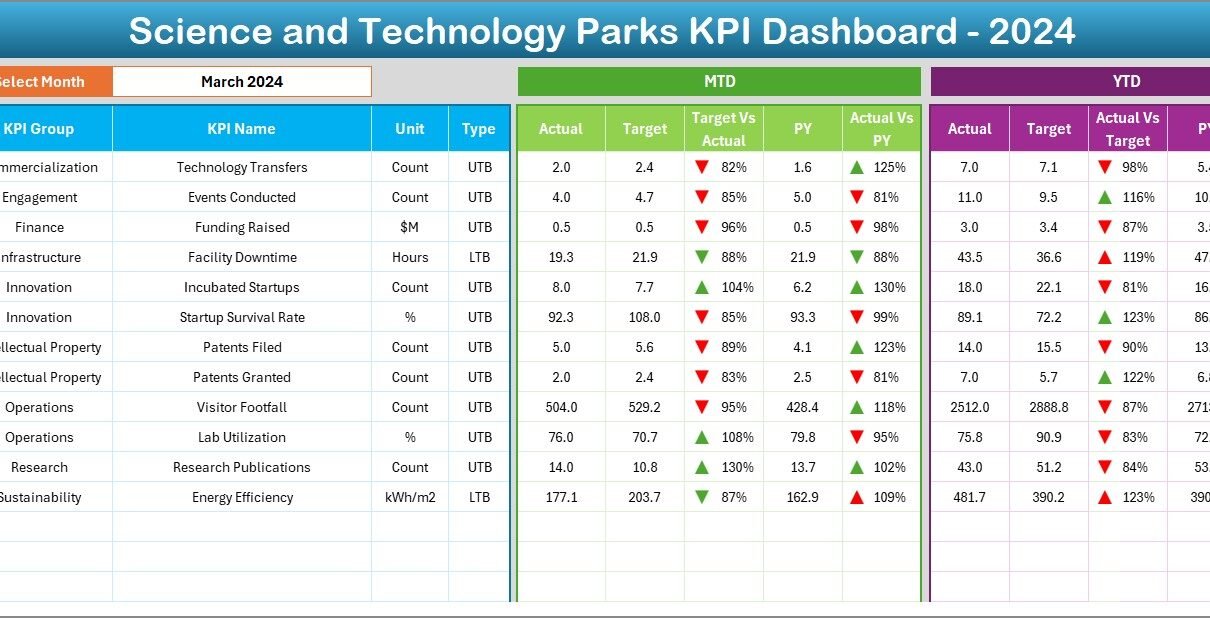
Science and Technology Parks KPI Dashboard in Excel

December 1, 2025December 1, 2025 PKComments Off on Science and Technology Parks KPI Dashboard in Excel
Science and Technology Parks (STPs) play a major role in innovation, research, incubation, industry collaboration, and economic development. These parks support startups, research projects, technology transfer, and industrial growth. Because
Read More
Templates

Car Rental Services KPI Dashboard in Excel

November 30, 2025November 30, 2025 PKComments Off on Car Rental Services KPI Dashboard in Excel
Running a car rental business requires speed, accuracy, and strong control over daily operations. Every booking, every vehicle, every customer interaction, and every expense affects the performance of the business.
Read More
Dashboard

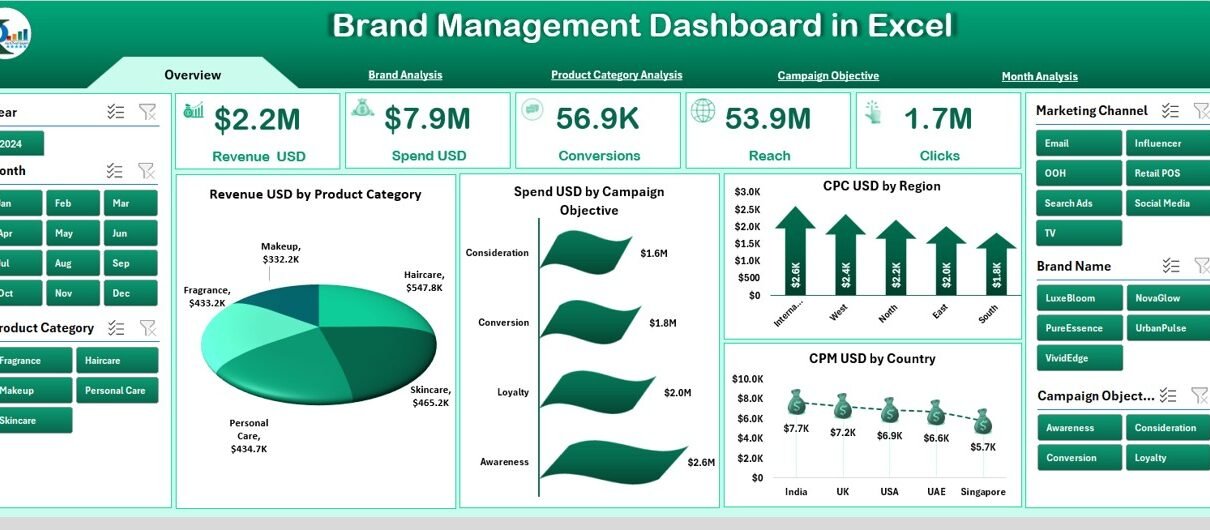
Brand Management Dashboard in Excel

November 29, 2025November 29, 2025 PKComments Off on Brand Management Dashboard in Excel
Managing a brand becomes easier when you track the right data at the right time. Companies run ads, launch campaigns, promote products, and build brand awareness every day. However, teams
Read More
Dashboard

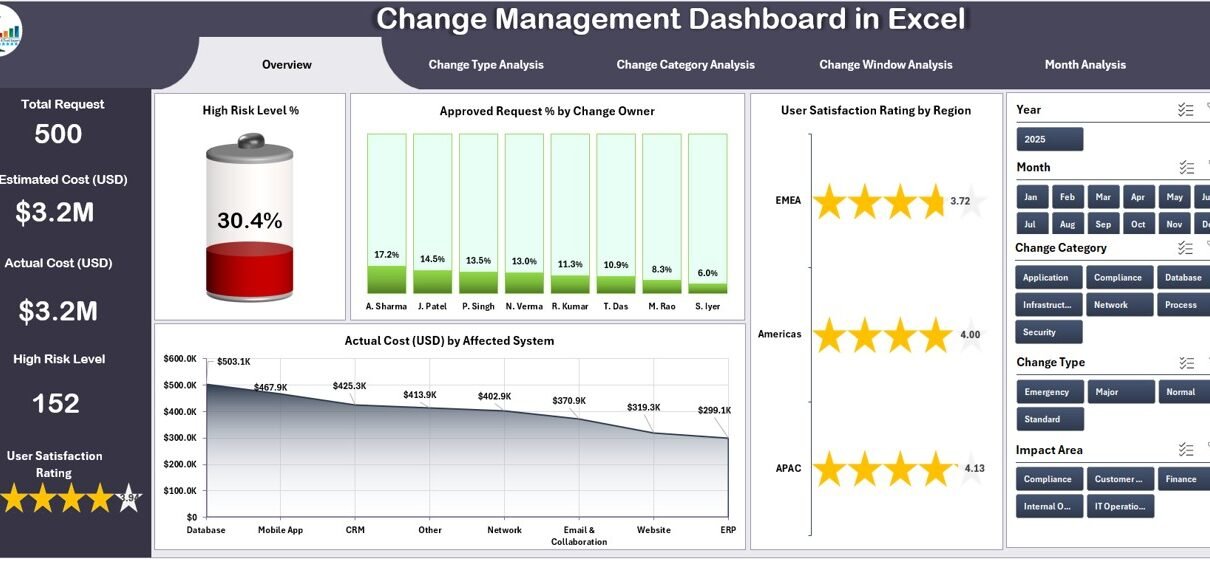
Change Management Dashboard in Excel

November 29, 2025November 29, 2025 PKComments Off on Change Management Dashboard in Excel
Organizations go through change all the time. New systems, fresh processes, policy updates, technology upgrades, and team restructuring happen in every industry. Yet, leaders struggle when they track these changes
Read More
Dashboard

Research & Development Institutes KPI Dashboard in Excel

November 29, 2025November 29, 2025 PKComments Off on Research & Development Institutes KPI Dashboard in Excel
Research and Development (R&D) plays a key role in innovation, scientific growth, and industry advancement. However, research institutes often struggle to measure their performance clearly. Teams manage several projects, experiments,
Read More
Templates

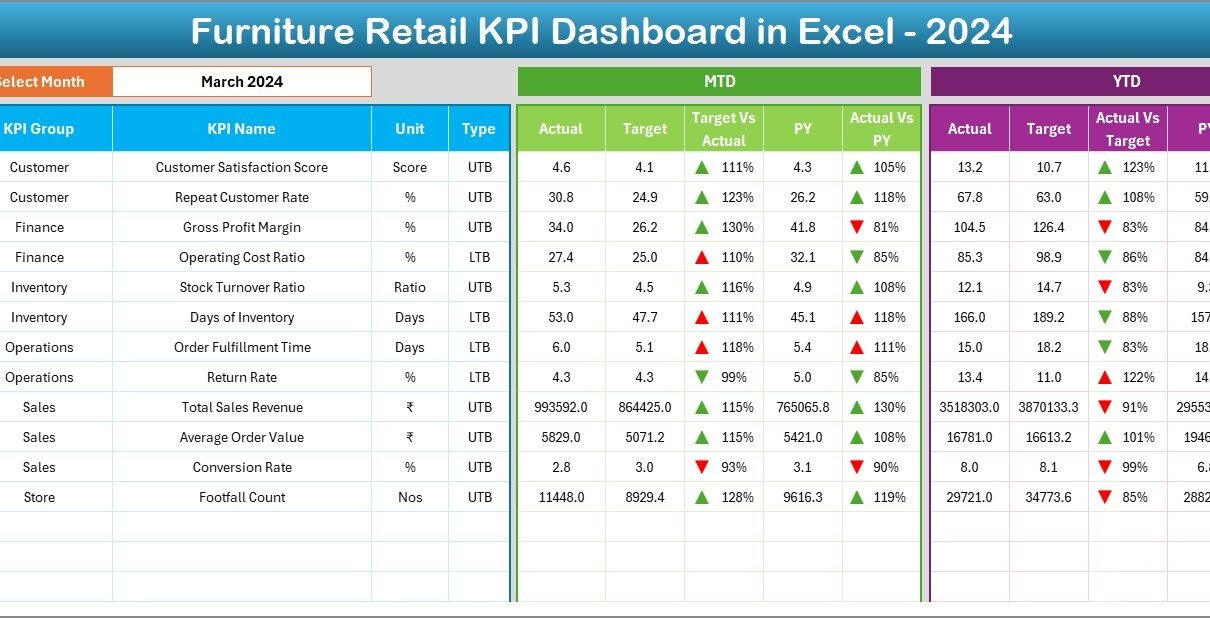
Furniture Retail KPI Dashboard in Excel

November 27, 2025November 27, 2025 PKComments Off on Furniture Retail KPI Dashboard in Excel
Running a furniture retail business becomes easier when you track the right numbers. Every day, store owners deal with sales volume, customer footfall, inventory turns, delivery issues, returns, and customer
Read More

Posts pagination

Previous 1 … 31 32 33 … 44 Next
  • Learn Excel (Free Course)
    • 1. Shortcut Keys
    • 2. Fill & Flash Fill
    • 3. Find & Replace
    • 4. Sort & Filter
    • 5. Formulas & Functions
    • 6. Data Validation
    • 7. Conditional Formatting
    • 8. Basic Charts
    • 9. Advanced Charts
    • 10. Pivot Tables
    • 11. Excel Dashboards
    • 12. VBA Course
    • 13. Excel Formulas with AI
  • Templates
  • Tutorials
    • Charts and Visualization
    • VBA
    • Excel Tips and Tricks
    • Excel Dashboards
    • Power Pivot & DAX
  • Power BI
  • Template Store
    • Ready to Use Templates
  • Courses
  • Academy
    • Excel + AI Mastery: 100 Formulas
    • Excel Pivot Tables & Dashboards
  • About Us
  • Contact Us
Copyright © 2023 PK-AnExcelExpert.com - Privacy Policy