New: NextGenTemplates Academy - video courses on Excel formulas with AI and Pivot Tables & dashboards. Early-bird: 20% off with code EARLYBIRD20 - first 20 orders only.See the courses →
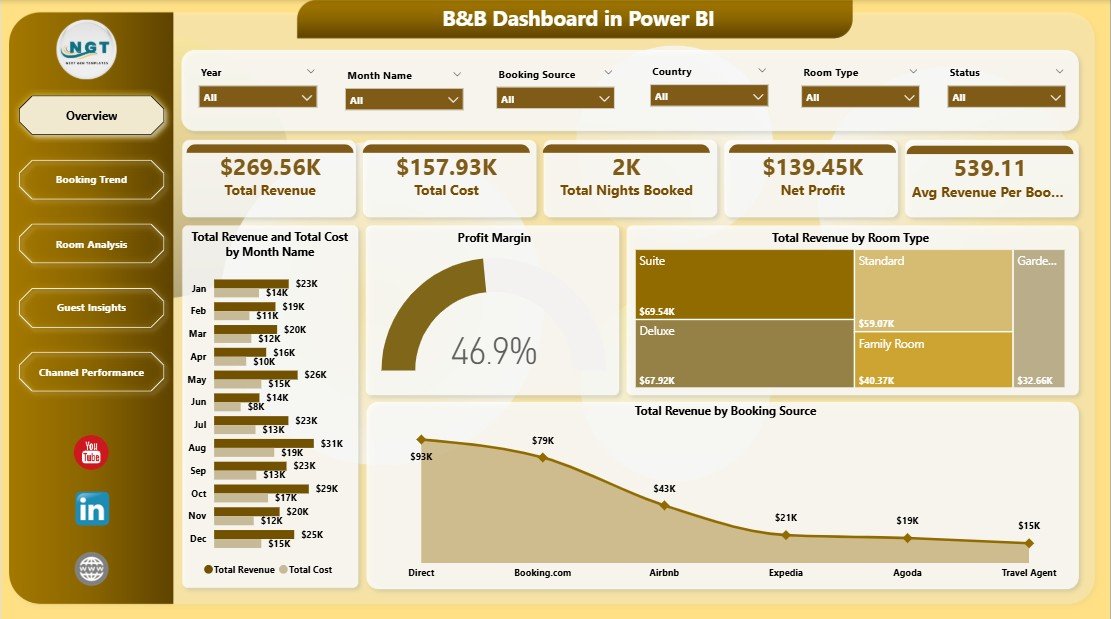
The B&B Dashboard in Power BI tracks 5 high-level KPIs and 13 visuals across 5 interactive report pages, with multiple slicers for booking source, room type, guest type, country, and
PKComments Off on Hotel Chains KPI Dashboard in Power BI
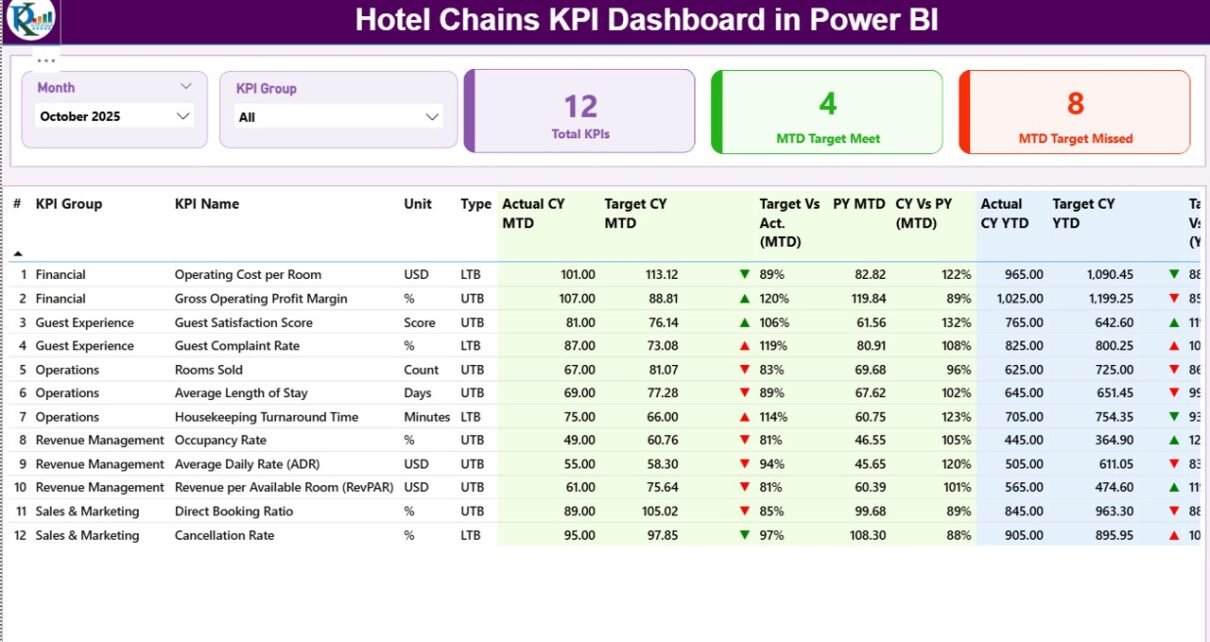
Running a hotel chain never feels simple. You manage occupancy, revenue, guest satisfaction, staff productivity, and operating costs—often across multiple properties. However, when data sits in scattered Excel files or