Running a hotel chain never feels simple. You manage occupancy, revenue, guest satisfaction, staff productivity, and operating costs—often across multiple properties. However, when data sits in scattered Excel files or static reports, leaders struggle to see the full picture. As a result, decisions slow down, and opportunities slip away.
That is exactly where a Hotel Chains KPI Dashboard in Microsoft Power BI delivers real value.
This detailed guide explains what a Hotel Chains KPI Dashboard in Power BI is, how it works, its pages, key features, advantages, best practices, and FAQs. By the end, you will clearly understand how hotel groups can monitor KPIs, compare performance, and drive consistent growth using one interactive dashboard.
Click to Purchases Hotel Chains KPI Dashboard in Power BI
What Is a Hotel Chains KPI Dashboard in Power BI?
A Hotel Chains KPI Dashboard in Power BI is a ready-to-use, interactive analytics solution designed specifically for hotel groups and hospitality businesses.
Instead of reviewing raw Excel rows or manually preparing monthly presentations, hotel leaders can:
Track Month-to-Date (MTD) and Year-to-Date (YTD) performance
Compare Actual vs Target vs Previous Year results
Instantly identify target met and target missed KPIs
Analyze trends across departments and properties
Because the dashboard uses Microsoft Excel as its data source, teams can update numbers easily without complex systems or coding.
Why Do Hotel Chains Need a KPI Dashboard in Power BI?
Hotel chains generate massive amounts of operational and financial data. However, without a structured dashboard, data stays underused.
Common Challenges Hotel Chains Face
Multiple Excel files for different properties
Manual KPI calculations every month
No real-time visibility into performance
Delayed decision-making
Difficulty comparing current year vs previous year
However, a centralized Power BI dashboard solves these problems by converting raw data into clear, visual, and actionable insights.
How Does the Hotel Chains KPI Dashboard in Power BI Work?
The dashboard follows a simple and structured workflow:
Hotel teams update KPI data in Excel
Power BI refreshes visuals automatically
Users analyze KPIs using slicers, icons, and trend charts
Management makes faster, data-driven decisions
Because Power BI handles calculations and visuals, teams focus on analysis instead of reporting.
What Are the Key Pages in the Hotel Chains KPI Dashboard in Power BI?
This dashboard contains three powerful pages, each designed for a specific purpose.
What Is the Summary Page in the Hotel Chains KPI Dashboard?
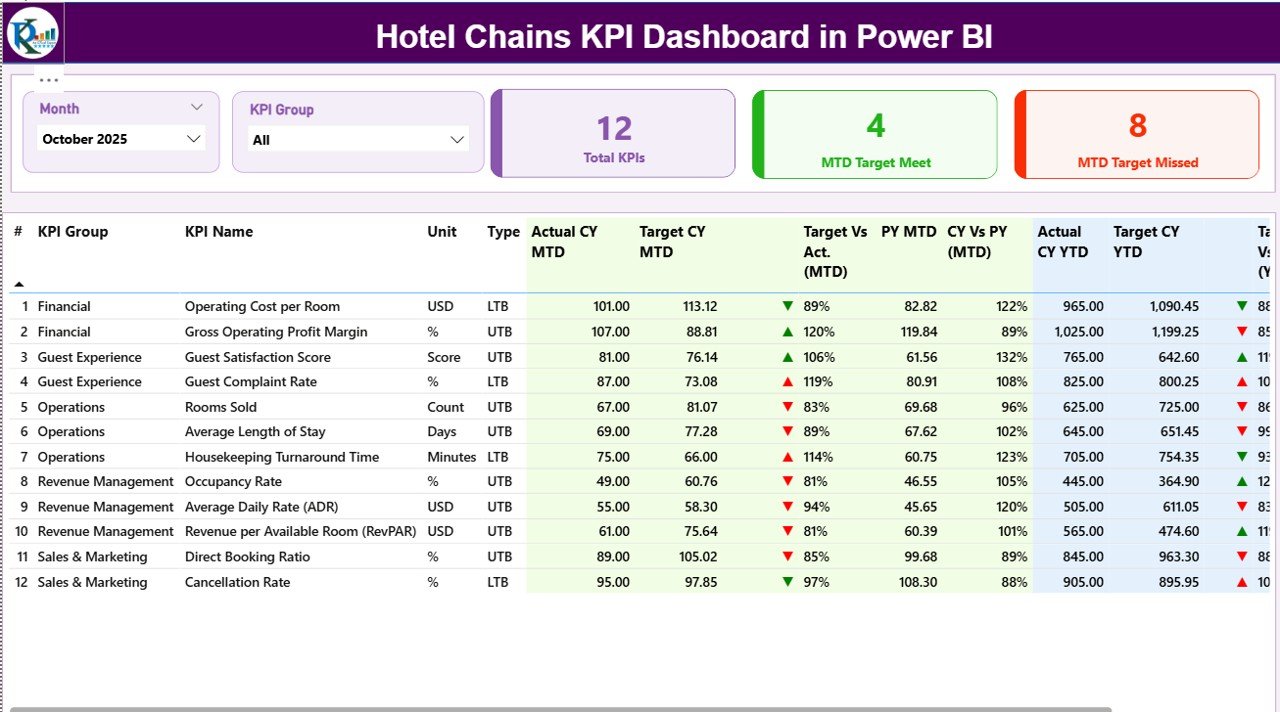
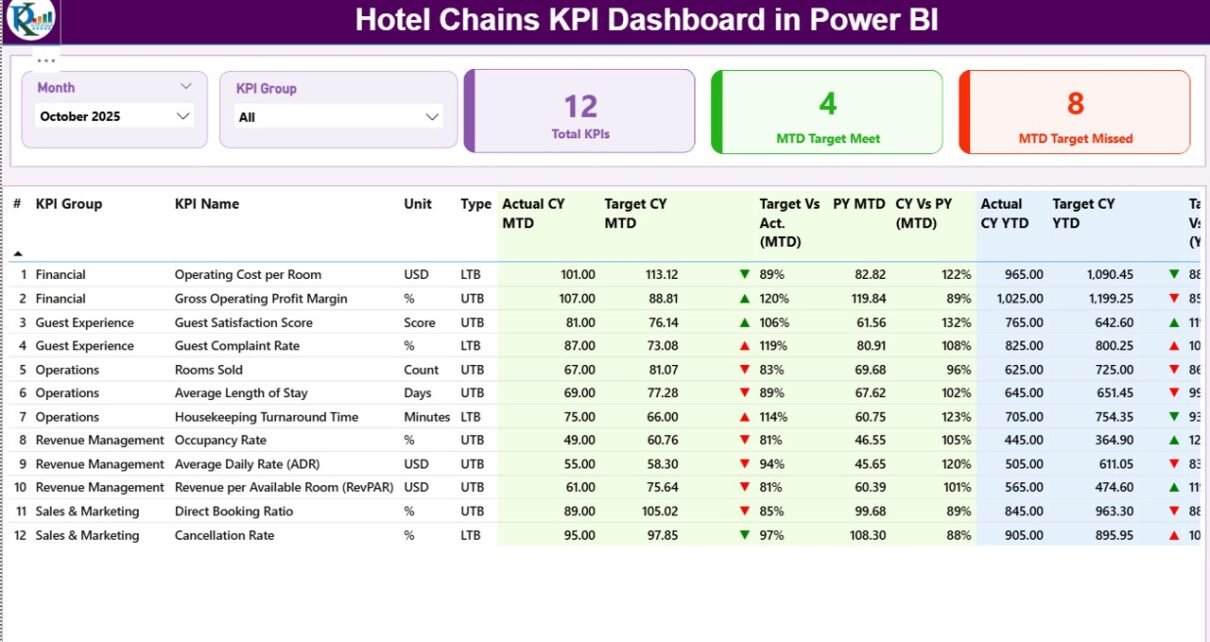
The Summary Page acts as the control center of the dashboard.
Key Elements of the Summary Page
Month Slicer to switch reporting periods instantly
KPI Group Slicer to filter KPIs by category
Three KPI Cards, showing:
Total KPIs count
MTD Target Met count
MTD Target Missed count
Because these cards sit at the top, leaders instantly understand overall performance.
Detailed KPI Table on the Summary Page
Below the cards, a detailed KPI table displays critical information:
KPI Number – Sequential identifier for each KPI
KPI Group – Category or department of the KPI
KPI Name – Name of the metric
Unit – Measurement unit (%, number, ratio, etc.)
Type – LTB (Lower the Better) or UTB (Upper the Better)
MTD Performance Metrics
Actual CY MTD – Current year actual MTD value
Target CY MTD – Current year target MTD value
MTD Icon – ▲ or ▼ with green/red color for status
Target vs Actual (MTD) – Actual ÷ Target (%)
PY MTD – Previous year MTD value
CY vs PY (MTD) – CY MTD ÷ PY MTD (%)
YTD Performance Metrics
Actual CY YTD – Current year actual YTD value
Target CY YTD – Current year target YTD value
YTD Icon – ▲ or ▼ status indicator
Target vs Actual (YTD) – Actual ÷ Target (%)
PY YTD – Previous year YTD value
CY vs PY (YTD) – CY YTD ÷ PY YTD (%)
Because icons and percentages appear together, users spot issues instantly.
How Does the KPI Trend Page Help Hotel Chains?
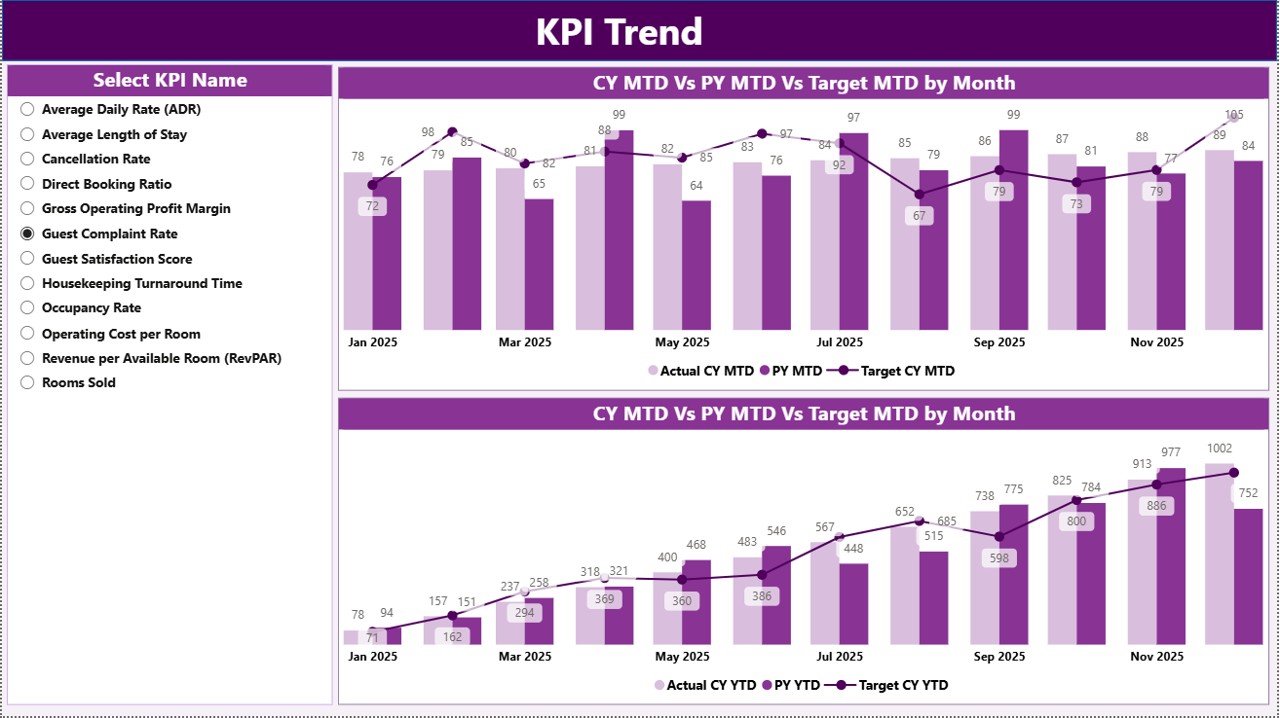
The KPI Trend Page focuses on performance movement over time.
Key Features of the KPI Trend Page
Two Combo Charts:
MTD trend: Actual CY, PY, and Target
YTD trend: Actual CY, PY, and Target
KPI Name Slicer on the left to select any KPI
Because trends reveal patterns, hotel managers can identify seasonality, growth, or decline quickly.
Click to Purchases Hotel Chains KPI Dashboard in Power BI
What Is the KPI Definition Page and Why Is It Important?
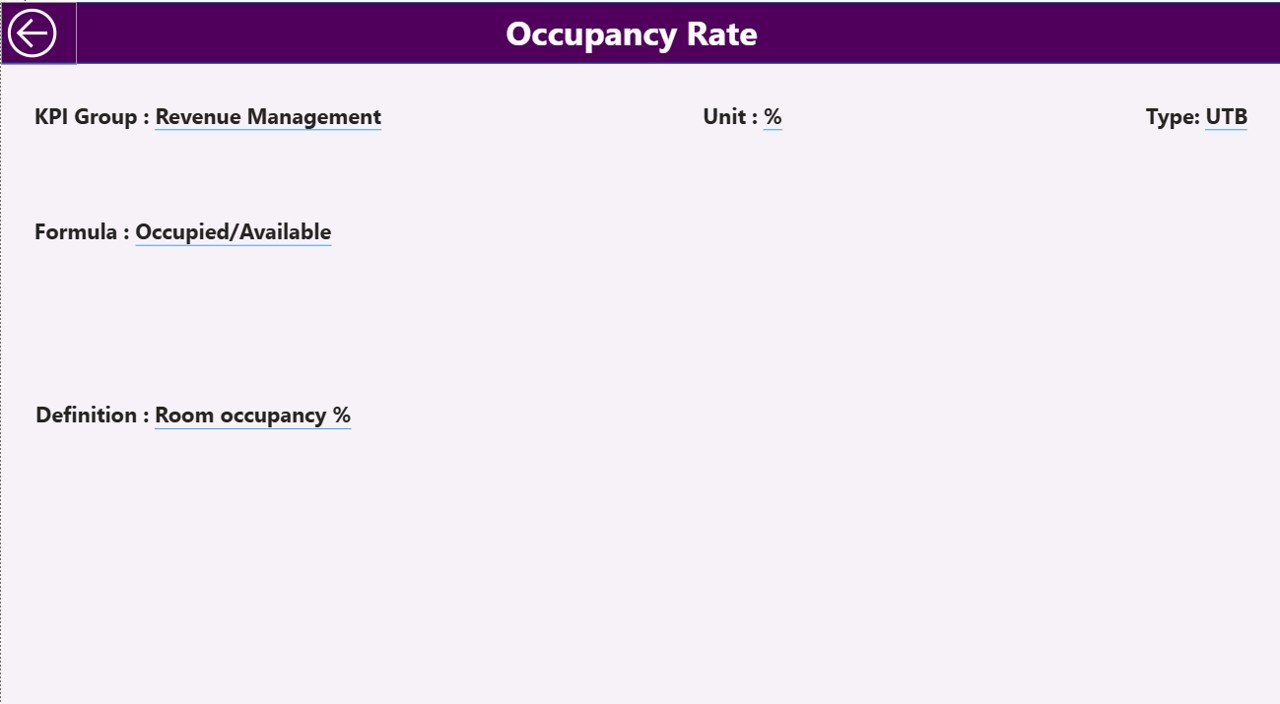
The KPI Definition Page ensures clarity and consistency.
Key Highlights
Hidden drill-through page
Accessible directly from the Summary Page
Displays:
KPI Formula
KPI Definition
KPI Type (LTB or UTB)
To return to the Summary Page, users simply click the Back button at the top-left corner.
As a result, teams avoid confusion and maintain standardized KPI understanding across properties.
What Excel Data Is Required for the Hotel Chains KPI Dashboard?
The dashboard uses an Excel file with three structured worksheets.
What Is the Input_Actual Sheet?
In the Input_Actual sheet, users enter:
KPI Name
Month (first date of the month)
MTD Actual value
YTD Actual value
Because the format stays consistent, Power BI refreshes smoothly.
What Is the Input_Target Sheet?
In the Input_Target sheet, users fill:
KPI Name
Month (first date of the month)
MTD Target value
YTD Target value
This structure allows accurate Actual vs Target comparisons.
What Is the KPI Definition Sheet?
Click to Purchases Hotel Chains KPI Dashboard in Power BI
The KPI Definition sheet stores master KPI details:
KPI Number
KPI Group
KPI Name
Unit
Formula
Definition
Type (LTB or UTB)
Because definitions live in one place, governance becomes easier.
Advantages of Hotel Chains KPI Dashboard in Power BI
A Hotel Chains KPI Dashboard in Power BI delivers multiple benefits for hotel groups.
Key Advantages
Centralized Performance Tracking across all KPIs
Faster Decision-Making with real-time visuals
Clear Target Monitoring using icons and percentages
Trend Visibility for MTD and YTD performance
Easy Excel-Based Data Entry without complex systems
Scalable Design for single or multi-property chains
As a result, leadership teams stay proactive instead of reactive.
How Does This Dashboard Improve Hotel Management Decisions?
Because the dashboard highlights target gaps and trends, managers can:
Adjust pricing strategies
Improve operational efficiency
Allocate staff more effectively
Identify underperforming departments
Track improvements month after month
Therefore, data-driven decisions replace guesswork.
Best Practices for the Hotel Chains KPI Dashboard in Power BI
To get maximum value, hotel chains should follow these best practices.
Best Practices
Update Excel data monthly without delay
Keep KPI definitions short and clear
Use consistent units and formats
Review both MTD and YTD views regularly
Focus on exception KPIs with red indicators
Train managers to interpret icons and trends
Avoid adding too many KPIs at once
By following these practices, teams maintain accuracy and clarity.
Who Should Use a Hotel Chains KPI Dashboard in Power BI?
This dashboard suits a wide range of hospitality roles:
Hotel chain owners
General managers
Operations managers
Revenue and finance teams
Corporate leadership teams
Because the design stays intuitive, both technical and non-technical users benefit.
How Is Power BI Better Than Static Excel Reports for Hotel Chains?
While Excel reports work well for data entry, Power BI adds:
Interactive slicers
Automated calculations
Visual trend analysis
Drill-through capabilities
Therefore, Power BI transforms Excel data into executive-ready insights.
Conclusion: Why Should Hotel Chains Adopt a KPI Dashboard in Power BI?
A Hotel Chains KPI Dashboard in Power BI helps hospitality businesses track performance, control costs, and improve guest experiences—all from one place.
Instead of wasting time on manual reports, hotel leaders gain instant visibility into what works and what needs attention. Because the dashboard connects directly to Excel, teams update data easily while Power BI handles the analytics.
In short, this dashboard turns hotel data into clarity, confidence, and control.
Frequently Asked Questions About Hotel Chains KPI Dashboard in Power BI
What is a Hotel Chains KPI Dashboard in Power BI used for?
It tracks hotel KPIs, compares actual vs target performance, and analyzes MTD and YTD trends in one interactive dashboard.
Can hotel teams update data without Power BI expertise?
Yes. Teams only update Excel sheets, and Power BI refreshes visuals automatically.
Does this dashboard support multiple KPIs?
Yes. It supports multiple KPI groups and metrics with slicers for easy filtering.
How often should hotel chains update the dashboard?
Hotel chains should update data monthly or more frequently if needed.
Can this dashboard scale for multiple properties?
Yes. The structure supports single hotels and multi-property chains.
Why should hotel chains prefer Power BI over manual reports?
Power BI provides faster insights, visual clarity, and automated analysis compared to static reports.
Visit our YouTube channel to learn step-by-step video tutorials