New: NextGenTemplates Academy - video courses on Excel formulas with AI and Pivot Tables & dashboards. Early-bird: 20% off with code EARLYBIRD20 - first 20 orders only. See the courses →
  • Learn Excel (Free Course)
    • 1. Shortcut Keys
    • 2. Fill & Flash Fill
    • 3. Find & Replace
    • 4. Sort & Filter
    • 5. Formulas & Functions
    • 6. Data Validation
    • 7. Conditional Formatting
    • 8. Basic Charts
    • 9. Advanced Charts
    • 10. Pivot Tables
    • 11. Excel Dashboards
    • 12. VBA Course
    • 13. Excel Formulas with AI
  • Templates
  • Tutorials
    • Charts and Visualization
    • VBA
    • Excel Tips and Tricks
    • Excel Dashboards
    • Power Pivot & DAX
  • Power BI
  • Template Store
    • Ready to Use Templates
  • Courses
  • Academy
    • Excel + AI Mastery: 100 Formulas
    • Excel Pivot Tables & Dashboards
  • About Us
  • Contact Us

PK: An Excel Expert

Transforming Data into Decisions

Tag: NGO Dashboard Power BI

Dashboard Power BI

Disaster Relief Dashboard in Power BI

September 9, 2026September 9, 2026 PKComments Off on Disaster Relief Dashboard in Power BI
The Disaster Relief Dashboard in Power BI reports on 500 relief responses across 5 interactive pages, 25 KPI cards and 218 report visuals. The shipped sample dataset carries 19 fields
Read More
Power BI

Climate Change NGOs Dashboard in Power BI

April 1, 2026April 1, 2026 PKComments Off on Climate Change NGOs Dashboard in Power BI
Climate Change NGOs Dashboard in Power BI is a professionally designed, ready-to-use analytics solution that helps environmental organizations visualize budgets, expenditures, carbon offsets, beneficiaries, volunteers, and regional performance across their
Read More
Dashboard Power BI

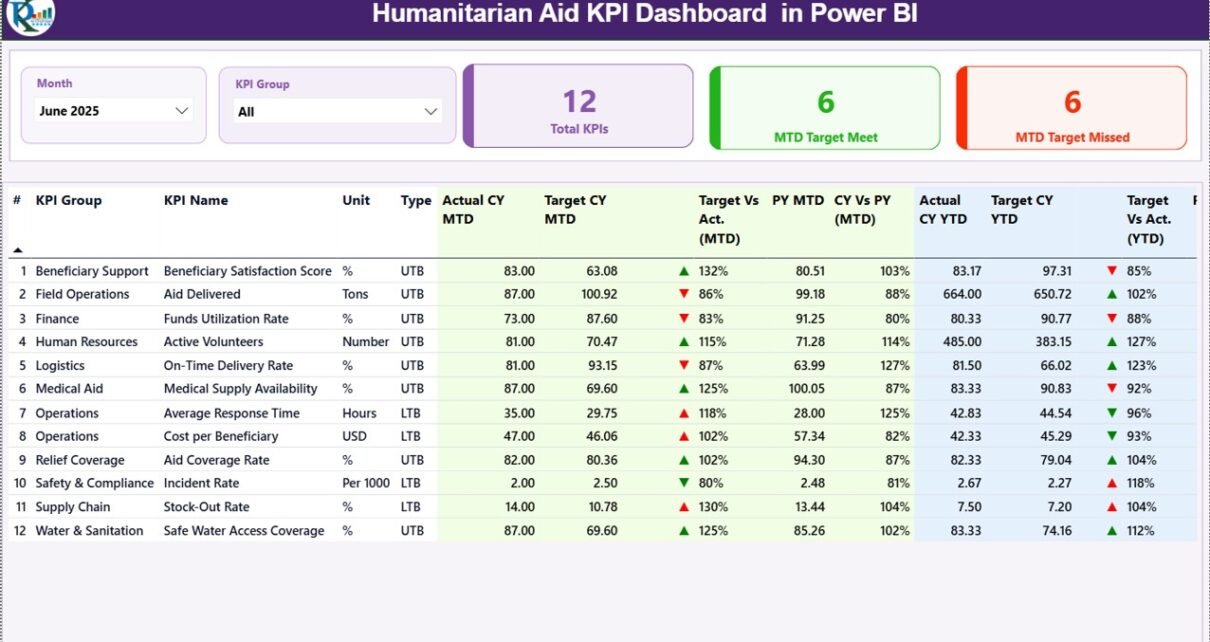
Humanitarian Aid KPI Dashboard in Power BI

February 12, 2026February 12, 2026 PKComments Off on Humanitarian Aid KPI Dashboard in Power BI
Humanitarian organizations work in high-pressure environments. They deliver food, medical supplies, shelter, education, and emergency response services across regions. However, without structured performance tracking, leaders struggle to measure real impact.
Read More
Dashboard Power BI

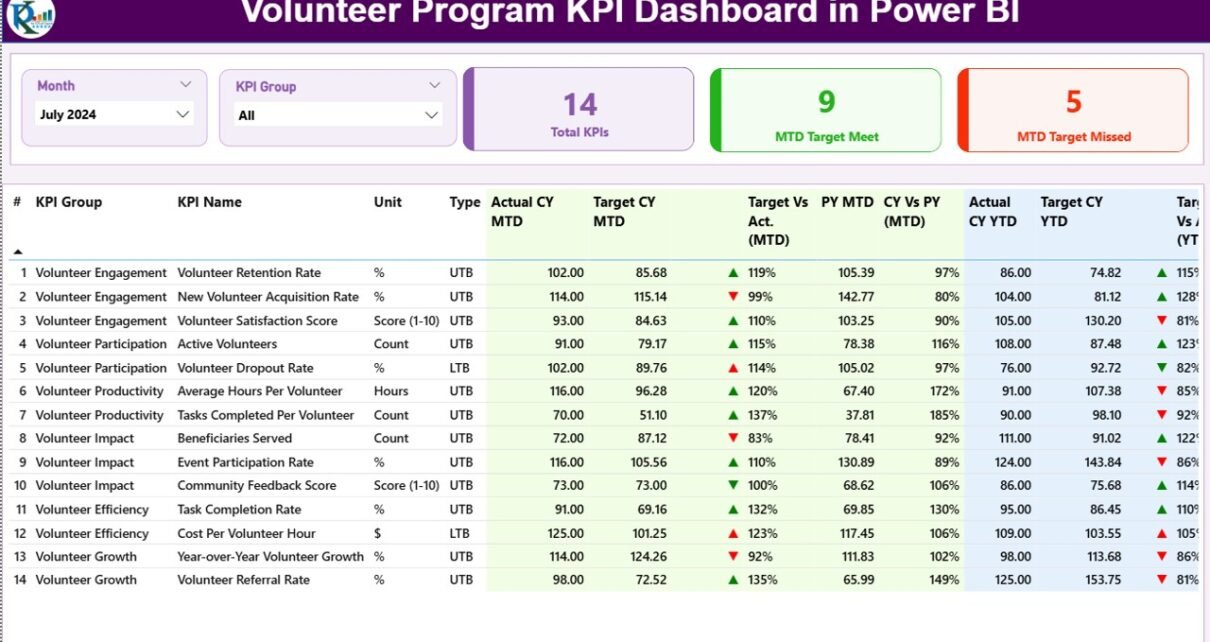
Volunteer Program KPI Dashboard in Power BI

December 14, 2025December 14, 2025 PKComments Off on Volunteer Program KPI Dashboard in Power BI
A Volunteer Program KPI Dashboard in Power BI is a ready-to-use analytical dashboard designed to track, monitor, and analyze volunteer program performance using key performance indicators (KPIs). It visually presents
Read More
  • Learn Excel (Free Course)
    • 1. Shortcut Keys
    • 2. Fill & Flash Fill
    • 3. Find & Replace
    • 4. Sort & Filter
    • 5. Formulas & Functions
    • 6. Data Validation
    • 7. Conditional Formatting
    • 8. Basic Charts
    • 9. Advanced Charts
    • 10. Pivot Tables
    • 11. Excel Dashboards
    • 12. VBA Course
    • 13. Excel Formulas with AI
  • Templates
  • Tutorials
    • Charts and Visualization
    • VBA
    • Excel Tips and Tricks
    • Excel Dashboards
    • Power Pivot & DAX
  • Power BI
  • Template Store
    • Ready to Use Templates
  • Courses
  • Academy
    • Excel + AI Mastery: 100 Formulas
    • Excel Pivot Tables & Dashboards
  • About Us
  • Contact Us
Copyright © 2023 PK-AnExcelExpert.com - Privacy Policy