New: NextGenTemplates Academy - video courses on Excel formulas with AI and Pivot Tables & dashboards. Early-bird: 20% off with code EARLYBIRD20 - first 20 orders only. See the courses →
  • Learn Excel (Free Course)
    • 1. Shortcut Keys
    • 2. Fill & Flash Fill
    • 3. Find & Replace
    • 4. Sort & Filter
    • 5. Formulas & Functions
    • 6. Data Validation
    • 7. Conditional Formatting
    • 8. Basic Charts
    • 9. Advanced Charts
    • 10. Pivot Tables
    • 11. Excel Dashboards
    • 12. VBA Course
    • 13. Excel Formulas with AI
  • Templates
  • Tutorials
    • Charts and Visualization
    • VBA
    • Excel Tips and Tricks
    • Excel Dashboards
    • Power Pivot & DAX
  • Power BI
  • Template Store
    • Ready to Use Templates
  • Courses
  • Academy
    • Excel + AI Mastery: 100 Formulas
    • Excel Pivot Tables & Dashboards
  • About Us
  • Contact Us

PK: An Excel Expert

Transforming Data into Decisions

Tag: operations dashboard

Dashboard Templates

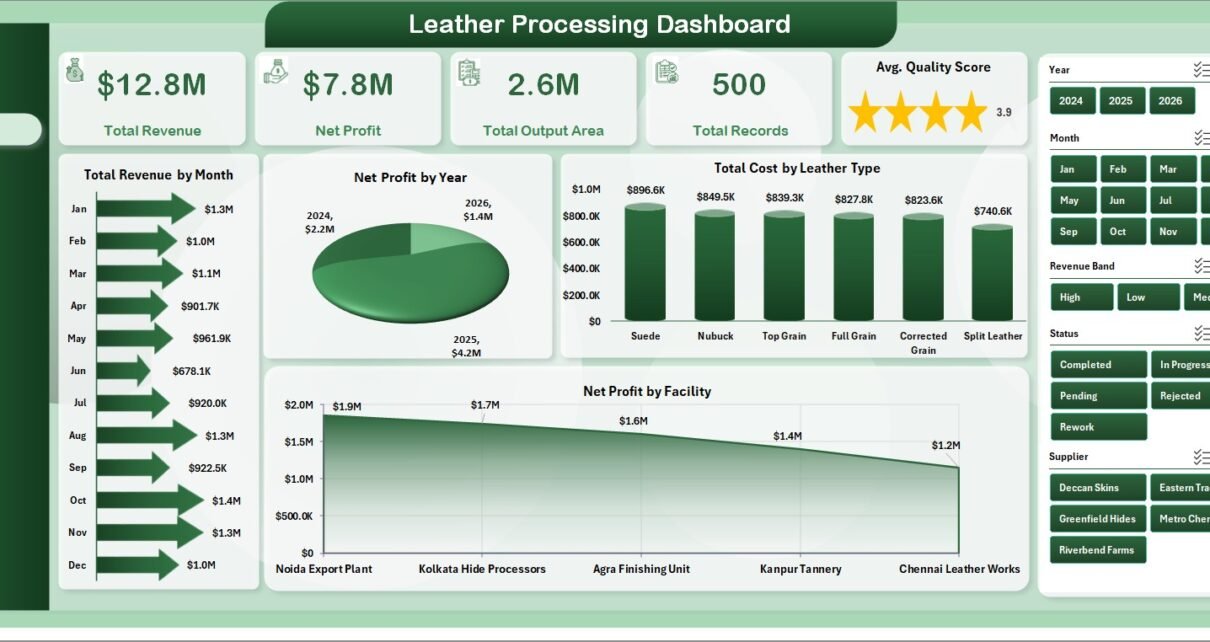
Leather Processing Dashboard in Excel

July 2, 2026July 2, 2026 PKComments Off on Leather Processing Dashboard in Excel
Leather Processing Dashboard in Excel helps leather manufacturers turn daily production, quality, costing, supplier, facility, and customer records into clear management insight. Instead of reviewing scattered sheets, this workbook brings
Read More
Dashboard

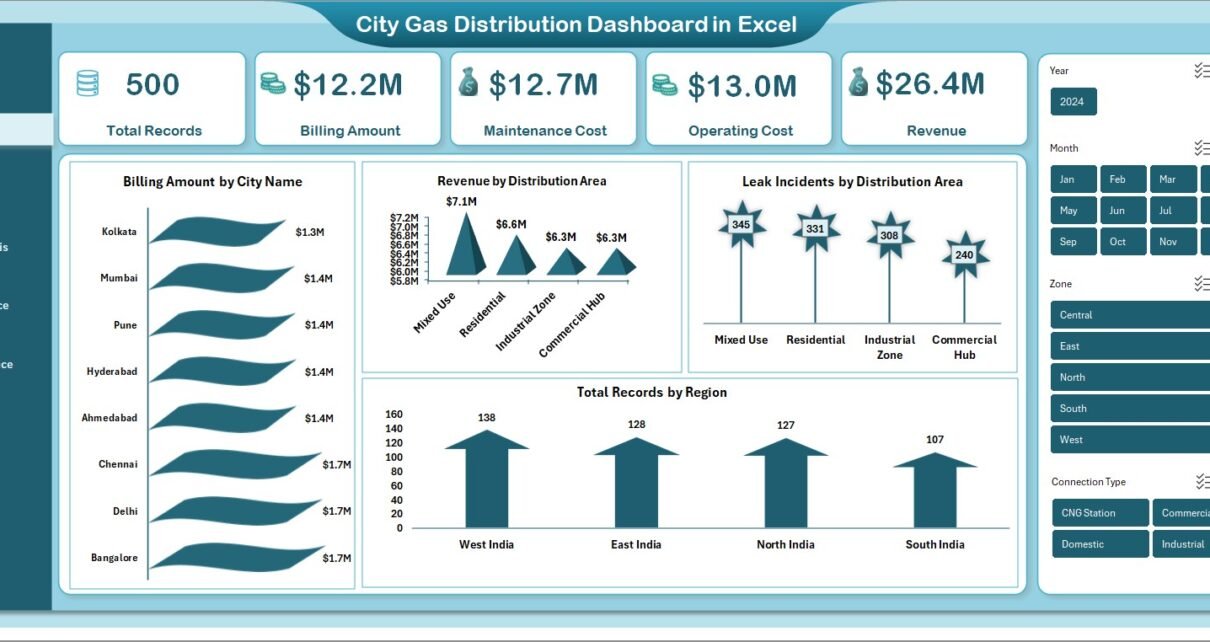
City Gas Distribution Dashboard in Excel

March 23, 2026March 23, 2026 PKComments Off on City Gas Distribution Dashboard in Excel
In today’s fast-growing urban environment, city gas distribution companies handle massive amounts of operational, financial, and safety data. However, managing this data manually becomes confusing, time-consuming, and error-prone. So, how
Read More
Power BI

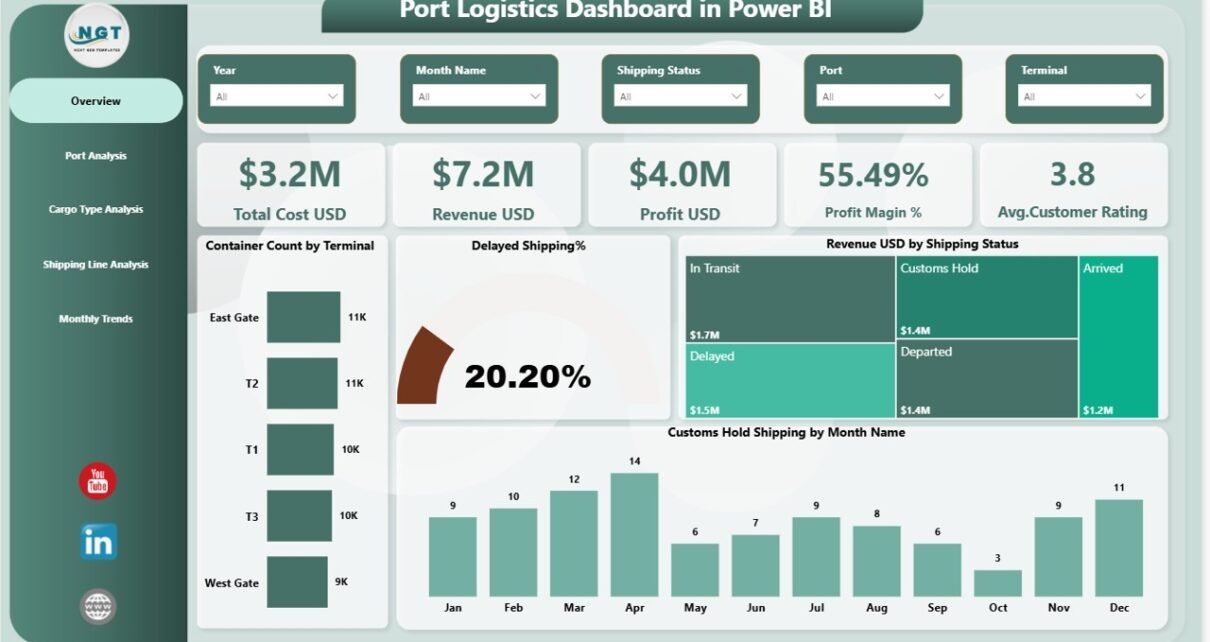
Port Logistics Dashboard in Power BI

March 20, 2026March 20, 2026 PKComments Off on Port Logistics Dashboard in Power BI
In today’s fast-paced global trade environment, ports handle massive volumes of cargo every single day. However, managing port logistics efficiently becomes challenging when data stays scattered across multiple systems. As
Read More
Dashboard Power BI

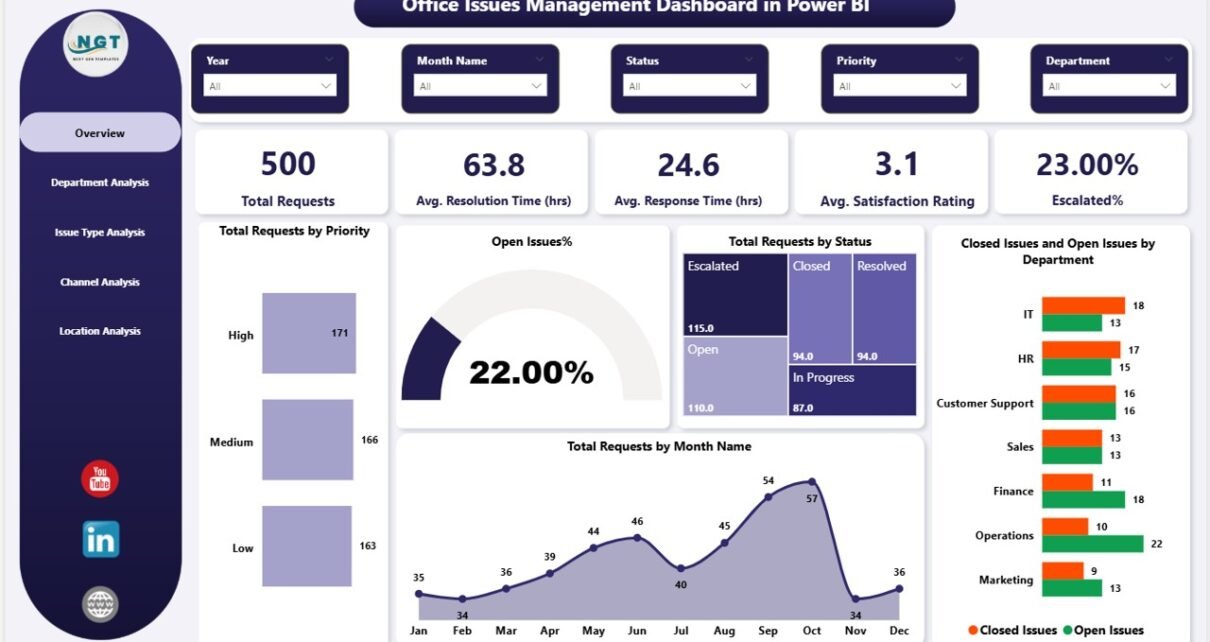
Office Issues Management Dashboard in Power BI

March 19, 2026October 10, 2026 PKComments Off on Office Issues Management Dashboard in Power BI
In today’s fast-paced office environment, managing internal issues efficiently plays a critical role in maintaining productivity and employee satisfaction. However, many organizations still rely on scattered emails, manual logs, or
Read More
Dashboard Power BI

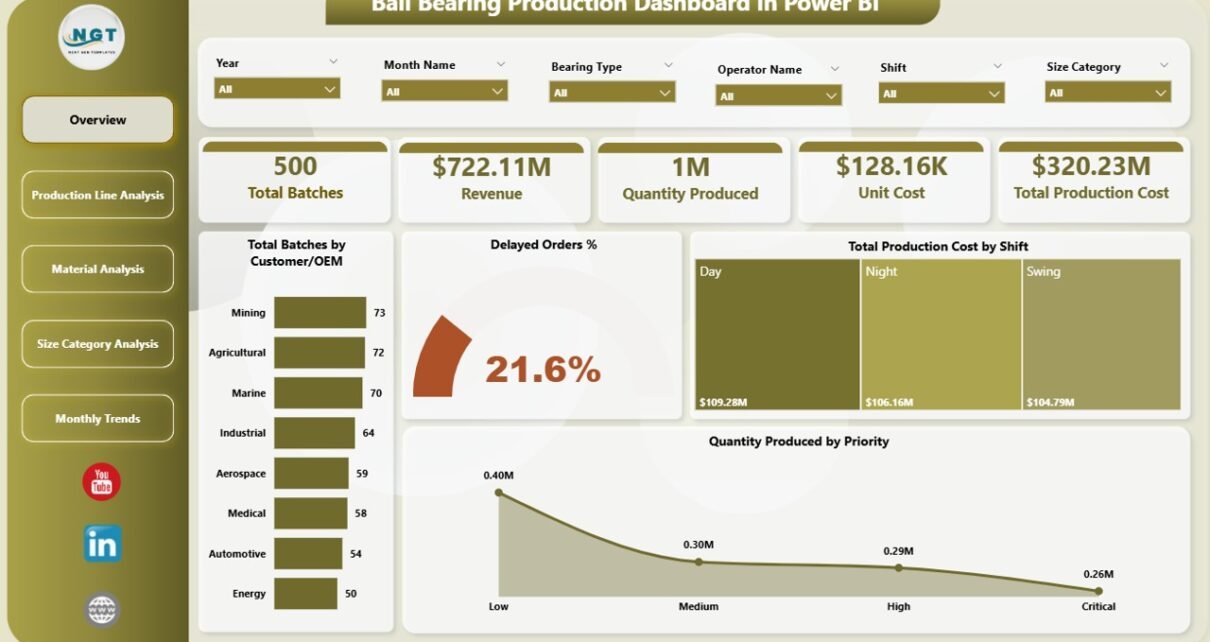
Ball Bearing Production Dashboard in Power BI

March 18, 2026March 18, 2026 PKComments Off on Ball Bearing Production Dashboard in Power BI
In today’s highly competitive manufacturing environment, companies must monitor production performance, control costs, and improve efficiency in real time. However, many ball bearing manufacturers still rely on disconnected spreadsheets and
Read More
Dashboard

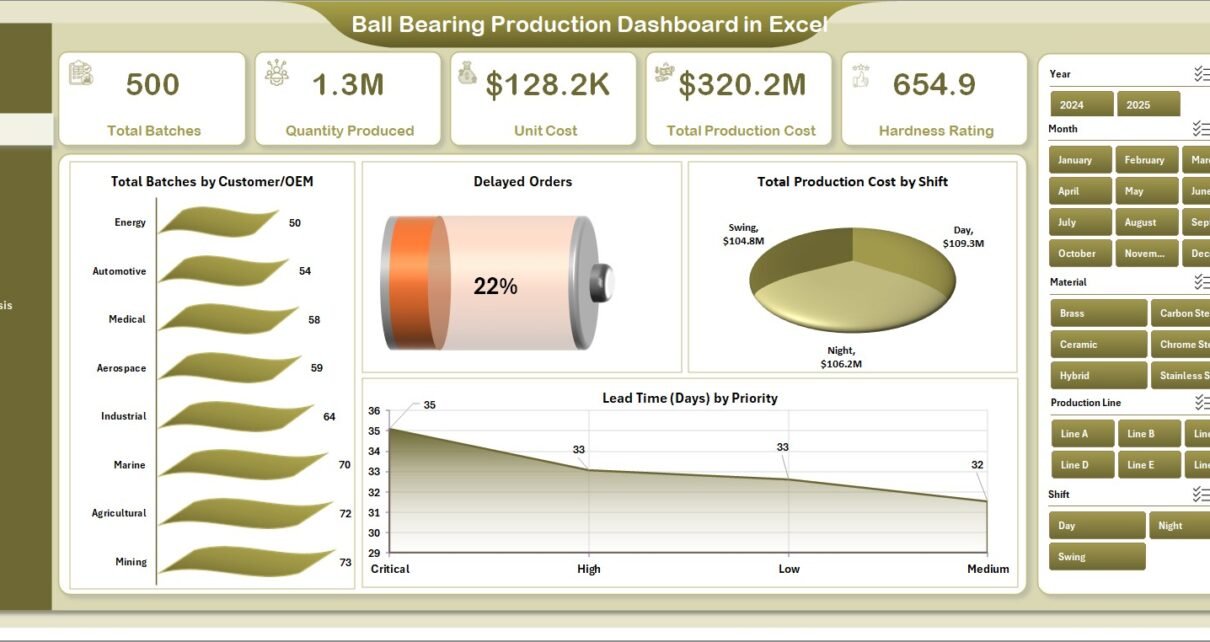
Ball Bearing Production Dashboard in Excel

March 18, 2026March 18, 2026 PKComments Off on Ball Bearing Production Dashboard in Excel
In today’s highly competitive manufacturing industry, precision and efficiency are everything. Especially in industries like automotive, heavy machinery, and industrial equipment, ball bearings play a critical role. However, managing production
Read More
Dashboard Power BI

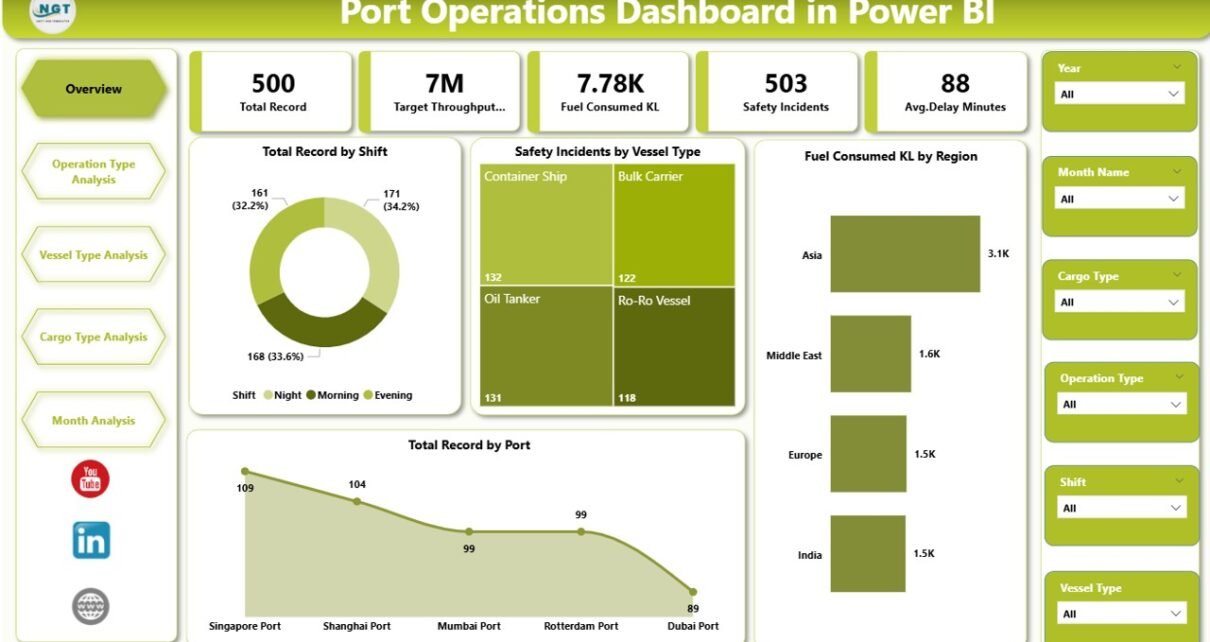
Port Operations Dashboard in Power BI

March 6, 2026March 6, 2026 PKComments Off on Port Operations Dashboard in Power BI
Modern ports handle thousands of vessel movements, cargo shipments, and logistics operations every day. Therefore, port authorities, shipping companies, and logistics managers must constantly monitor operational performance, safety metrics, fuel
Read More
Dashboard Power BI

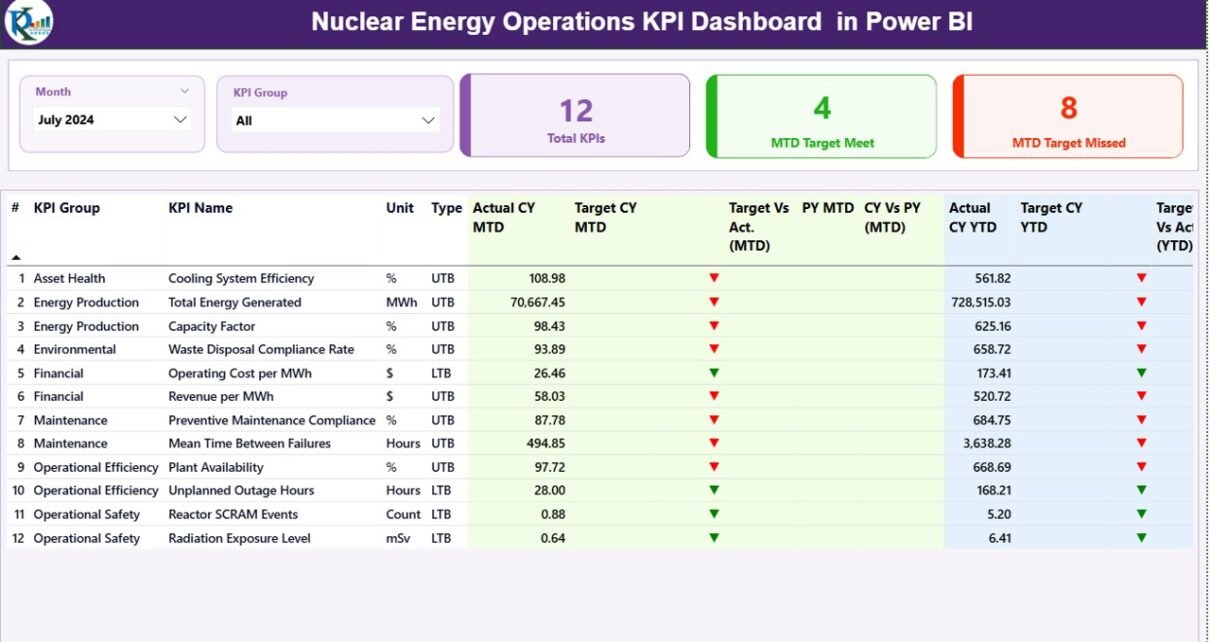
Nuclear Energy Operations KPI Dashboard in Power BI

March 3, 2026March 3, 2026 PKComments Off on Nuclear Energy Operations KPI Dashboard in Power BI
Managing nuclear energy operations requires precision, discipline, and continuous monitoring. Every decision impacts safety, regulatory compliance, plant efficiency, and financial stability. Therefore, organizations must track performance indicators in a structured
Read More
Dashboard

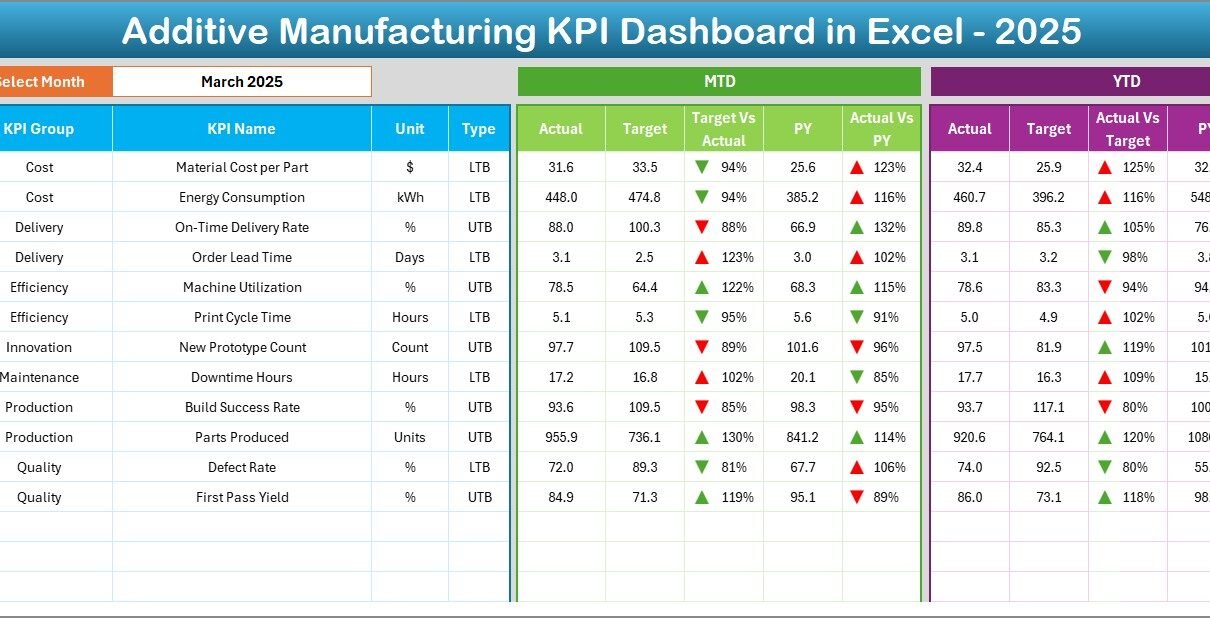
Additive Manufacturing KPI Dashboard in Excel

March 1, 2026March 1, 2026 PKComments Off on Additive Manufacturing KPI Dashboard in Excel
Additive manufacturing (AM) moves fast. One day you test a new powder batch, and the next day you rush a critical prototype to meet a deadline. Because of this speed,
Read More
Dashboard

3D Printing Manufacturing KPI Dashboard in Excel

February 28, 2026February 28, 2026 PKComments Off on 3D Printing Manufacturing KPI Dashboard in Excel
In today’s advanced manufacturing environment, 3D printing (additive manufacturing) has transformed how companies design, prototype, and produce products. Organizations now manufacture complex components faster, reduce material waste, and improve customization
Read More

Posts pagination

1 2 … 6 Next
  • Learn Excel (Free Course)
    • 1. Shortcut Keys
    • 2. Fill & Flash Fill
    • 3. Find & Replace
    • 4. Sort & Filter
    • 5. Formulas & Functions
    • 6. Data Validation
    • 7. Conditional Formatting
    • 8. Basic Charts
    • 9. Advanced Charts
    • 10. Pivot Tables
    • 11. Excel Dashboards
    • 12. VBA Course
    • 13. Excel Formulas with AI
  • Templates
  • Tutorials
    • Charts and Visualization
    • VBA
    • Excel Tips and Tricks
    • Excel Dashboards
    • Power Pivot & DAX
  • Power BI
  • Template Store
    • Ready to Use Templates
  • Courses
  • Academy
    • Excel + AI Mastery: 100 Formulas
    • Excel Pivot Tables & Dashboards
  • About Us
  • Contact Us
Copyright © 2023 PK-AnExcelExpert.com - Privacy Policy