New: NextGenTemplates Academy - video courses on Excel formulas with AI and Pivot Tables & dashboards. Early-bird: 20% off with code EARLYBIRD20 - first 20 orders only. See the courses →
  • Learn Excel (Free Course)
    • 1. Shortcut Keys
    • 2. Fill & Flash Fill
    • 3. Find & Replace
    • 4. Sort & Filter
    • 5. Formulas & Functions
    • 6. Data Validation
    • 7. Conditional Formatting
    • 8. Basic Charts
    • 9. Advanced Charts
    • 10. Pivot Tables
    • 11. Excel Dashboards
    • 12. VBA Course
    • 13. Excel Formulas with AI
  • Templates
  • Tutorials
    • Charts and Visualization
    • VBA
    • Excel Tips and Tricks
    • Excel Dashboards
    • Power Pivot & DAX
  • Power BI
  • Template Store
    • Ready to Use Templates
  • Courses
  • Academy
    • Excel + AI Mastery: 100 Formulas
    • Excel Pivot Tables & Dashboards
  • About Us
  • Contact Us

PK: An Excel Expert

Transforming Data into Decisions

Tag: operations dashboard

Dashboard Power BI

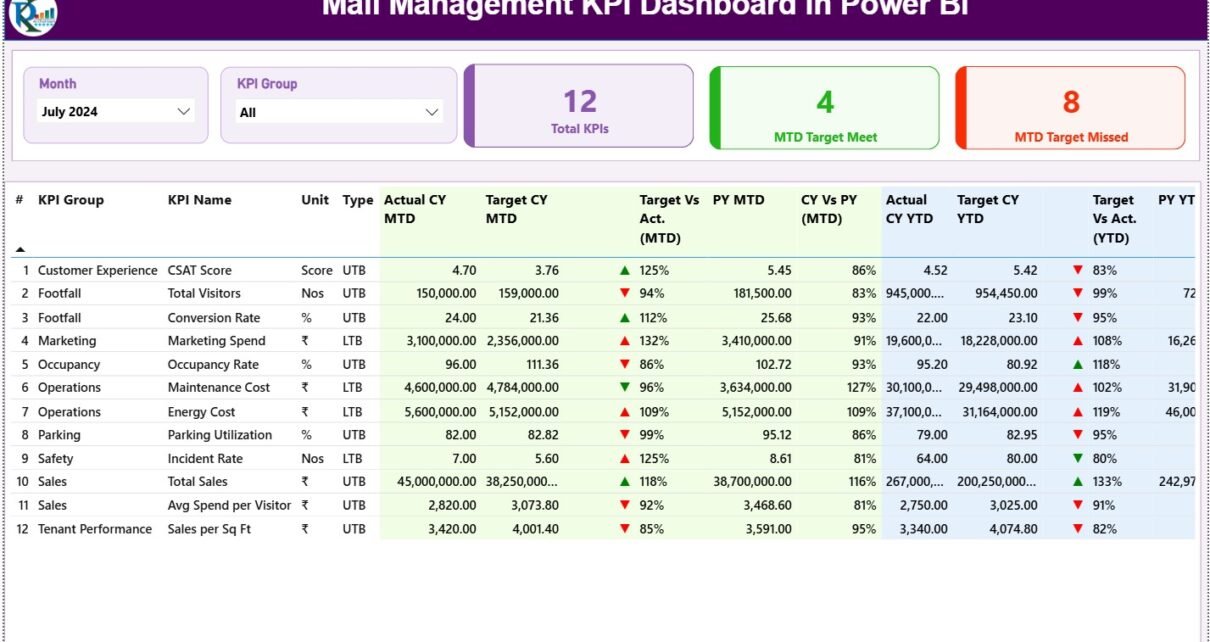
Mall Management KPI Dashboard in Power BI

December 16, 2025December 16, 2025 PKComments Off on Mall Management KPI Dashboard in Power BI
Managing a shopping mall today requires much more than leasing spaces and collecting rent. Mall managers must constantly track footfall, revenue performance, operational efficiency, tenant success, and customer experience. However,
Read More
Dashboard

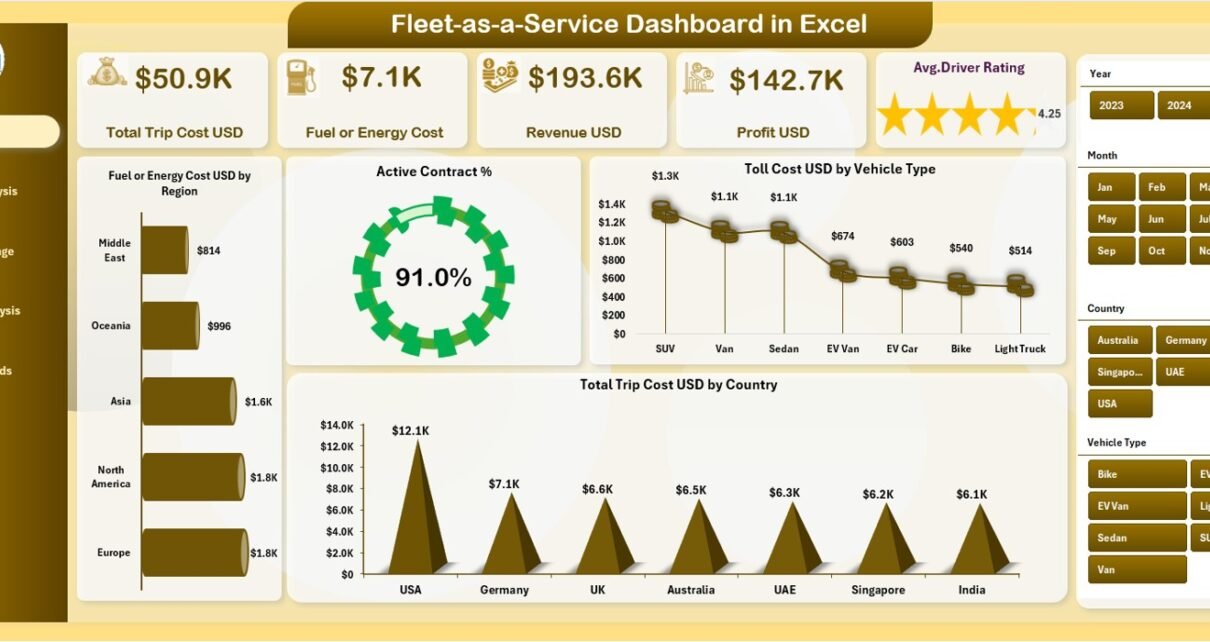
Fleet-as-a-Service Dashboard in Excel

December 8, 2025December 8, 2025 PKComments Off on Fleet-as-a-Service Dashboard in Excel
Fleet-as-a-Service (FaaS) has transformed how organizations manage transportation, mobility, and logistics. Instead of owning and maintaining large fleets, companies now focus on service-oriented fleet usage, performance, and profitability. However, without
Read More
Dashboard

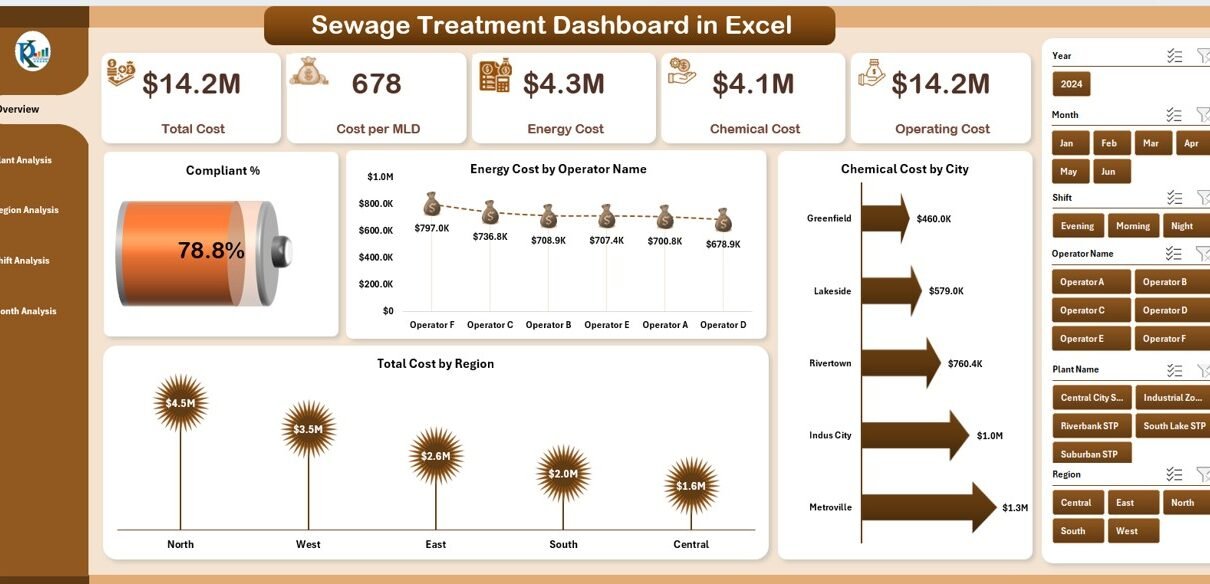
Sewage Treatment Dashboard in Excel

December 5, 2025December 5, 2025 PKComments Off on Sewage Treatment Dashboard in Excel
Managing sewage treatment operations demands accuracy, speed, and clear insights. Teams need to track total costs, operator performance, compliance levels, chemical usage, energy consumption, plant efficiency, and regional variations every
Read More
Templates

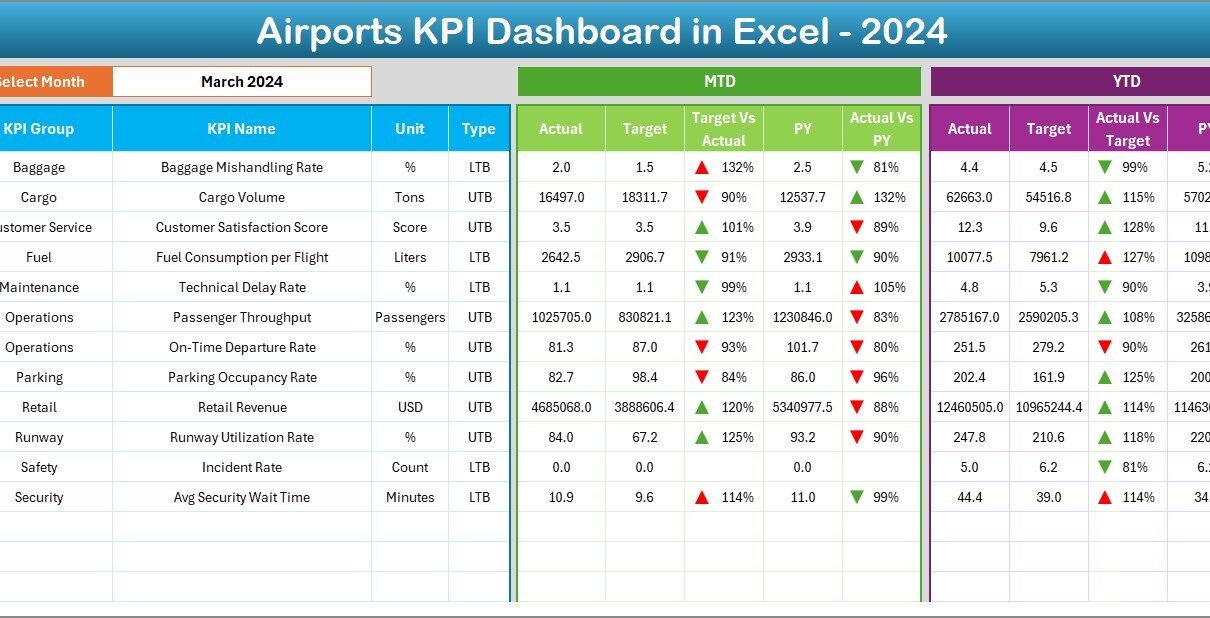
Airports KPI Dashboard in Excel

November 29, 2025November 29, 2025 PKComments Off on Airports KPI Dashboard in Excel
Efficient airport management depends on clear insights, accurate metrics, and real-time visibility. Airports handle thousands of passengers, flights, and operational processes every single day. Because of this high level of
Read More
Dashboard

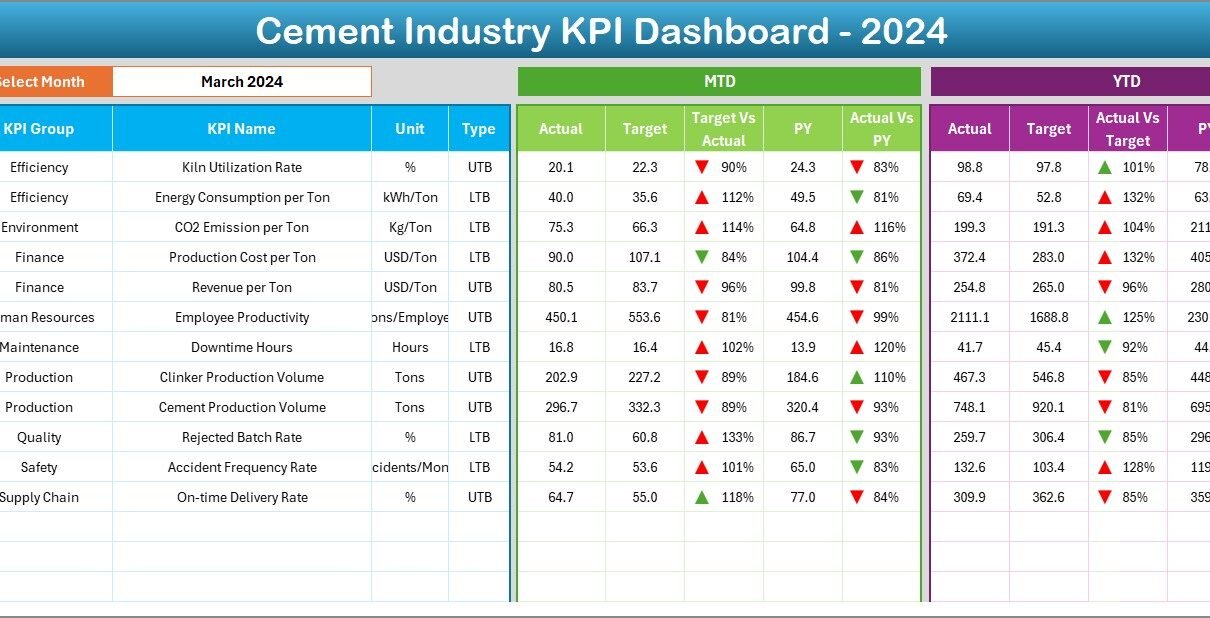
Cement Industry KPI Dashboard in Excel

November 13, 2025November 13, 2025 PKComments Off on Cement Industry KPI Dashboard in Excel
The cement industry plays a major role in infrastructure and economic development. Because of this, cement companies need accurate insights to improve productivity, reduce costs, and boost operational efficiency. However,
Read More
Dashboard

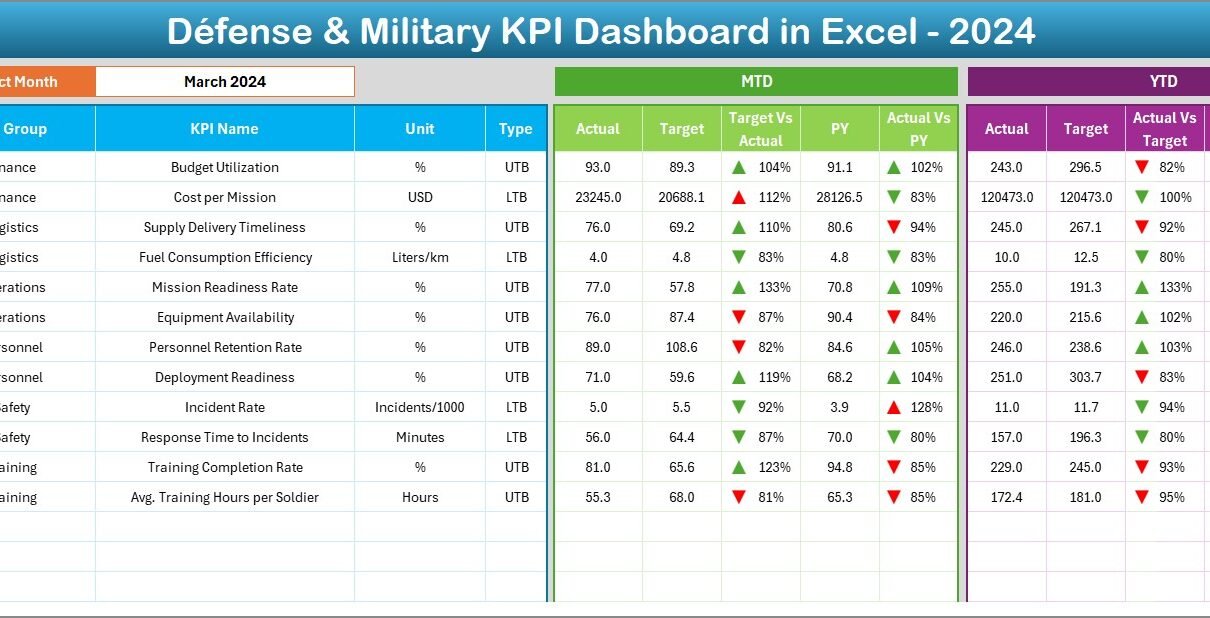
Défense & Military KPI Dashboard in Excel

September 15, 2025September 15, 2025 PKComments Off on Défense & Military KPI Dashboard in Excel
Managing Défense & Military KPI Dashboard in Excel operations requires precision, accountability, and constant monitoring of performance. Leaders must track personnel readiness, mission success rates, resource allocation, and compliance with
Read More
Templates

Technology Operations Supply Chain Resilience Calendar in Excel

May 12, 2025May 12, 2025 PKComments Off on Technology Operations Supply Chain Resilience Calendar in Excel
In today's fast-changing business environment, resilient supply chain operations are no longer optional—they're essential. Disruptions like pandemics, geopolitical tensions, and sudden demand spikes have shown us how fragile global supply
Read More
Dashboard

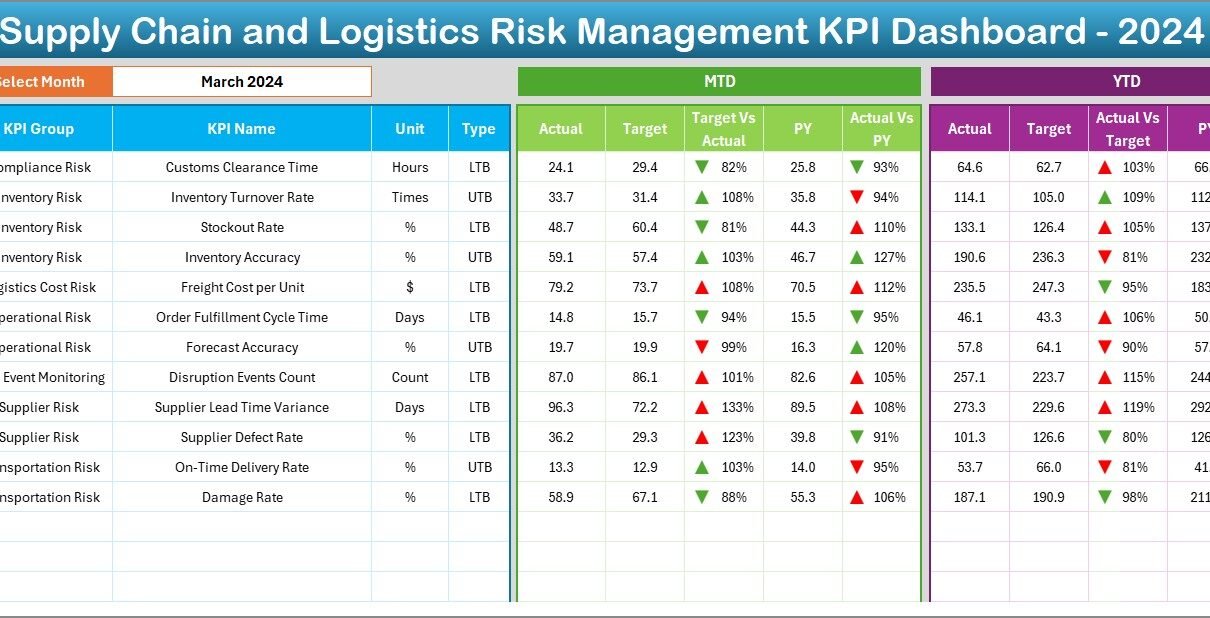
Supply Chain and Logistics Risk Management KPI Dashboard in Excel

May 12, 2025May 12, 2025 PKComments Off on Supply Chain and Logistics Risk Management KPI Dashboard in Excel
In today’s fast-paced global economy, managing risks in the supply chain and logistics ecosystem is no longer optional. It is a business necessity. Every company that deals with procurement, transportation,
Read More
Dashboard

Supply Chain and Logistics Revenue Tracking KPI Dashboard in Excel

May 11, 2025May 11, 2025 PKComments Off on Supply Chain and Logistics Revenue Tracking KPI Dashboard in Excel
In today’s hyper-competitive and fast-paced market, tracking the financial health of your supply chain operations isn't just beneficial—it’s essential. One of the most efficient ways to manage this is through
Read More

Posts pagination

Previous 1 … 5 6
  • Learn Excel (Free Course)
    • 1. Shortcut Keys
    • 2. Fill & Flash Fill
    • 3. Find & Replace
    • 4. Sort & Filter
    • 5. Formulas & Functions
    • 6. Data Validation
    • 7. Conditional Formatting
    • 8. Basic Charts
    • 9. Advanced Charts
    • 10. Pivot Tables
    • 11. Excel Dashboards
    • 12. VBA Course
    • 13. Excel Formulas with AI
  • Templates
  • Tutorials
    • Charts and Visualization
    • VBA
    • Excel Tips and Tricks
    • Excel Dashboards
    • Power Pivot & DAX
  • Power BI
  • Template Store
    • Ready to Use Templates
  • Courses
  • Academy
    • Excel + AI Mastery: 100 Formulas
    • Excel Pivot Tables & Dashboards
  • About Us
  • Contact Us
Copyright © 2023 PK-AnExcelExpert.com - Privacy Policy