New: NextGenTemplates Academy - video courses on Excel formulas with AI and Pivot Tables & dashboards. Early-bird: 20% off with code EARLYBIRD20 - first 20 orders only. See the courses →
  • Learn Excel (Free Course)
    • 1. Shortcut Keys
    • 2. Fill & Flash Fill
    • 3. Find & Replace
    • 4. Sort & Filter
    • 5. Formulas & Functions
    • 6. Data Validation
    • 7. Conditional Formatting
    • 8. Basic Charts
    • 9. Advanced Charts
    • 10. Pivot Tables
    • 11. Excel Dashboards
    • 12. VBA Course
    • 13. Excel Formulas with AI
  • Templates
  • Tutorials
    • Charts and Visualization
    • VBA
    • Excel Tips and Tricks
    • Excel Dashboards
    • Power Pivot & DAX
  • Power BI
  • Template Store
    • Ready to Use Templates
  • Courses
  • Academy
    • Excel + AI Mastery: 100 Formulas
    • Excel Pivot Tables & Dashboards
  • About Us
  • Contact Us

PK: An Excel Expert

Transforming Data into Decisions

Tag: operations dashboard

Dashboard

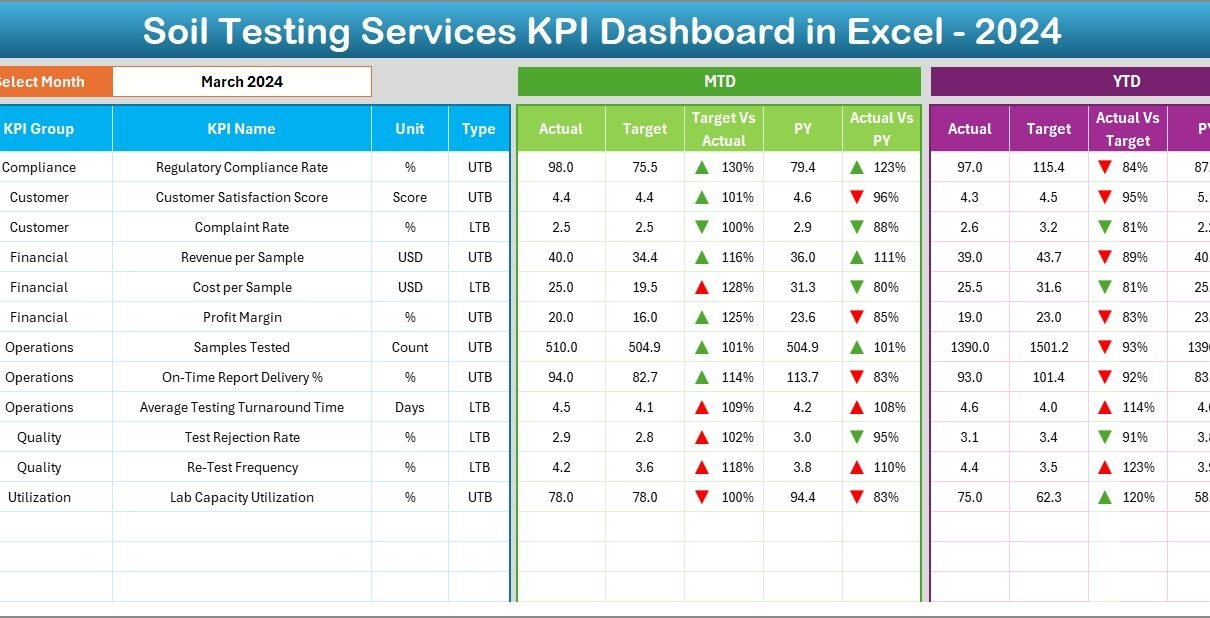
Soil Testing Services KPI Dashboard in Excel

January 2, 2026October 10, 2026 PKComments Off on Soil Testing Services KPI Dashboard in Excel
In today’s data-driven agriculture and environmental services industry, soil testing service providers must track performance with precision. Accuracy, turnaround time, client satisfaction, and operational efficiency directly impact credibility and revenue.
Read More
Dashboard

Mining Dashboard in Excel

December 31, 2025October 10, 2026 PKComments Off on Mining Dashboard in Excel
Managing mining operations without a clear performance view feels risky and inefficient. Mining companies deal with high costs, safety risks, equipment downtime, and strict ESG requirements every day. Therefore, decision-makers
Read More
Dashboard

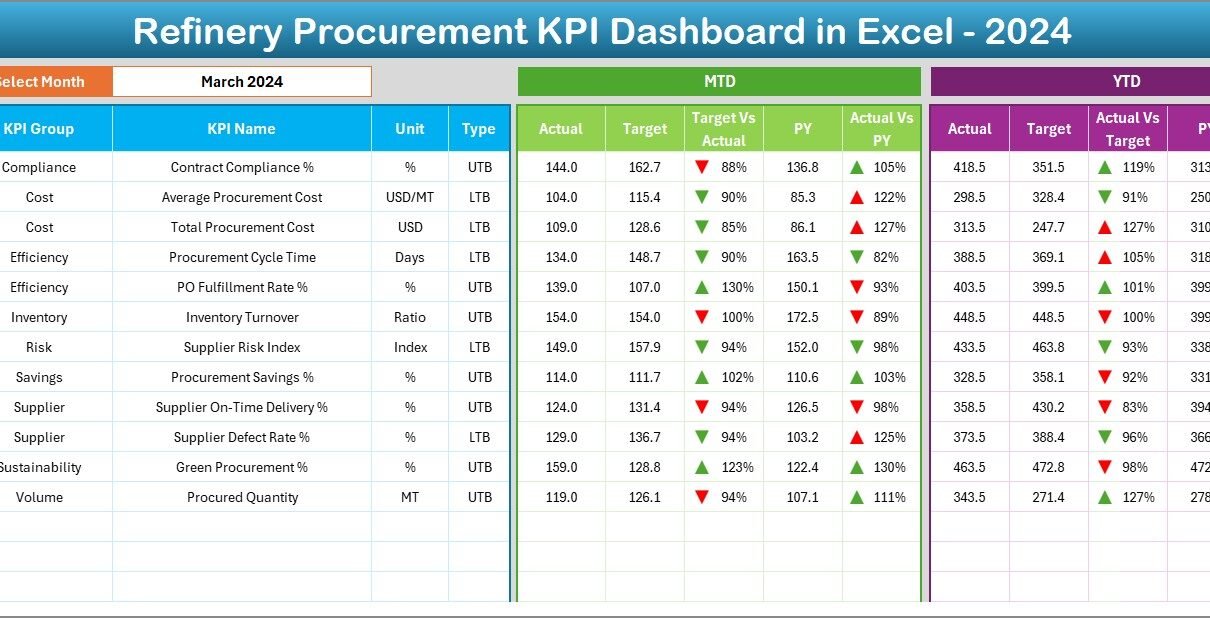
Refinery Procurement KPI Dashboard in Excel

December 30, 2025December 30, 2025 PKComments Off on Refinery Procurement KPI Dashboard in Excel
Managing procurement in a refinery is never simple. Refineries handle high-value materials, long-term vendor contracts, strict compliance rules, and continuous cost pressure. Therefore, procurement teams must track performance clearly and
Read More
Dashboard Power BI

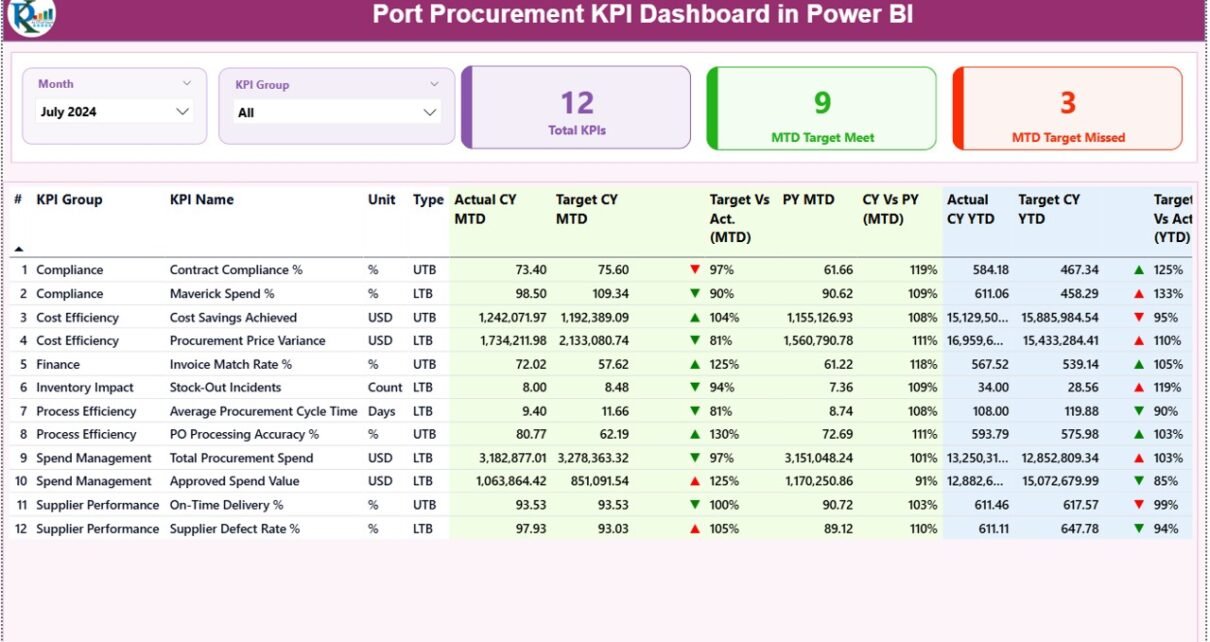
Port Procurement KPI Dashboard in Power BI

December 25, 2025December 25, 2025 PKComments Off on Port Procurement KPI Dashboard in Power BI
Port operations depend heavily on strong procurement management. Every purchase, contract, and supplier decision directly impacts cost, efficiency, and operational continuity. Therefore, port authorities and procurement teams must track performance
Read More
Dashboard

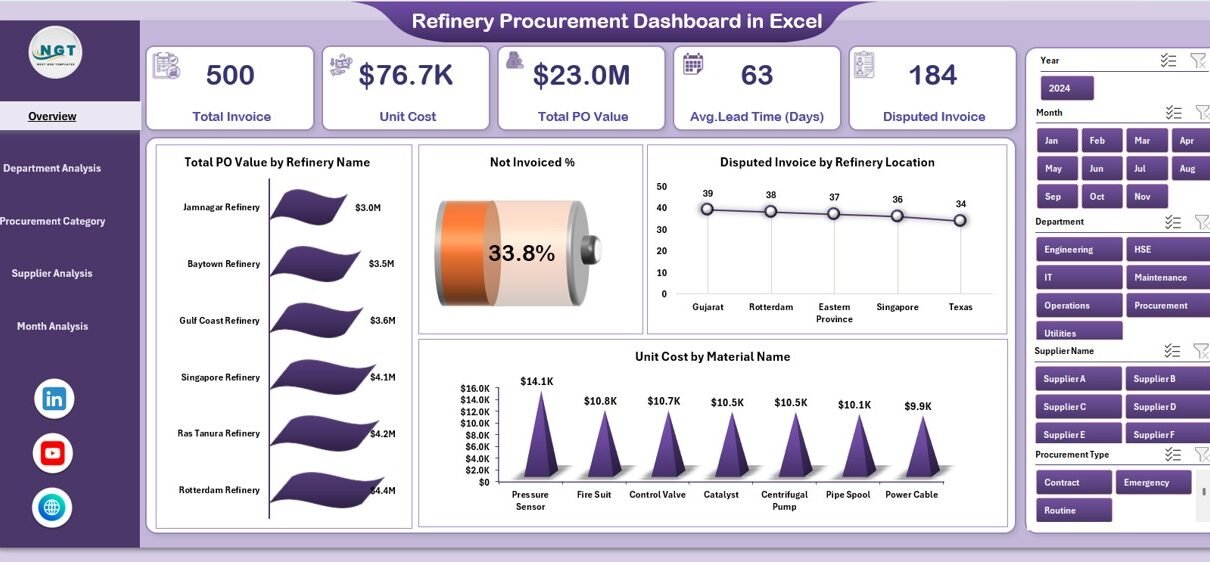
Refinery Procurement Dashboard in Excel

December 25, 2025December 25, 2025 PKComments Off on Refinery Procurement Dashboard in Excel
Managing procurement operations in a refinery is never simple. Refineries deal with large volumes of raw materials, multiple suppliers, strict quality standards, and tight delivery timelines. Because of this, even
Read More
Dashboard Power BI

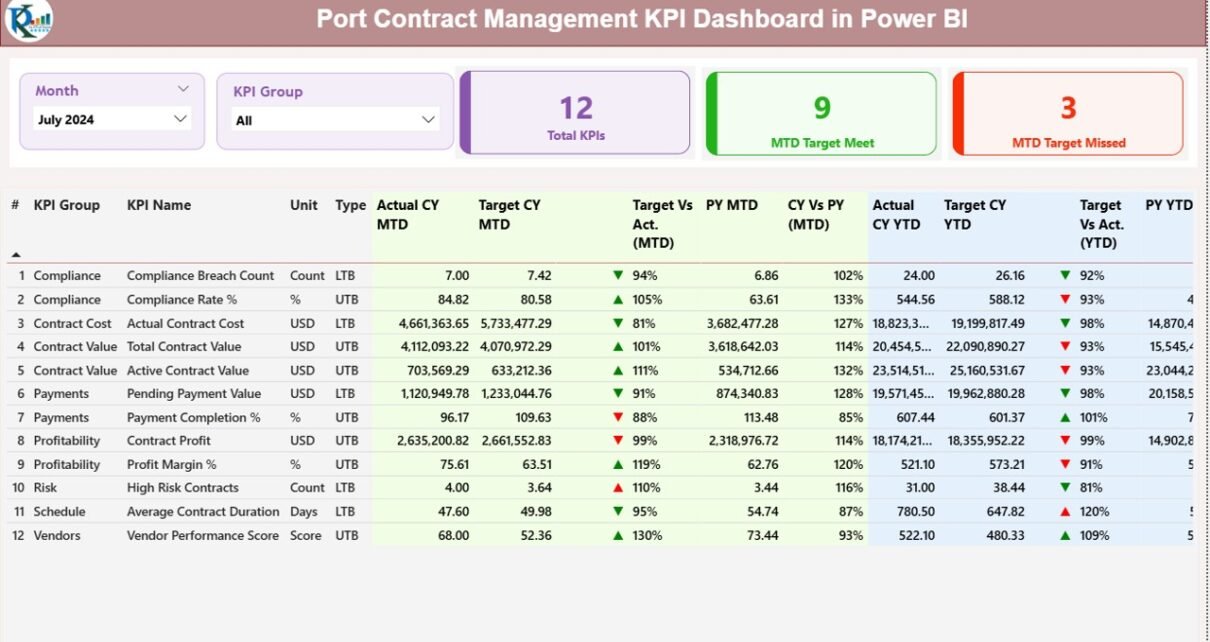
Port Contract Management KPI Dashboard in Power BI

December 25, 2025December 25, 2025 PKComments Off on Port Contract Management KPI Dashboard in Power BI
Managing contracts in a port environment is never simple. Ports deal with multiple vendors, shipping lines, service providers, and regulatory bodies every single day. Because of this, tracking performance manually
Read More
Dashboard

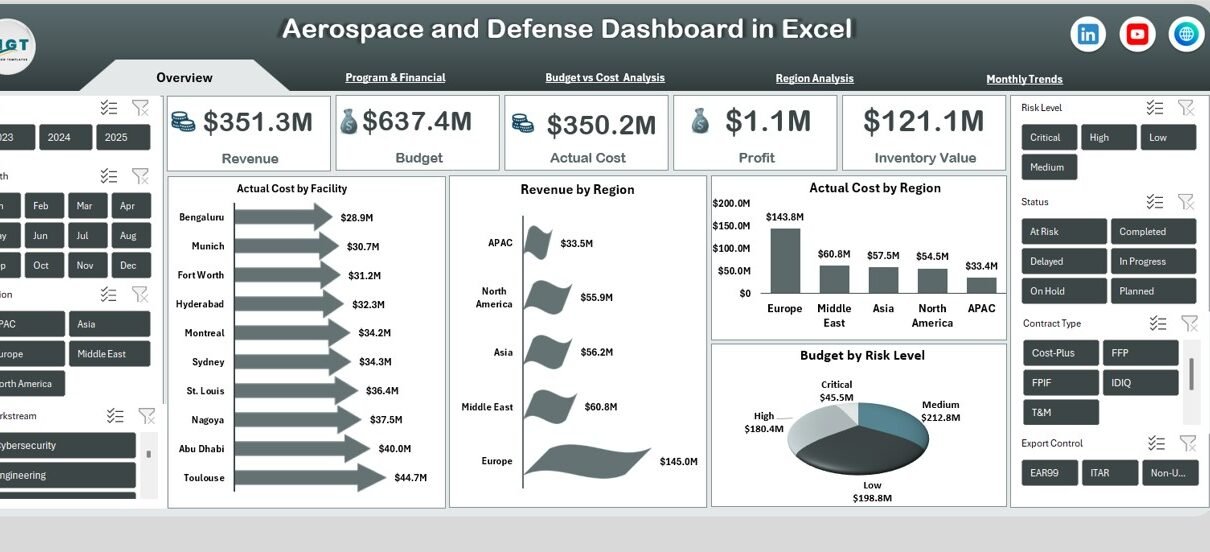
Aerospace and Defence Dashboard in Excel

December 23, 2025December 23, 2025 PKComments Off on Aerospace and Defence Dashboard in Excel
Managing aerospace and defence operations involves complex programs, high budgets, strict timelines, and zero tolerance for errors. However, many teams still depend on scattered Excel files and manual reports. As
Read More
Dashboard Power BI

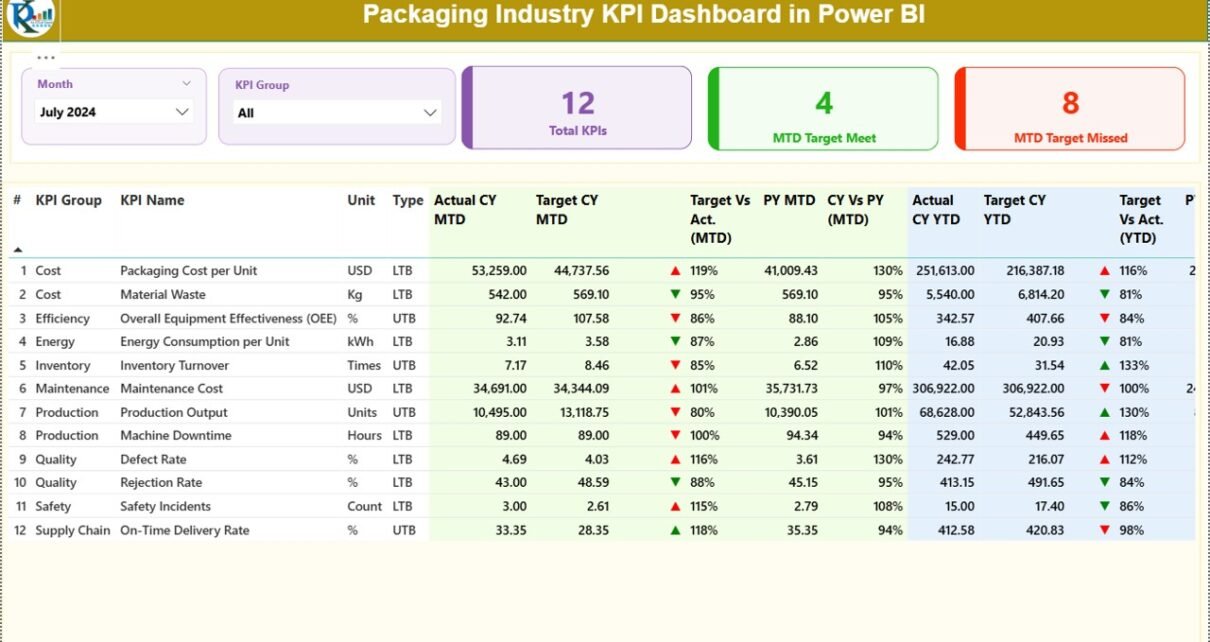
Packaging Industry KPI Dashboard in Power BI

December 19, 2025December 20, 2025 PKComments Off on Packaging Industry KPI Dashboard in Power BI
The packaging industry operates in a fast-moving, cost-sensitive, and highly competitive environment. Manufacturers must balance production efficiency, quality standards, material usage, energy costs, delivery timelines, and customer satisfaction at the
Read More
Dashboard Power BI

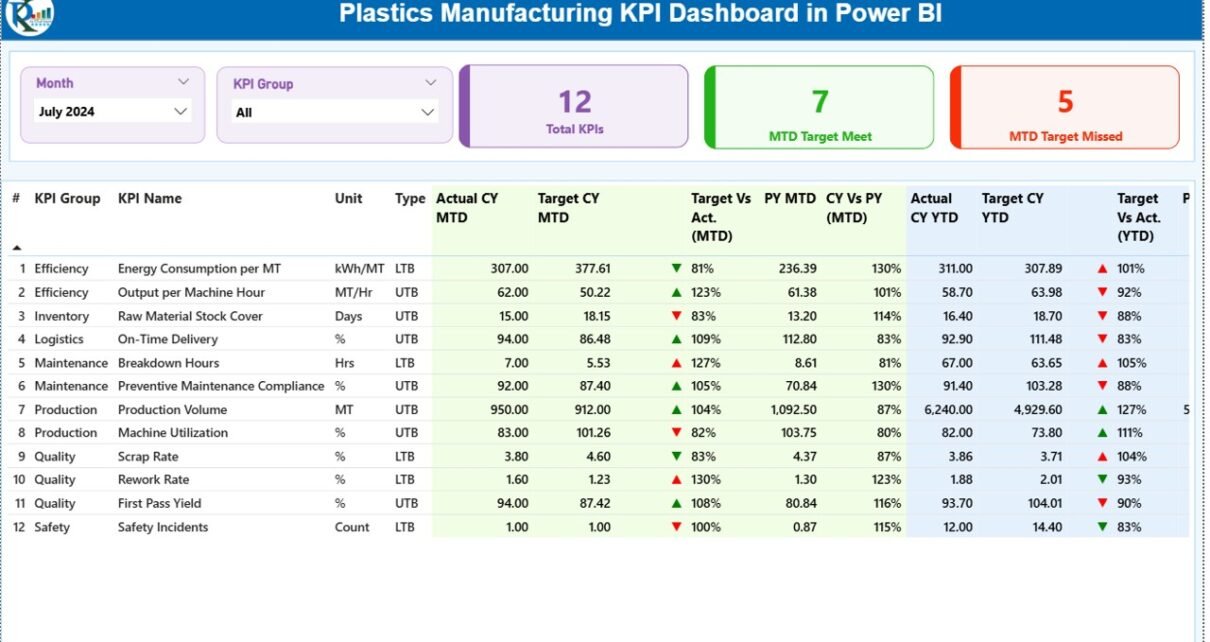
Plastics Manufacturing KPI Dashboard in Power BI

December 18, 2025December 18, 2025 PKComments Off on Plastics Manufacturing KPI Dashboard in Power BI
The plastics manufacturing industry faces constant pressure to improve productivity, control costs, reduce waste, and meet strict quality standards. However, many manufacturers still depend on manual Excel reports, delayed performance
Read More
Dashboard

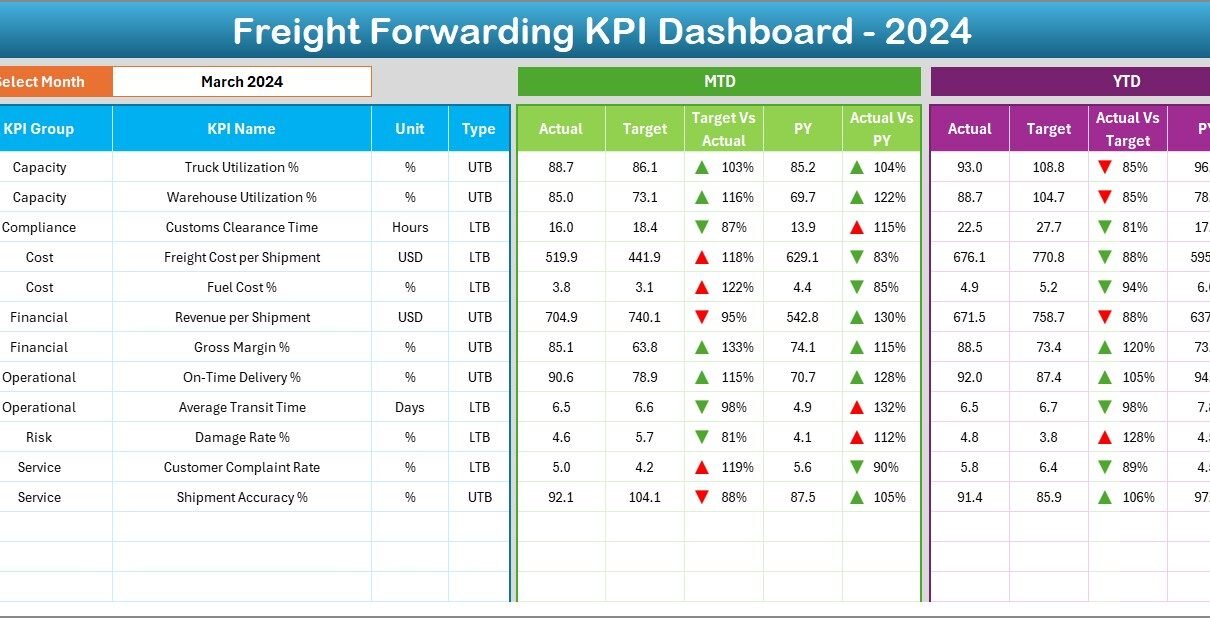
Freight Forwarding KPI Dashboard in Excel

December 16, 2025December 16, 2025 PKComments Off on Freight Forwarding KPI Dashboard in Excel
Freight forwarding plays a critical role in global trade and supply chain operations. Every day, freight forwarders manage shipments, coordinate with carriers, handle documentation, and ensure on-time delivery across borders.
Read More

Posts pagination

Previous 1 … 4 5 6 Next
  • Learn Excel (Free Course)
    • 1. Shortcut Keys
    • 2. Fill & Flash Fill
    • 3. Find & Replace
    • 4. Sort & Filter
    • 5. Formulas & Functions
    • 6. Data Validation
    • 7. Conditional Formatting
    • 8. Basic Charts
    • 9. Advanced Charts
    • 10. Pivot Tables
    • 11. Excel Dashboards
    • 12. VBA Course
    • 13. Excel Formulas with AI
  • Templates
  • Tutorials
    • Charts and Visualization
    • VBA
    • Excel Tips and Tricks
    • Excel Dashboards
    • Power Pivot & DAX
  • Power BI
  • Template Store
    • Ready to Use Templates
  • Courses
  • Academy
    • Excel + AI Mastery: 100 Formulas
    • Excel Pivot Tables & Dashboards
  • About Us
  • Contact Us
Copyright © 2023 PK-AnExcelExpert.com - Privacy Policy