New: NextGenTemplates Academy - video courses on Excel formulas with AI and Pivot Tables & dashboards. Early-bird: 20% off with code EARLYBIRD20 - first 20 orders only. See the courses →
  • Learn Excel (Free Course)
    • 1. Shortcut Keys
    • 2. Fill & Flash Fill
    • 3. Find & Replace
    • 4. Sort & Filter
    • 5. Formulas & Functions
    • 6. Data Validation
    • 7. Conditional Formatting
    • 8. Basic Charts
    • 9. Advanced Charts
    • 10. Pivot Tables
    • 11. Excel Dashboards
    • 12. VBA Course
    • 13. Excel Formulas with AI
  • Templates
  • Tutorials
    • Charts and Visualization
    • VBA
    • Excel Tips and Tricks
    • Excel Dashboards
    • Power Pivot & DAX
  • Power BI
  • Template Store
    • Ready to Use Templates
  • Courses
  • Academy
    • Excel + AI Mastery: 100 Formulas
    • Excel Pivot Tables & Dashboards
  • About Us
  • Contact Us

PK: An Excel Expert

Transforming Data into Decisions

Tag: operations dashboard

Dashboard Power BI

Call Center Operations Dashboard in Power BI

January 18, 2026January 18, 2026 PKComments Off on Call Center Operations Dashboard in Power BI
Managing a call center demands speed, accuracy, and clear visibility into daily operations. However, raw call logs and scattered reports often slow down decision-making. Therefore, businesses increasingly rely on a
Read More
Dashboard

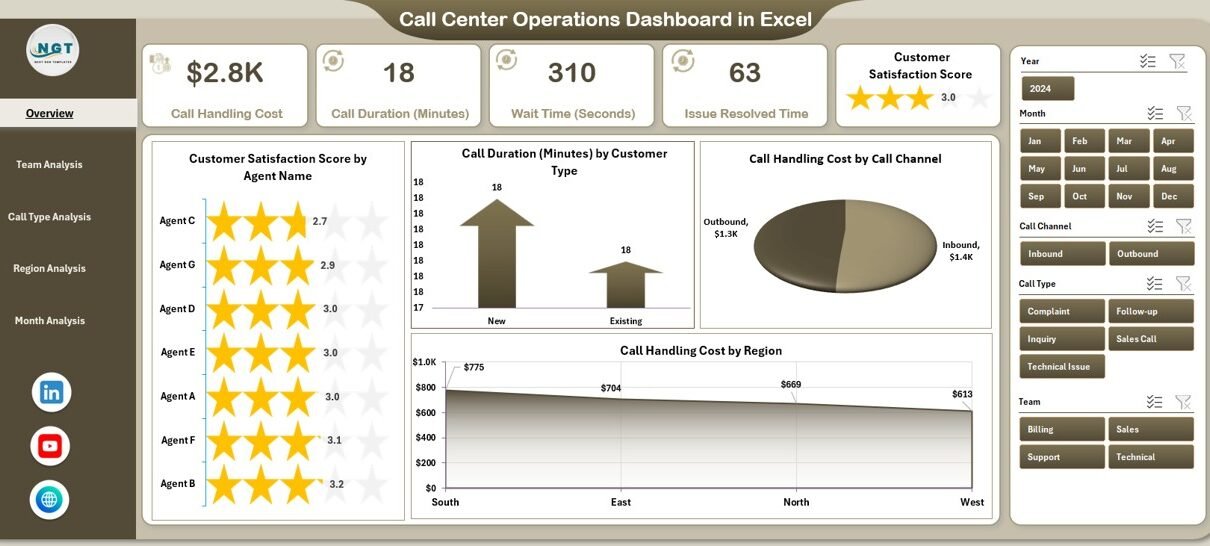
Call Center Operations Dashboard in Excel

January 17, 2026January 17, 2026 PKComments Off on Call Center Operations Dashboard in Excel
Running a call center means managing hundreds or even thousands of calls every day. Agents handle different customer issues, managers track costs, and leadership teams expect clear performance reports. However,
Read More
Dashboard

Heavy Machinery Dashboard in Excel

January 17, 2026January 17, 2026 PKComments Off on Heavy Machinery Dashboard in Excel
Managing heavy machinery without clear data always creates risk. Equipment breakdowns delay projects. Maintenance costs increase suddenly. Productivity drops without warning. Therefore, companies need a simple yet powerful way to
Read More
Dashboard

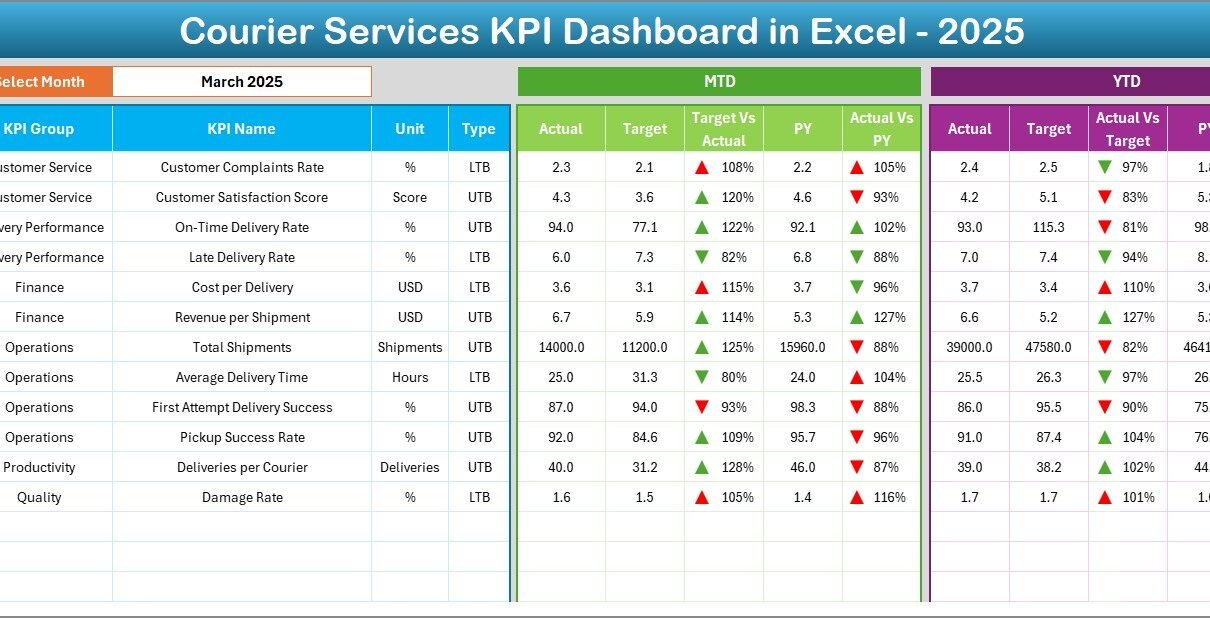
Courier Services KPI Dashboard in Excel

January 17, 2026January 17, 2026 PKComments Off on Courier Services KPI Dashboard in Excel
Courier and logistics businesses operate in a highly competitive, time-sensitive environment. Every shipment, delivery route, and customer interaction directly impacts cost, service quality, and profitability. Therefore, companies must track performance
Read More
Dashboard

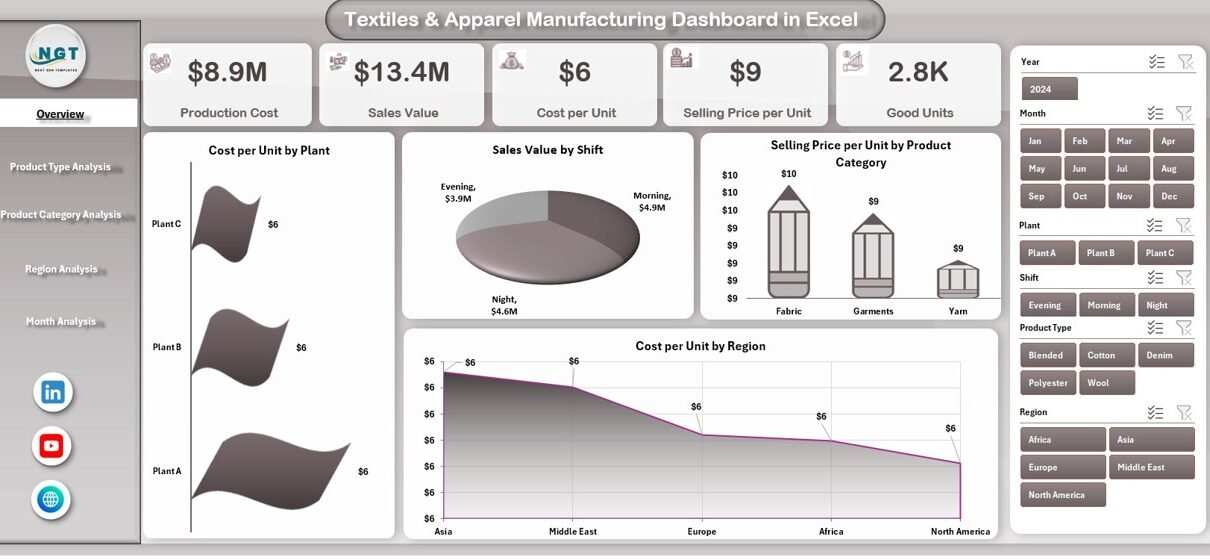
Textiles & Apparel Manufacturing Dashboard in Excel

January 16, 2026January 16, 2026 PKComments Off on Textiles & Apparel Manufacturing Dashboard in Excel
The textiles and apparel industry operates in a highly competitive, cost-sensitive, and volume-driven environment. Every day, manufacturers track production output, product cost, selling price, sales value, and regional performance. However,
Read More
Dashboard Power BI

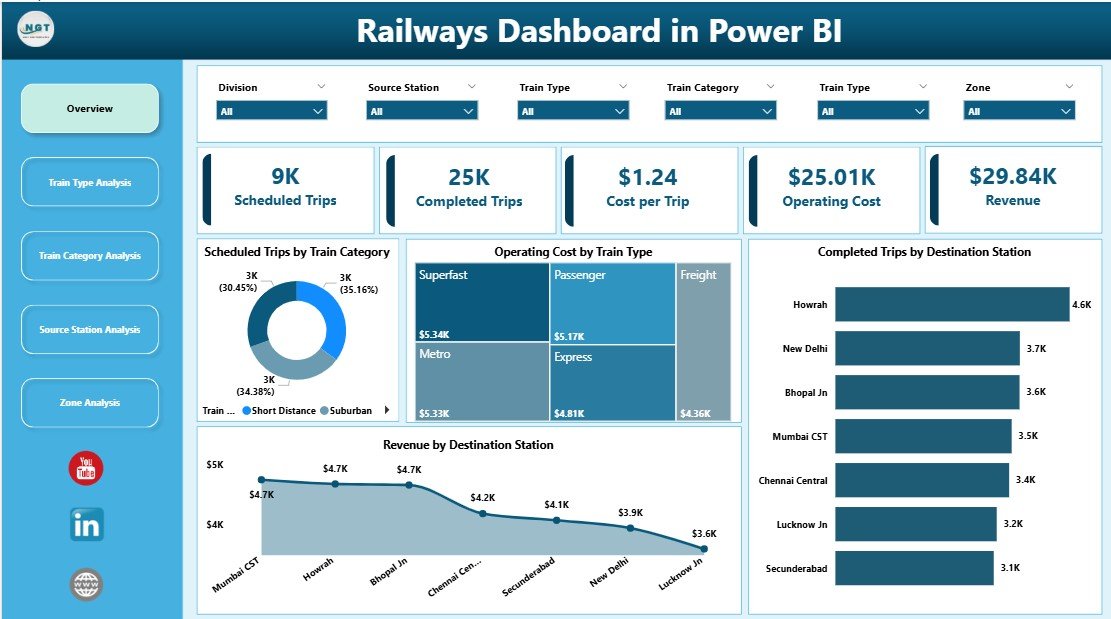
Railways Dashboard in Power BI

January 15, 2026January 15, 2026 PKComments Off on Railways Dashboard in Power BI
Railway networks manage thousands of trips, stations, zones, and train categories every day. Because operations run at such scale, decision-makers need clear visibility into performance, cost, and revenue. However, traditional
Read More
Dashboard Power BI

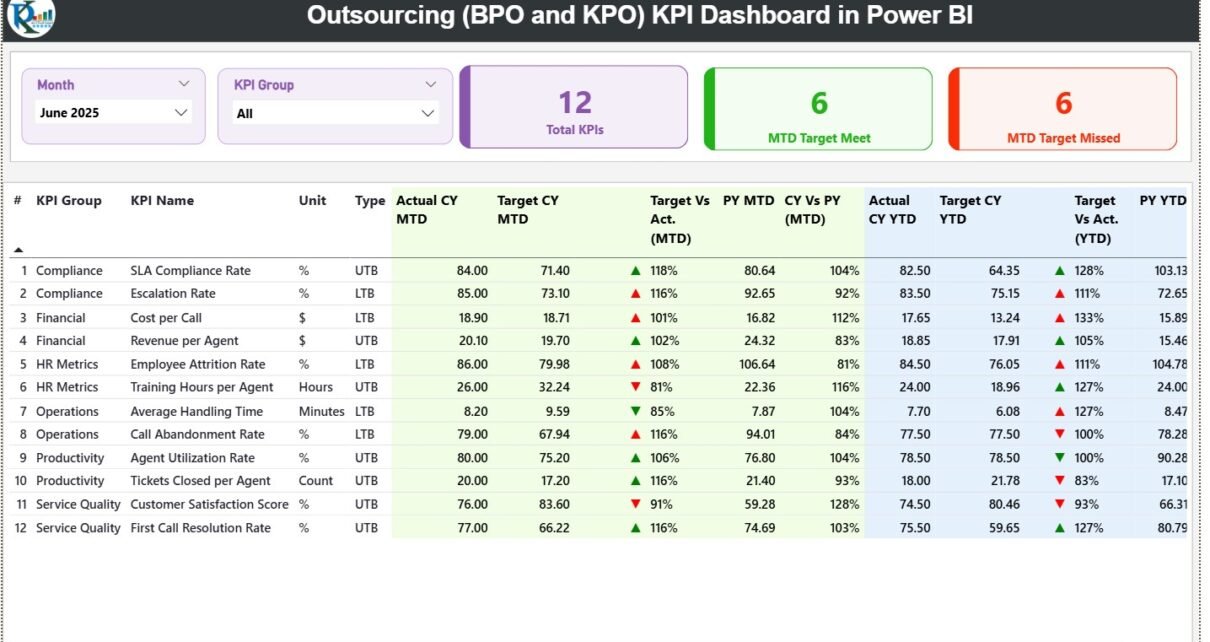
Outsourcing (BPO and KPO) KPI Dashboard in Power BI

January 15, 2026January 15, 2026 PKComments Off on Outsourcing (BPO and KPO) KPI Dashboard in Power BI
In today’s highly competitive outsourcing industry, data-driven decision-making defines success. Business Process Outsourcing (BPO) and Knowledge Process Outsourcing (KPO) organizations manage large workforces, strict SLAs, multiple clients, and complex processes.
Read More
Templates

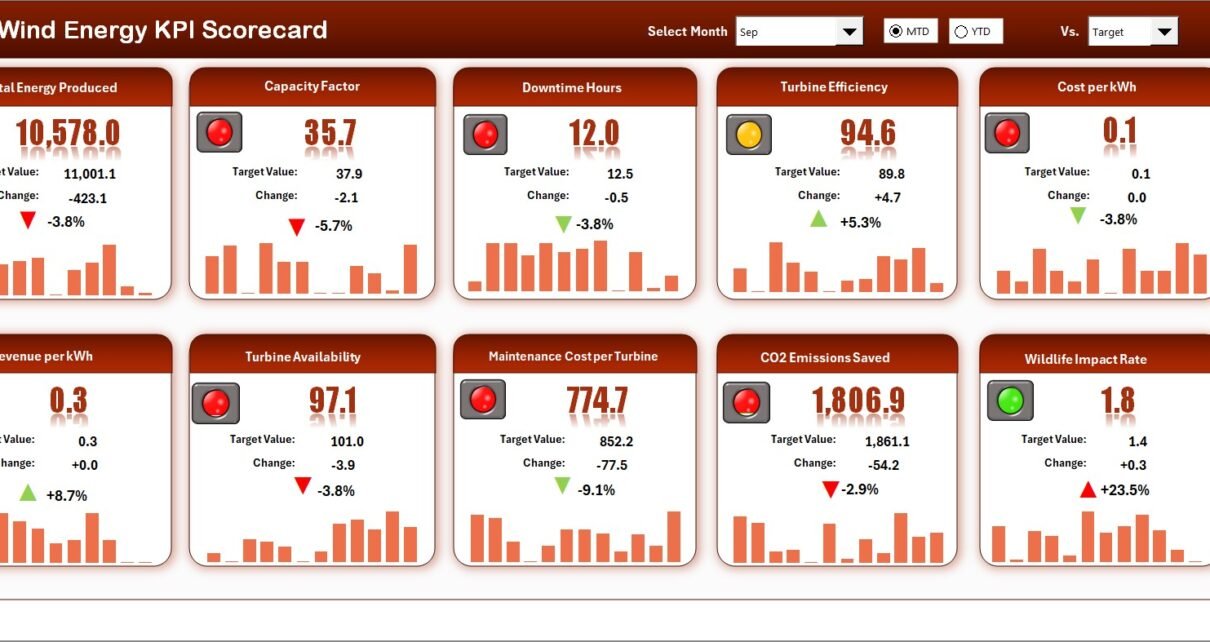
Wind Energy KPI Scorecard in Excel

January 14, 2026January 14, 2026 PKComments Off on Wind Energy KPI Scorecard in Excel
The wind energy sector continues to grow rapidly as organizations focus on renewable and sustainable power generation. However, managing wind energy operations effectively requires continuous monitoring of performance, efficiency, availability,
Read More
Dashboard Power BI

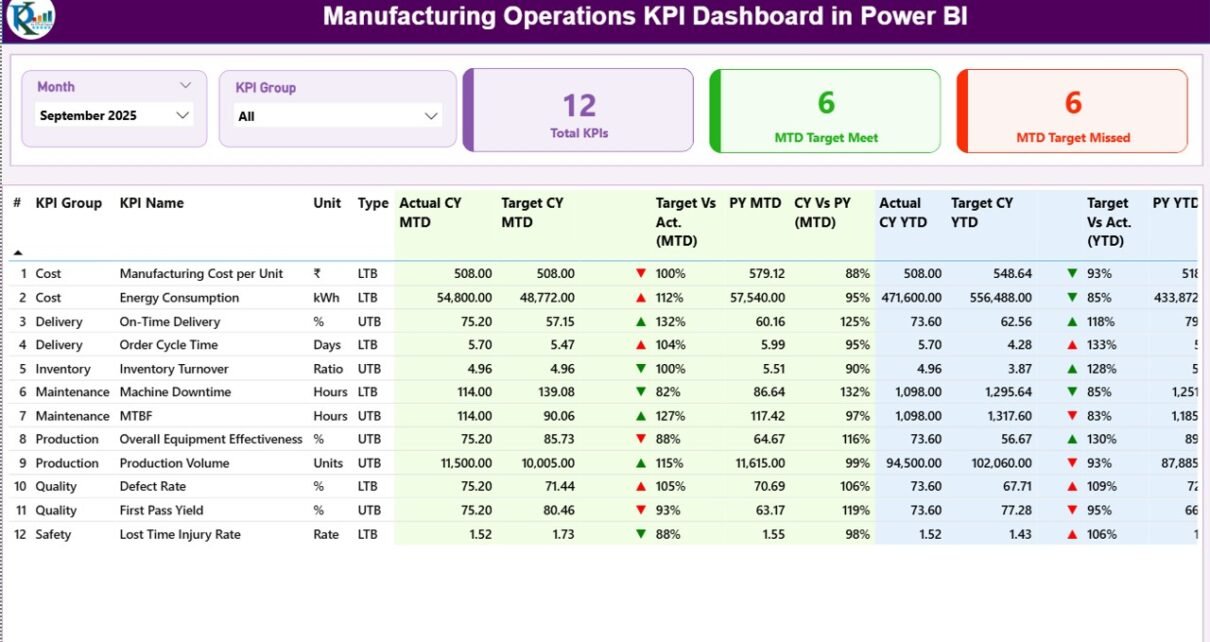
Manufacturing Operations KPI Dashboard in Power BI

January 14, 2026January 14, 2026 PKComments Off on Manufacturing Operations KPI Dashboard in Power BI
Manufacturing organizations operate in a fast-moving, cost-sensitive, and performance-driven environment. Therefore, leaders must track production efficiency, quality, cost control, and delivery performance without delay. However, when data spreads across multiple
Read More
Dashboard

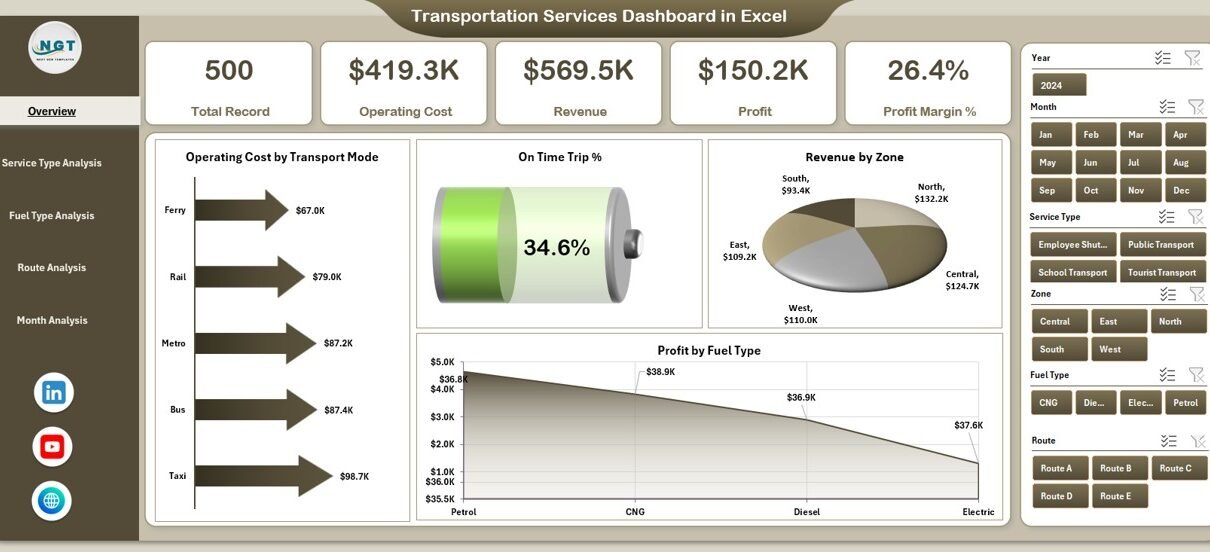
Transportation Services Dashboard in Excel

January 13, 2026January 13, 2026 PKComments Off on Transportation Services Dashboard in Excel
Managing transportation operations without a clear reporting system always leads to rising costs, missed deliveries, and poor decisions. Moreover, when data stays scattered across spreadsheets, emails, and manual reports, transportation
Read More

Posts pagination

Previous 1 … 3 4 5 6 Next
  • Learn Excel (Free Course)
    • 1. Shortcut Keys
    • 2. Fill & Flash Fill
    • 3. Find & Replace
    • 4. Sort & Filter
    • 5. Formulas & Functions
    • 6. Data Validation
    • 7. Conditional Formatting
    • 8. Basic Charts
    • 9. Advanced Charts
    • 10. Pivot Tables
    • 11. Excel Dashboards
    • 12. VBA Course
    • 13. Excel Formulas with AI
  • Templates
  • Tutorials
    • Charts and Visualization
    • VBA
    • Excel Tips and Tricks
    • Excel Dashboards
    • Power Pivot & DAX
  • Power BI
  • Template Store
    • Ready to Use Templates
  • Courses
  • Academy
    • Excel + AI Mastery: 100 Formulas
    • Excel Pivot Tables & Dashboards
  • About Us
  • Contact Us
Copyright © 2023 PK-AnExcelExpert.com - Privacy Policy