New: NextGenTemplates Academy - video courses on Excel formulas with AI and Pivot Tables & dashboards. Early-bird: 20% off with code EARLYBIRD20 - first 20 orders only.See the courses →
PKComments Off on Eye Care Centers Dashboard in Power BI
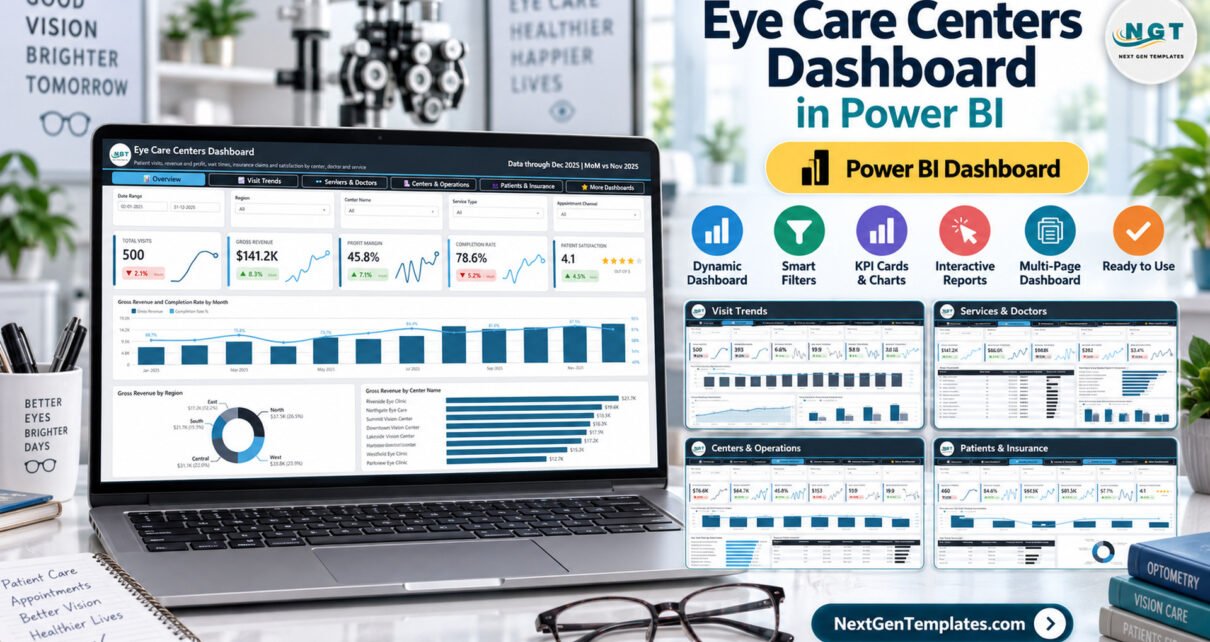
The Eye Care Centers Dashboard in Power BI analyses 500 sample patient visits recorded across 8 eye care centers, 5 regions and 12 doctors during 2025. It packs 25 KPI
PKComments Off on Eye Care Centers Dashboard in Excel
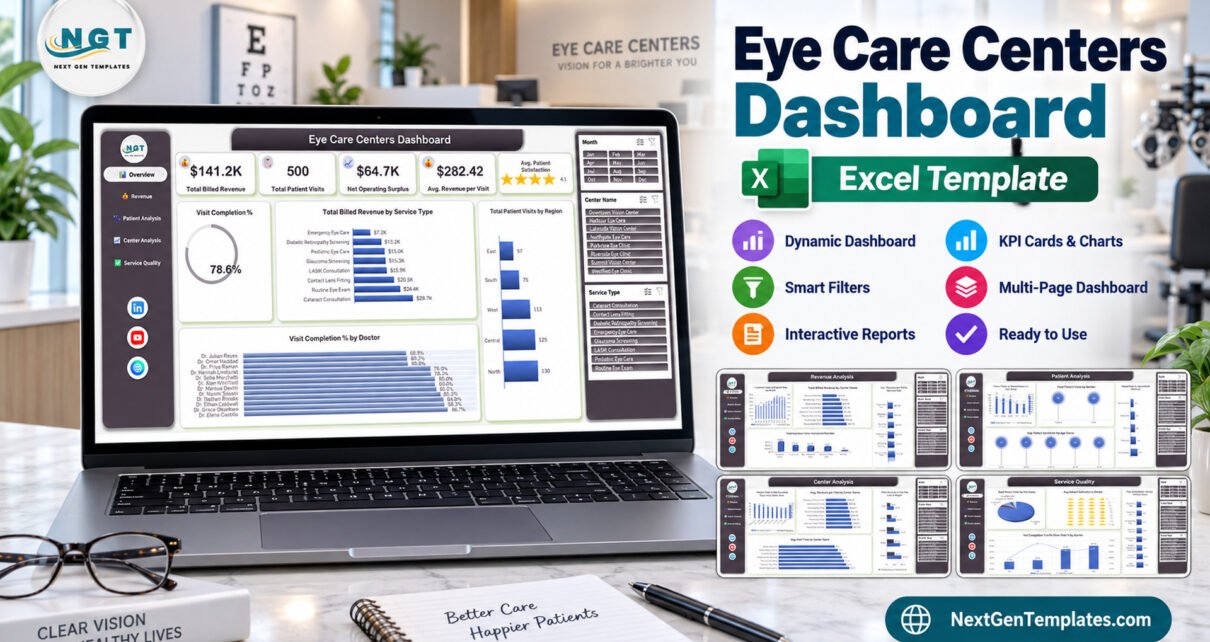
Running more than one eye-care site turns a simple question into an awkward one. A single clinic owner can feel how the month went. Put eight centers across five regions
PKComments Off on Cardiac Care Units Dashboard in Excel
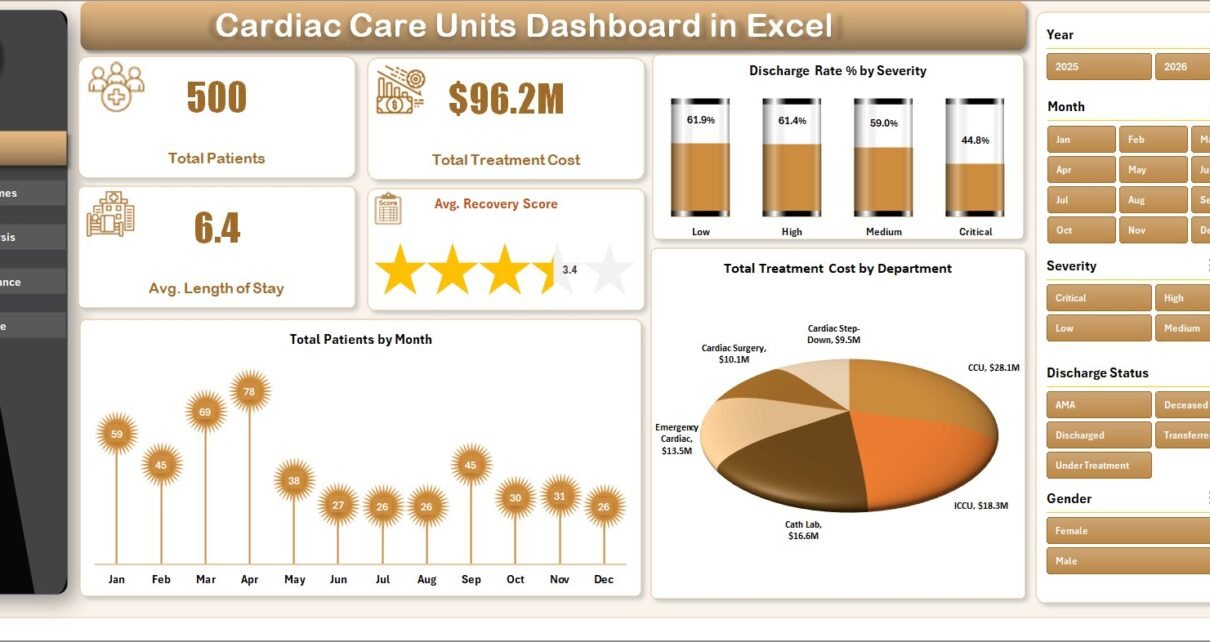
The Cardiac Care Units Dashboard in Excel tracks 4 headline KPIs and 14 pivot-driven charts across 5 interactive analysis pages, with native Excel slicers filtering Department, Severity, Diagnosis, Admission Type,
PKComments Off on Hospital Patient Flow Dashboard in Power BI
Hospital Patient Flow Dashboard in Power BI is a comprehensive, interactive analytics template designed for hospital administrators, healthcare analysts, and clinical operations teams who need to monitor patient movement, treatment
PKComments Off on Cardiology Institutes Dashboard in Power BI
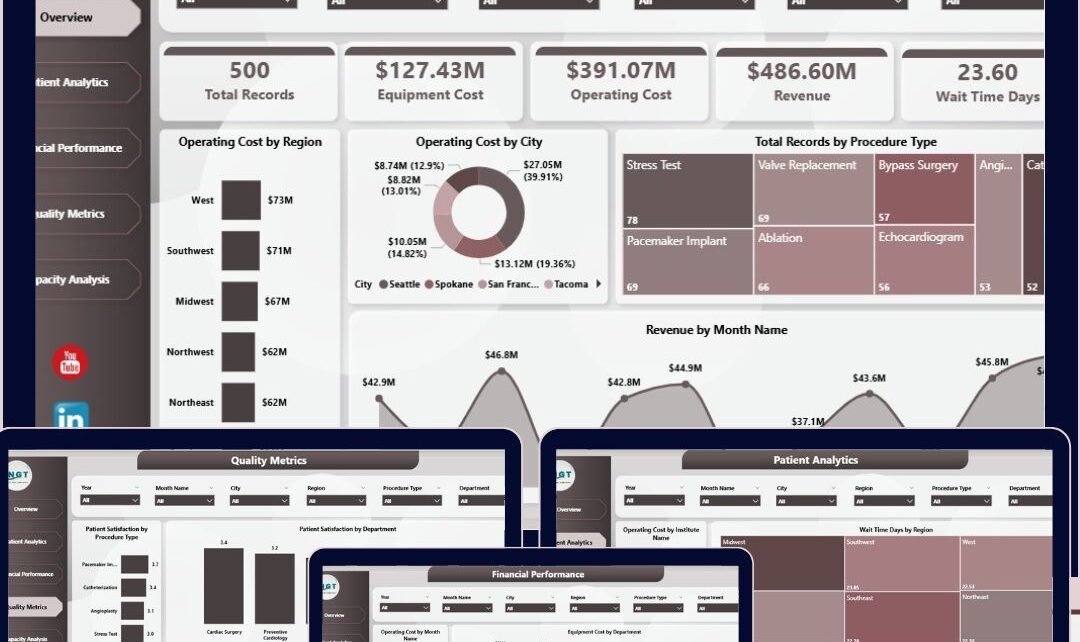
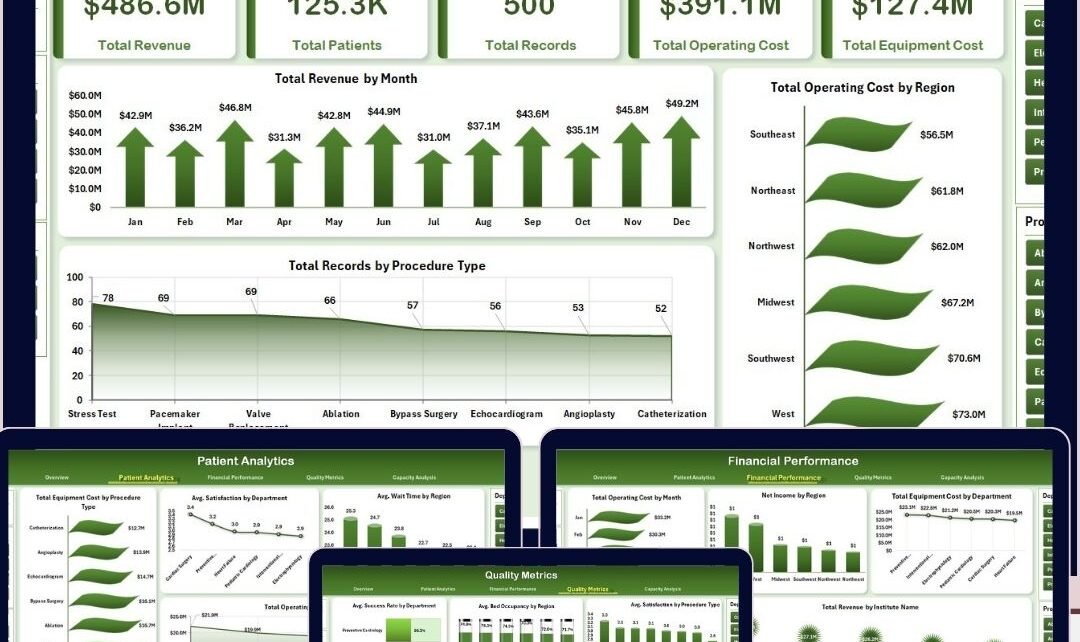
Introduction The Cardiology Institutes Dashboard in Power BI is a ready-to-use analytical tool designed to provide comprehensive, real-time insights into cardiology operations. By updating your data file and refreshing the
PKComments Off on Cardiology Institutes Dashboard in Excel
Introduction The Cardiology Institutes Dashboard is a powerful ready-to-use tool designed to help cardiology centers monitor and analyze their performance metrics with ease. By simply updating your data in the
PKComments Off on Alternative Medicine Dashboard in Excel
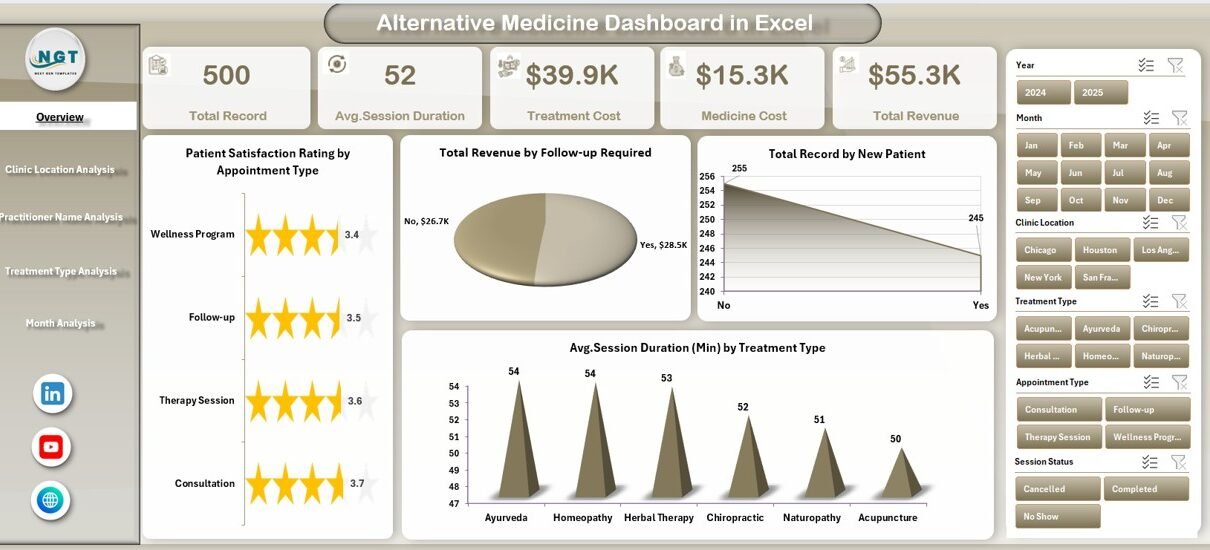
In recent years, alternative medicine has gained significant popularity across the world. People increasingly prefer natural healing methods, holistic therapies, and preventive healthcare approaches. As clinics grow and patient numbers