Human Resources teams manage many activities every single day. They track hiring, employee engagement, attendance, training, turnover, diversity, payroll, and performance. Because so many things happen at the same time, HR leaders need a clear and simple way to monitor the workforce. However, data often sits in many Excel sheets, emails, and manual files. As a result, HR decisions take more time, and managers struggle to understand the real picture.
A Human Resources (HR) KPI Dashboard in Power BI solves this problem. It brings all HR metrics into one interactive dashboard. You can see monthly performance, compare it with targets, check trends, and review employee-related insights in seconds. Since the dashboard uses Power BI, you enjoy automation, visual clarity, and dynamic reporting.
This article explains everything about the HR KPI Dashboard in Power BI. You will learn how it works, what it includes, how HR teams use it, and how it helps organisations make better decisions. You will also see advantages, best practices, and answers to common questions at the end.
Click to buy Human Resources (HR) KPI Dashboard in Power BI
What Is a Human Resources (HR) KPI Dashboard in Power BI?
A Human Resources KPI Dashboard in Power BI is a ready-to-use reporting system that tracks important HR performance indicators. It gives a complete view of employee-related activities such as hiring, retention, training, satisfaction, headcount movements, overtime, productivity, and payroll accuracy.
The dashboard captures structured data from an Excel file and turns it into easy-to-understand visuals. HR managers can filter the dashboard by month, KPI group, or KPI name and instantly monitor trends. Since all metrics refresh automatically when you update the source file, you save hours of manual work.
The dashboard includes:
- Summary of all KPIs
- MTD (Month-to-Date) and YTD (Year-to-Date) values
- Actual vs Target performance
- Comparison with the previous year
- Trend charts
- KPI definitions and formulas
- Drill-through pages for deeper insights
Because everything stays organized, the HR team always stays informed.
Why Do Organizations Need an HR KPI Dashboard?
Every HR department handles huge amounts of data. Without a dashboard, this information stays scattered and difficult to analyse. A Power BI dashboard brings all the data together and shows:
- How many employees joined or left
- How training and development programs perform
- How salary budgets move
- How engagement levels change
- How overtime or absenteeism increases
- How recruiting pipeline performs
- How diversity levels shift
This single view helps HR leaders take fast and correct decisions.
Key Features of the Human Resources (HR) KPI Dashboard in Power BI
The HR KPI dashboard includes three main pages inside Power BI:
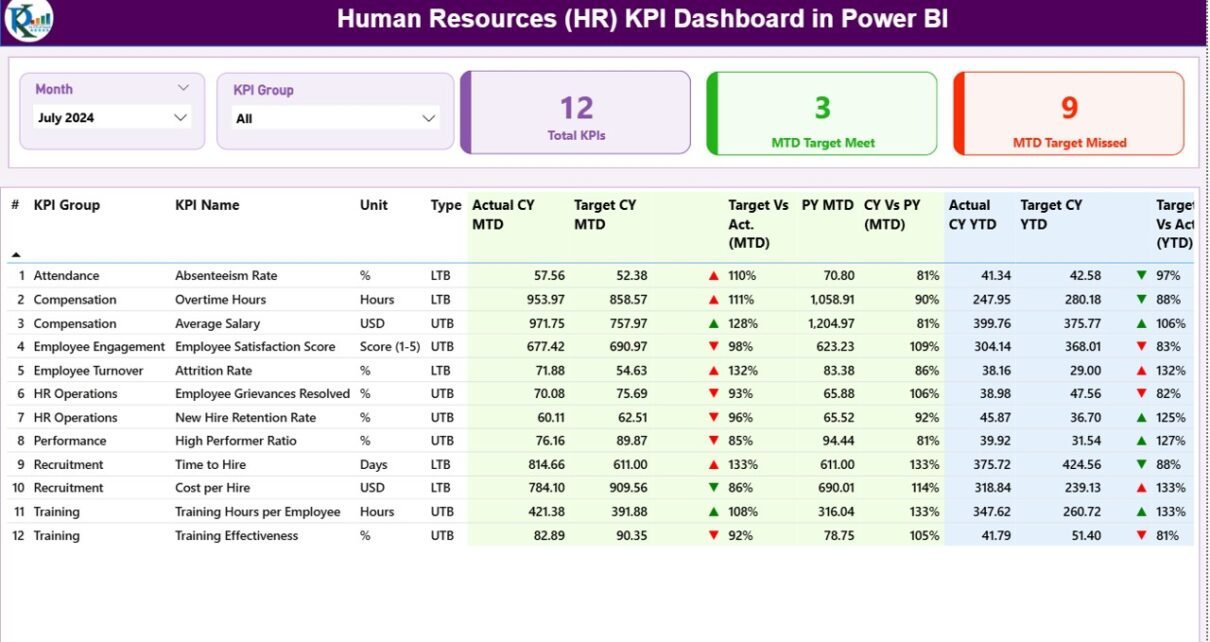
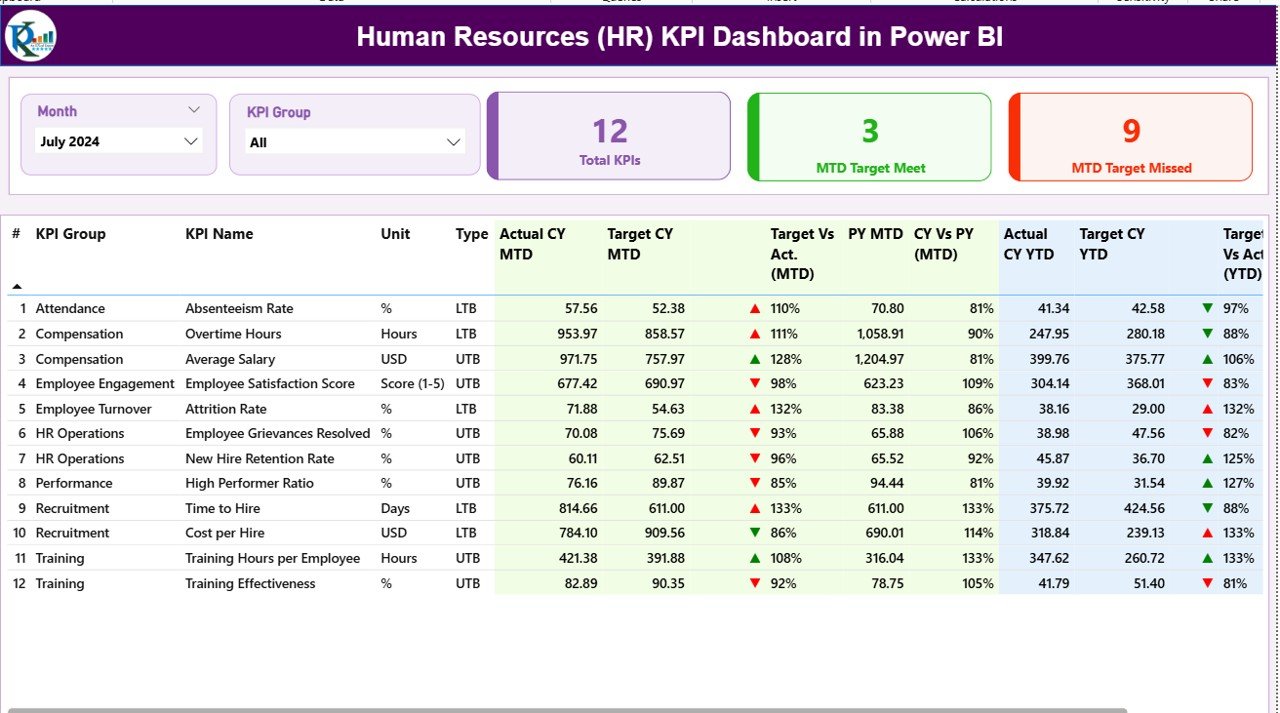
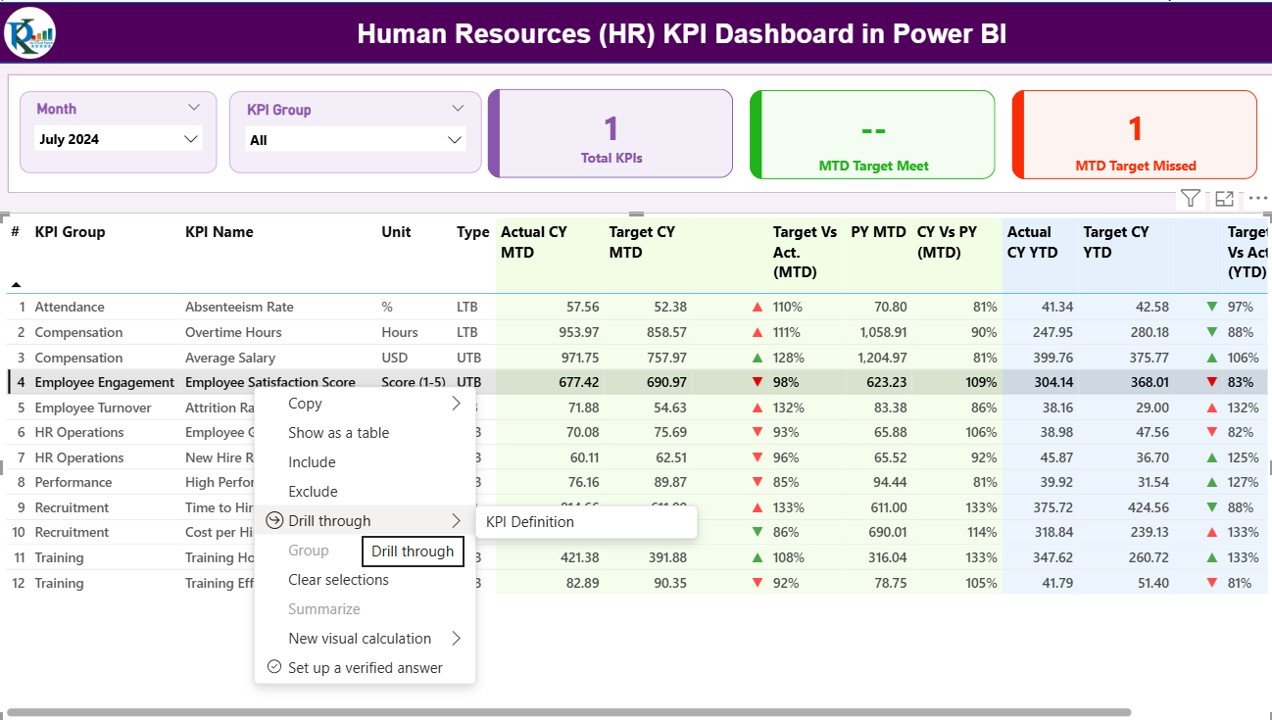
Summary Page – The Main Performance View
The Summary Page is the central page where you review all HR KPIs at once. It provides a clean, interactive layout.
Key highlights of the Summary Page
Month slicer – Choose any month to refresh the entire dashboard
KPI Group slicer – Filter by categories like Recruitment, Engagement, Training, Workforce, Payroll, etc.
KPI Cards
- Total KPIs count
- MTD Target Met
- MTD Target Missed
These cards give a quick understanding of whether HR performance is improving or declining.
Below the cards, a detailed table displays complete KPI information:
Fields shown in the KPI table
- KPI Number – Unique sequence number
- KPI Group – Recruitment, Training, Payroll, Attendance, etc.
- KPI Name – Example: Employee Turnover %, Training Hours, Absenteeism Rate
- Unit – %, Hours, Count, Days, etc.
- Type (UTB or LTB) –
- UTB: Upper the Better
- LTB: Lower the Better
- Actual CY MTD – Current year Month-to-Date actual numbers
- Target CY MTD – MTD target values
- MTD Icon – Green ▲ when KPI meets the target, Red ▼ when KPI misses the target
- Target vs Actual (MTD) – Actual ÷ Target
- PY MTD – Previous year MTD numbers
- CY vs PY (MTD) – Comparison of current MTD with previous MTD
- Actual CY YTD – Year-to-Date actual numbers
- Target CY YTD – YTD target values
- YTD Icon – Green ▲ or Red ▼ based on target status
- Target vs Actual (YTD) – Actual ÷ Target
- PY YTD – Previous year YTD values
- CY vs PY (YTD) – Current YTD performance compared to previous YTD
With this page, HR leaders see performance in a single click.
Click to buy Human Resources (HR) KPI Dashboard in Power BI
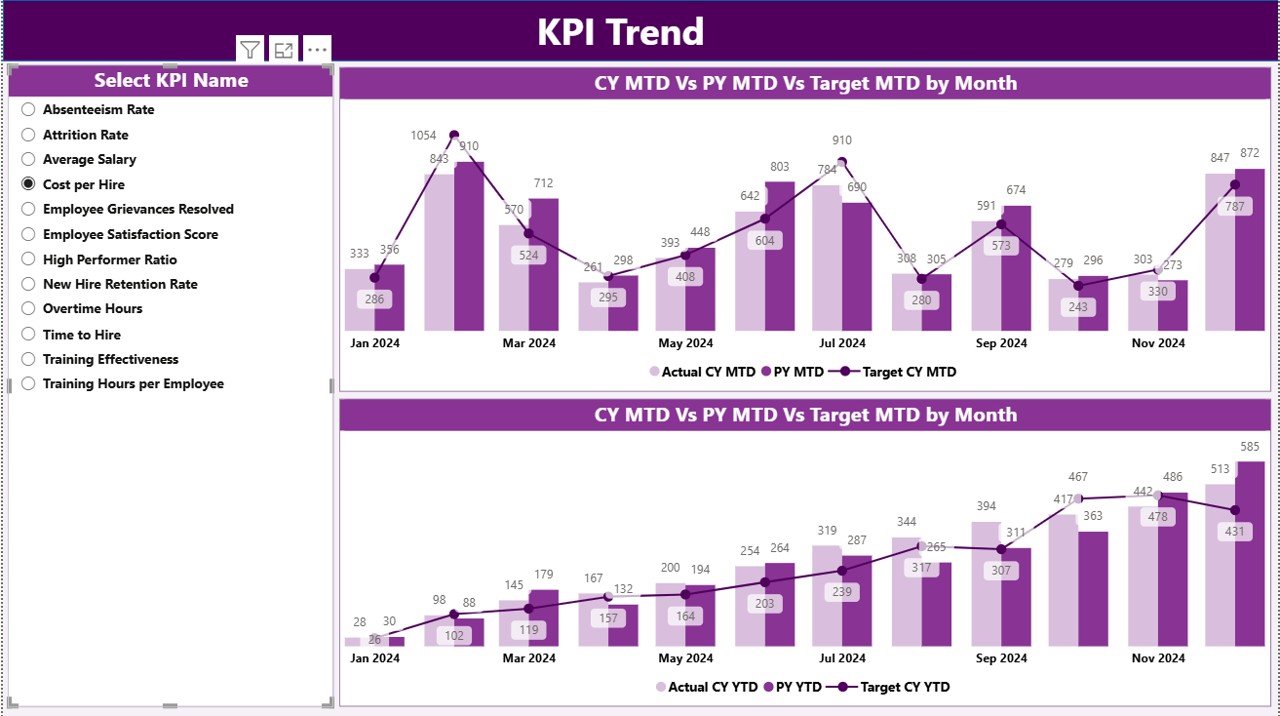
KPI Trend Page – Visual Comparison for MTD and YTD
Trends help HR teams understand direction, not just numbers. This page shows performance movement for each KPI.
What this page includes
Combo chart for MTD
- Shows Current Year Actual, Target, and Previous Year values
Combo chart for YTD
- Compares YTD Actual, Target, and Previous Year numbers
Slicer by KPI Name
You can choose any KPI from the list and instantly view its trend.
This page helps HR managers answer questions like:
- How is absenteeism trending this year?
- Are training hours improving?
- Is the hiring pipeline performing better than last year?
- Do salary costs match the budget trend?
Because the visuals update with every selection, HR teams get accurate insights instantly.
Click to buy Human Resources (HR) KPI Dashboard in Power BI
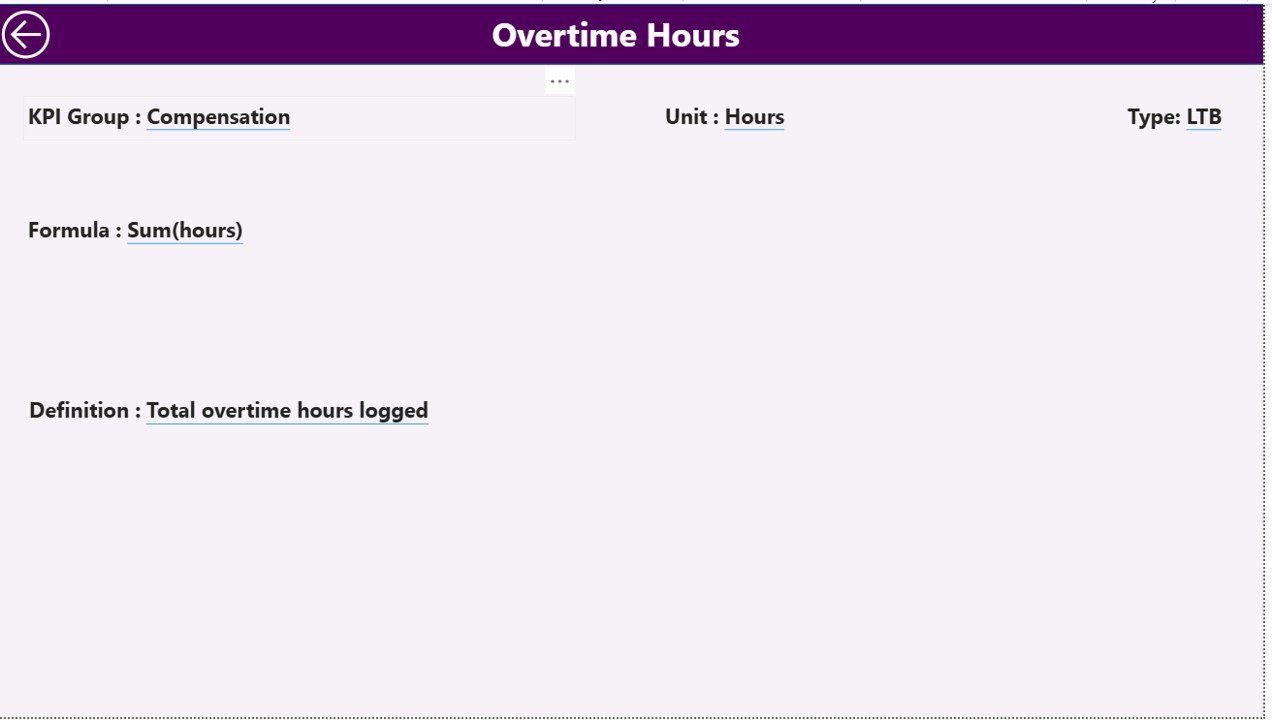
KPI Definition Page – Detailed Understanding of Each KPI
This page is hidden and works as a drill-through page. When you click a KPI on the Summary Page, you can drill through to see:
- KPI Number
- KPI Group
- KPI Name
- Formula
- Unit
- Type (UTB/LTB)
- Definition
The page also includes a Back button at the top left to return to the main summary view.
This page ensures every stakeholder understands the meaning of each KPI.
Click to buy Human Resources (HR) KPI Dashboard in Power BI
How the Excel Data File Works
The dashboard connects to an Excel file that includes three worksheets:
Input_Actual Sheet
Here you fill:
- KPI Name
- Date (first day of the month, e.g., 01-01-2024)
- MTD Actual
- YTD Actual
This sheet stores all actual performance values.
Input_Target Sheet
Here you store:
- KPI Name
- Month (first date of the month)
- MTD Target
- YTD Target
You only update targets once at the beginning of the year unless revised.
KPI Definition Sheet
This sheet includes:
- KPI Number
- KPI Group
- KPI Name
- Unit
- Formula
- Definition
- Type (UTB or LTB)
This ensures the dashboard maintains clarity and consistency.
Advantages of an HR KPI Dashboard in Power BI
Using a central HR dashboard creates many operational and strategic benefits. Here are the most important advantages.
You See the Whole HR Picture in One View
You no longer check multiple Excel sheets. The dashboard shows everything:
- Hiring
- Training
- Attendance
- Payroll
- Performance
- Diversity
- Retention
- Engagement
This full picture improves HR planning and decision-making.
You Make Faster Decisions
Because the dashboard updates instantly, HR teams spend less time collecting data and more time taking action.
For example:
- If absenteeism increases, the team can take action immediately.
- If hiring falls behind, recruiters can plan better outreach.
Quick insights lead to quick decisions.
You Track Targets and Performance Easily
The dashboard compares actual values with targets for both MTD and YTD.
The green ▲ and red ▼ indicators help HR managers see:
- Which KPIs perform well
- Where performance drops
- Which areas need urgent improvement
This brings clarity to the entire workforce strategy.
- You Review Past Performance with Ease
With PY MTD and PY YTD comparisons, HR leaders learn:
- Whether the team improved
- How trends shifted
- Which areas need long-term attention
It helps create better strategies for future HR planning.
- You Improve Communication With Management
The dashboard presents clean charts and tables. Leaders and CEOs want clear insights, not complex spreadsheets. This dashboard:
- Communicates performance visually
- Simplifies reporting
- Helps in monthly review meetings
- Supports data-driven HR proposals
HR teams earn more trust when insights are clear.
- You Reduce Manual Work and Improve Accuracy
Power BI automates calculations and updates. HR teams reduce manual work related to:
- Month-end reports
- Excel formulas
- Manual comparisons
- KPI status checking
As a result, accuracy increases and errors reduce.
Best Practices for the HR KPI Dashboard in Power BI
You get the best results when you follow these practices:
- Keep All KPI Definitions Clear
Every KPI should have:
- A clear formula
- A simple definition
- A unique KPI number
- A consistent measurement method
This avoids confusion and ensures accuracy.
- Update Actual Data Every Month
Always enter new MTD and YTD values in the Input_Actual sheet.
When the dashboard refreshes:
- Comparison becomes correct
- KPIs stay up-to-date
- Decision-making stays accurate
- Review Target Values Regularly
Targets should stay realistic. If the business situation changes, revise target values in the Input_Target sheet.
- Use KPI Groups for Better Organisation
Group KPIs under:
- Recruitment
- Workforce
- Training
- Payroll
- Engagement
- Compliance
- Performance
This improves filtering and clarity.
- Analyze Trends, Not Just Numbers
Trend charts help HR understand:
- Whether KPIs improve
- Which areas need urgent focus
- How performance changes month by month
Always use the KPI Trend page for deeper insight.
- Use Drill-Through for Detailed Understanding
The KPI Definition page gives clarity on formulas and meanings. Use it whenever you need to explain KPIs to management.
- Keep the Excel File Clean and Structured
A clean file ensures the dashboard runs correctly:
- No blank KPI names
- Consistent date formats
- Accurate MTD and YTD values
- Correct UTB/LTB type
Data hygiene is important.
How HR Teams Use This Dashboard in Real Life
Here are examples of how different HR departments use it:
- Recruitment Team
- Track hiring numbers
- Measure time-to-fill
- Monitor offer acceptance rate
- Compare recruitment targets vs achievements
- Learning & Development Team
- Track training hours
- Monitor certification success rate
- Review training budget spent vs planned
- Payroll Team
- Review salary cost trends
- Compare payroll accuracy
- Monitor overtime expenses
- Employee Relations Team
- Track employee satisfaction
- Review complaints and resolution time
- Monitor absenteeism or late arrivals
- HR Leadership
- Review overall workforce trends
- Track headcount movement
- Analyse the impact of HR strategy
- Present insights during management reviews
Because the dashboard is simple and visual, every part of the HR team uses it easily.
Conclusion
A Human Resources (HR) KPI Dashboard in Power BI transforms the way HR teams work. It brings all HR metrics together, shows trends, compares performance with targets, and helps managers take fast decisions. With automated visuals and dynamic filtering, HR teams stop wasting time on manual reports. They focus on what matters: building a strong, productive, and engaged workforce.
Since Power BI offers clarity and automation, HR departments move from traditional reporting to modern, data-driven workforce management.
Frequently Asked Questions (FAQs)
- What is an HR KPI Dashboard in Power BI?
It is an interactive reporting system that tracks HR performance indicators using visuals, charts, and automated calculations in Power BI.
- Which HR metrics can I track in this dashboard?
You can track recruitment, training, employee engagement, payroll accuracy, absenteeism, turnover, diversity, productivity, and more.
- Do I need advanced Power BI skills to use this dashboard?
No. The dashboard works automatically. You only update the Excel source file.
- What data do I need to maintain?
You must update the Input_Actual, Input_Target, and KPI Definition sheets every month.
- Can I customize KPI names and groups?
Yes. You can change or add KPIs based on your organization’s HR requirements.
- Does the dashboard compare performance with previous years?
Yes. It shows PY MTD and PY YTD comparisons for all KPIs.
- Can I drill through to see KPI definitions?
Yes. The hidden KPI Definition page provides formula, definition, and type details.
- Can I share this dashboard with management?
Yes. You can publish it to Power BI Service and share it with leadership teams.
Visit our YouTube channel to learn step-by-step video tutorials
Watch the step-by-step video tutorial:
Click to buy Human Resources (HR) KPI Dashboard in Power BI