Security plays a critical role in every organization. Whether you protect physical assets, digital systems, confidential files, or large-scale operations, you must monitor the right metrics at the right time. When security teams track their KPIs in a manual or scattered way, they miss patterns, overlook risks, and struggle to improve performance.
A Security KPI Dashboard in Power BI solves this problem. It gives you a clear, interactive, and real-time view of your security operations. Because the dashboard uses automation, slicers, and smart calculations, you always stay informed and ready to act.
In this detailed guide, you will learn everything about this dashboard—its structure, features, benefits, and best practices. You will also understand how Power BI transforms raw data into meaningful insights for security teams.
Click to buy Security KPI Dashboard in Power BI
What Is a Security KPI Dashboard in Power BI?
A Security KPI Dashboard in Power BI is an interactive reporting tool that tracks essential security metrics such as incident counts, response times, compliance scores, patrol coverage, access control performance, system failures, and preventive activities.
The dashboard converts raw numbers from an Excel file into charts, tables, scorecards, and trend visuals. As a result, security managers get real-time visibility across all areas of security operations.
This dashboard helps you:
- Track Monthly Trends (MTD)
- Compare Year-to-Date (YTD) numbers
- Measure performance against targets
- Analyze current vs previous-year progress
- Drill through KPI definitions and formulas
- Review incident performance patterns with slicers
Because the dashboard works inside Power BI, you can refresh data anytime and share insights across your team.
Why Do Organizations Need a Security KPI Dashboard?
Every day, companies deal with many security-related activities—incident handling, access control monitoring, guard management, shift scheduling, patrol operations, emergency response, and compliance audits. When you track these tasks manually, you lose clarity and accuracy.
A Security KPI Dashboard in Power BI brings everything together in one place, which helps you:
- Monitor trends in real-time
- Reduce response time
- Improve compliance
- Increase team accountability
- Identify risks early
- Make better decisions
Security leaders rely on KPIs, and this dashboard gives them a simple, clean, and automated solution.
Key Features of the Security KPI Dashboard in Power BI
This dashboard includes three fully designed pages, each with a unique purpose. You can move between these pages through navigation buttons and slicers.
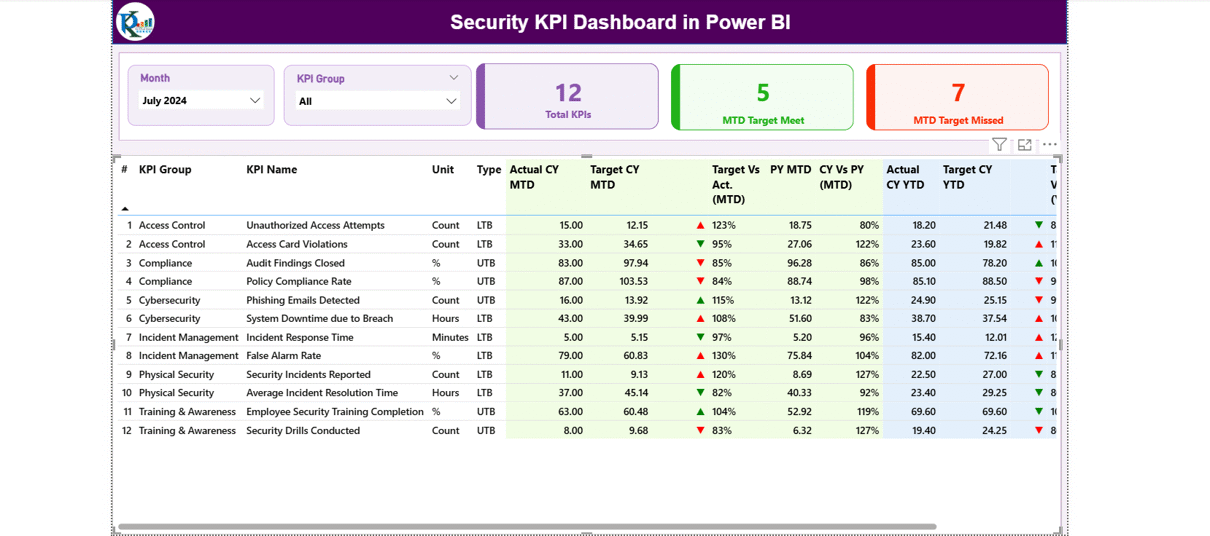
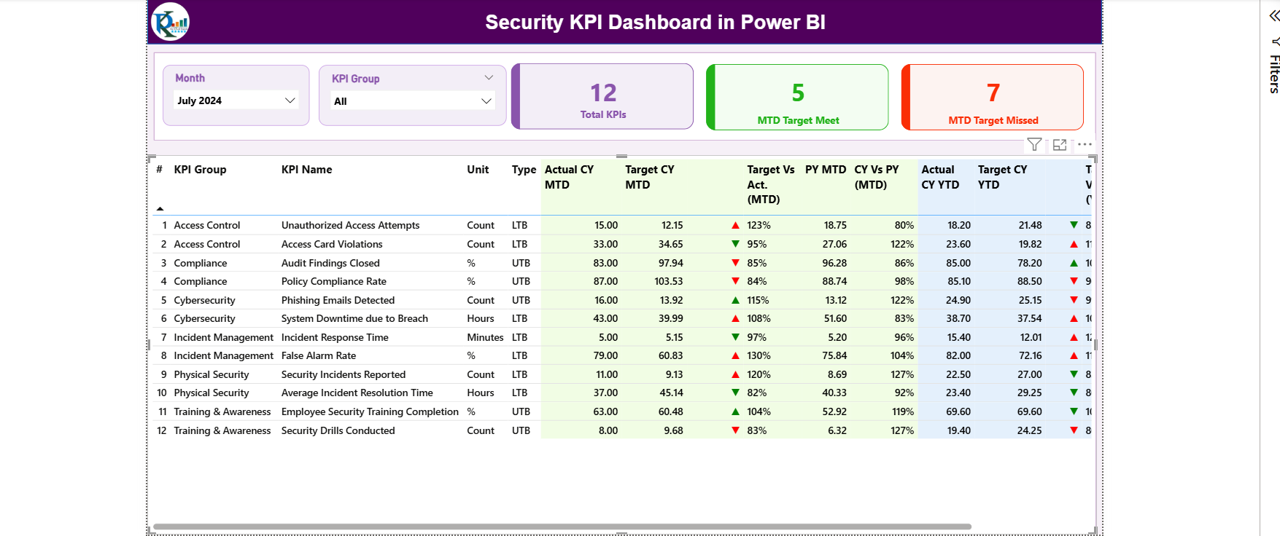
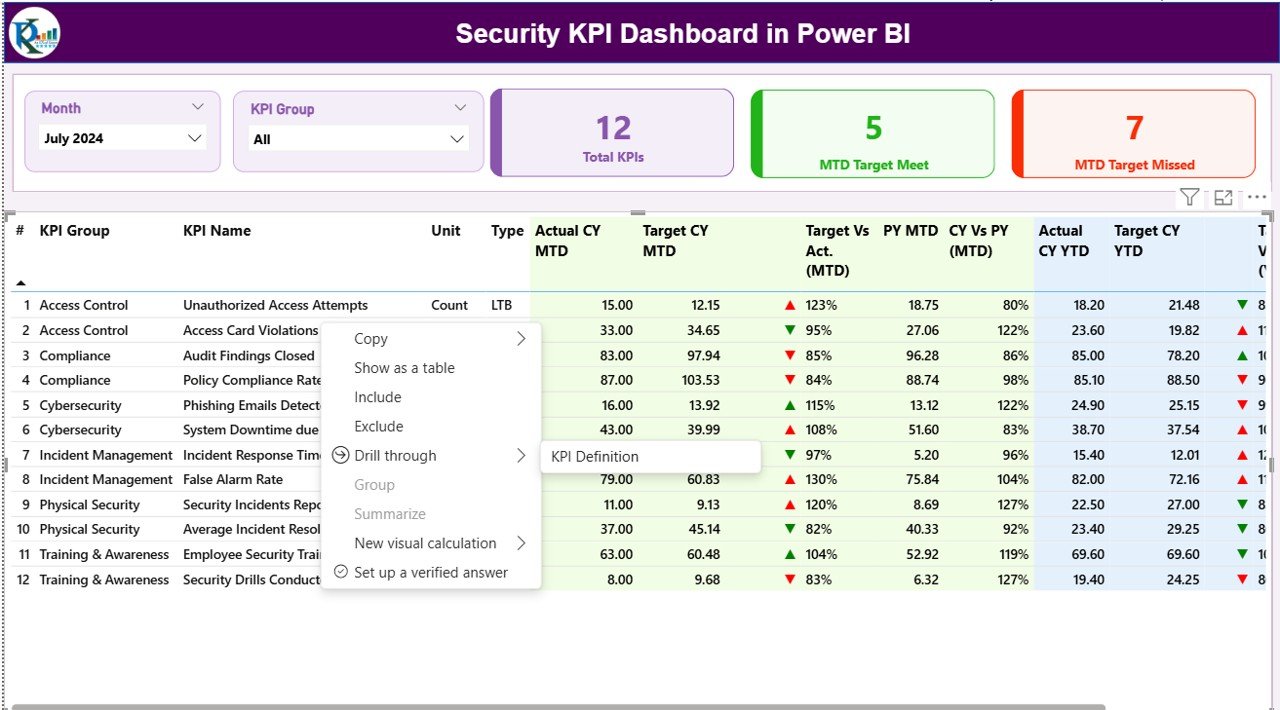
Summary Page – Complete View of Security Performance
The Summary Page acts as the main control panel of the dashboard. It includes filters, cards, tables, icons, and comparison metrics.
Highlights of the Summary Page
✔ Month Slicer – Select the month and view all KPIs for that period.
✔ KPI Group Slicer – Choose KPI categories such as Incident KPIs, Access Control KPIs, Patrol KPIs, Safety KPIs, Cybersecurity KPIs, Compliance KPIs, etc.
Cards Display Key Performance Numbers
You will see three high-level cards:
- Total KPIs
- MTD Target Met KPIs
- MTD Target Missed KPIs
These cards help you understand performance status instantly.
Detailed KPI Table
The summary table provides deep insights into every KPI. It includes:
- KPI Number – Unique sequence number
- KPI Group – Category of the KPI
- KPI Name – Security metric
- Unit – Measurement unit (hours, %, count, etc.)
- Type (LTB/UTB)
- LTB = Lower the Better
- UTB = Upper the Better
MTD Insights (Month-to-Date)
The dashboard shows:
- Actual CY MTD
- Target CY MTD
- MTD Icon (▲ or ▼) – Indicates performance
- Target vs Actual (MTD%)
- PY MTD – Last year’s MTD value
- CY vs PY (MTD%) – Performance comparison
These values help you check if security operations are improving month by month.
YTD Insights (Year-to-Date)
The table also shows:
- Actual CY YTD
- Target CY YTD
- YTD Icon (▲ or ▼)
- Target vs Actual (YTD%)
- PY YTD
- CY vs PY (YTD%)
This section gives a clear picture of long-term security performance.
Click to buy Security KPI Dashboard in Power BI
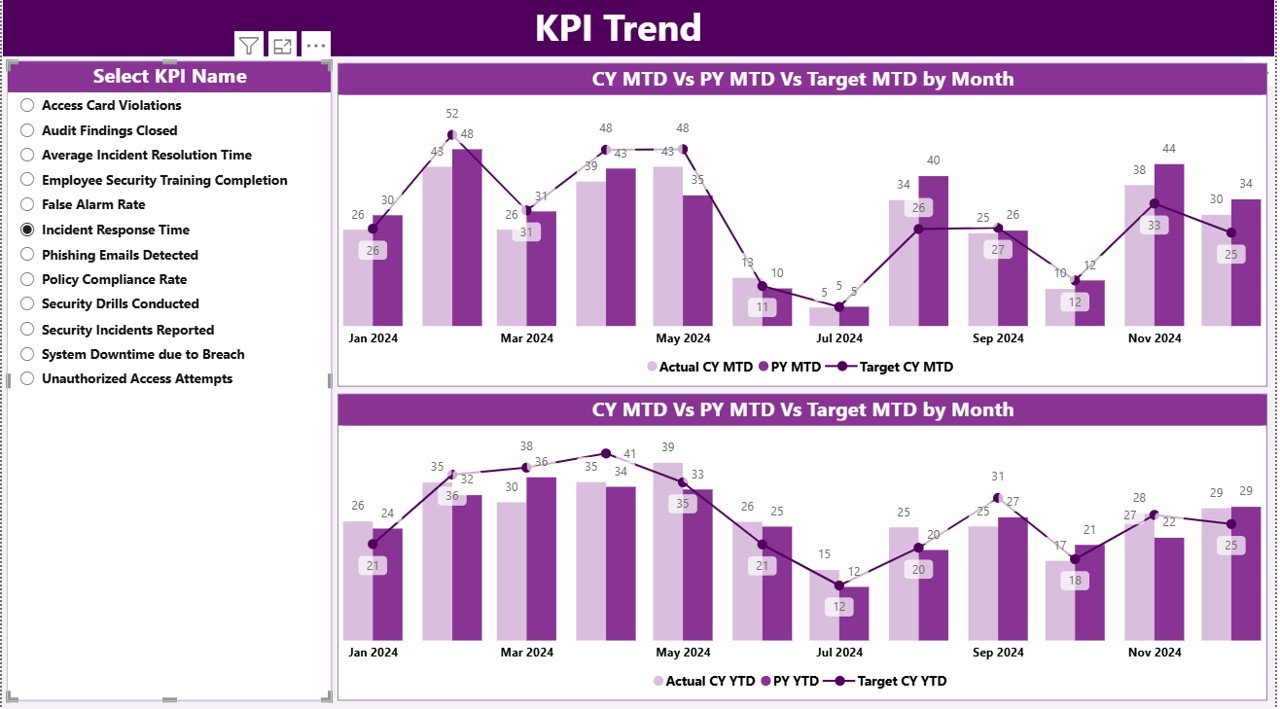
KPI Trend Page – Complete Trend Analysis
The KPI Trend Page displays two combo charts:
MTD Trend Chart
Shows:
- Current Year MTD Actual
- Previous Year MTD Actual
- Target MTD
YTD Trend Chart
Shows:
- Current Year YTD Actual
- Previous Year YTD Actual
- Target YTD
KPI Slicer
You can select a specific KPI to analyze trends over time. This feature helps security teams understand:
- Whether performance is moving in the right direction
- How current numbers compare to last year
- How far the numbers are from the target
This page plays a key role in data-driven decision-making.
Click to buy Security KPI Dashboard in Power BI
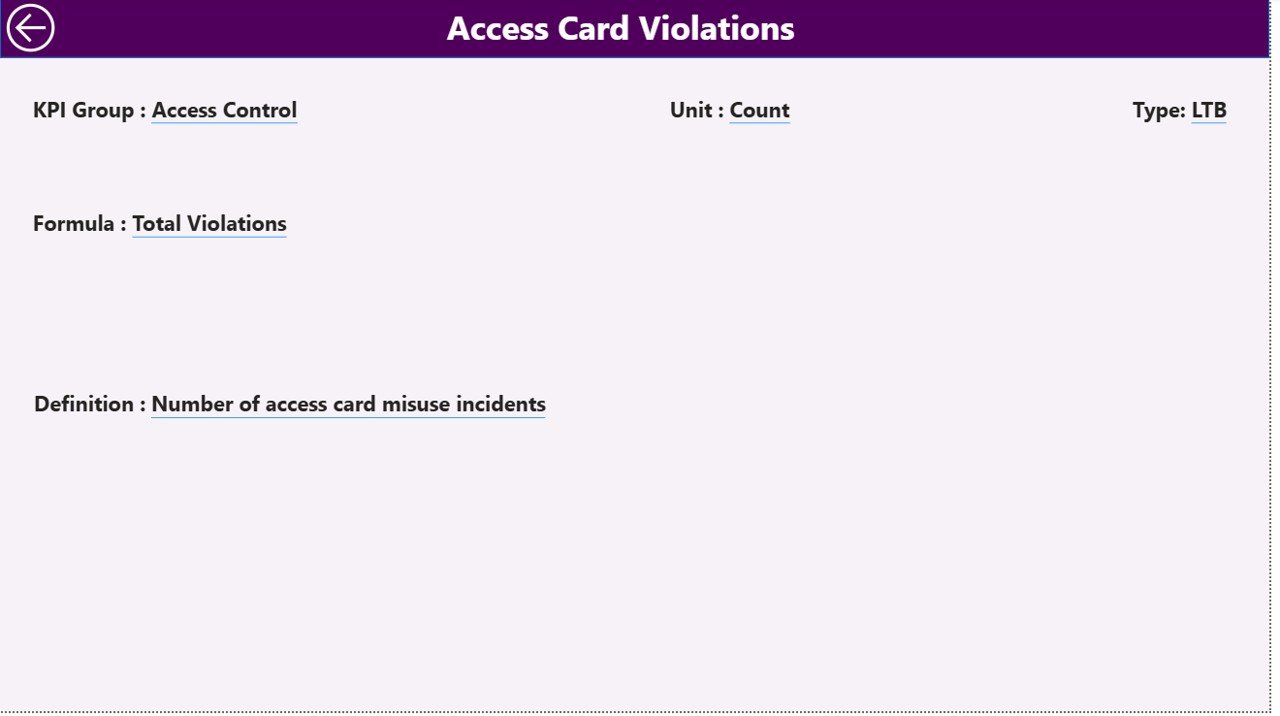
KPI Definition Page – Complete KPI Knowledgebase
The KPI Definition Page works as a drill-through page. It stays hidden in the main view, but you can access it when needed.
Here you can see:
- KPI Number
- KPI Group
- KPI Name
- Unit
- KPI Formula
- Detailed Definition
- Type (LTB or UTB)
This helps security teams understand:
- How KPIs work
- How values are calculated
- What every KPI represents
Users can return to the Summary Page by clicking the “Back” button.
Click to buy Security KPI Dashboard in Power BI
Excel Data Structure for the Security KPI Dashboard
This dashboard uses an Excel file as the data source. The file includes three input sheets:
Input_Actual Sheet
Fill this sheet with:
- KPI Name
- Month (use the first date of every month)
- Actual MTD value
- Actual YTD value
This sheet stores actual performance numbers.
Input_Target Sheet
Enter:
- KPI Name
- Month
- Target MTD value
- Target YTD value
This sheet stores performance goals.
KPI Definition Sheet
Enter details such as:
- KPI Number
- KPI Group
- KPI Name
- Unit
- Formula
- Definition
- KPI Type (LTB or UTB)
This sheet acts as the master data for the dashboard.
What KPIs Can You Track in a Security KPI Dashboard?
Every organization adjusts KPIs based on their operations. However, most security teams track the following:
Incident Management KPIs
- Number of incidents
- Incident severity level
- Incident resolution time
- First response time
Access Control KPIs
- Unauthorized access attempts
- Access card failure count
- Visitor entry compliance %
- Badge issuance time
Guard & Patrol KPIs
- Patrol completion %
- Missed patrols
- Guard punctuality
- Shift readiness score
Compliance & Audit KPIs
- Audit compliance %
- Safety drill performance
- Policy violation count
Cyber & System KPIs
- System downtime
- Cyber alerts handled
- Threat detection rate
Emergency KPIs
- Response team readiness
- Emergency drill score
This dashboard handles all KPI types with accuracy.
Advantages of a Security KPI Dashboard in Power BI
A Power BI dashboard brings many benefits to your security operations. Here are the major advantages:
- Real-Time Security Insights
You see security data in real time. This helps you react quickly to risks, incidents, or compliance failures.
- Trend Analysis for Better Decision-Making
With MTD and YTD trend charts, you can see:
- If performance improves
- Which KPIs need attention
- Where gaps exist
This helps you plan smarter strategies.
- Faster Response and Reduced Risks
When teams track KPIs daily, they identify issues early. As a result, they take actions faster and reduce major risks.
- Better Compliance and Audit Readiness
A security dashboard helps you monitor all areas, which improves compliance and audit scores.
- Simplified Reporting for Leadership
Security managers spend less time creating reports. Power BI automatically updates visuals and calculations.
- Improved Accountability Across Teams
With clear KPIs and performance icons, teams know where they stand. This motivates them to improve performance.
Best Practices for Using a Security KPI Dashboard in Power BI
Follow these best practices to get maximum value from your dashboard:
- Define Clear KPI Formulas
Use simple and standard formulas. This helps everyone understand KPI logic.
- Use LTB and UTB Labels Correctly
- Use Lower the Better for metrics like incident count or downtime.
- Use Upper the Better for metrics like patrol completion or compliance %.
- Update Excel Files Monthly
Keep your input data fresh. Updated data leads to accurate insights.
- Use Slicers for Quick Analysis
Filters help you:
- Compare months
- Compare KPI groups
- Focus on specific KPIs
- Review MTD vs YTD Regularly
This helps you track current progress and long-term performance together.
- Use Drill-Through for Detailed Understanding
KPI definitions help you understand formulas, logic, and performance interpretation.
How Power BI Helps Improve Security Management
Power BI transforms manual security reporting into a modern, real-time decision system. Because it automates calculations and uses visually rich charts, it helps you:
- Identify threats early
- Improve operational efficiency
- Maintain compliance
- Increase transparency
- Strengthen reporting accuracy
Security operations become more predictable and efficient when you use Power BI dashboards.
Conclusion
A Security KPI Dashboard in Power BI is one of the most powerful tools for security teams. It combines data, analytics, and automation to help you monitor incidents, access control, patrol performance, compliance, and emergency readiness.
With its Summary Page, Trend Analysis Page, and KPI Definition Page, this dashboard gives you everything you need to make smart decisions. When you track KPIs actively, you reduce risks, improve safety, and strengthen overall security operations.
Frequently Asked Questions (FAQs)
- What is a Security KPI Dashboard in Power BI?
It is an interactive dashboard that tracks and analyzes key security metrics through charts, slicers, scorecards, and tables in Power BI.
- Who can use this dashboard?
Security managers, facility teams, compliance officers, operations leaders, and safety professionals can use this dashboard.
- What data source does the dashboard use?
The dashboard uses an Excel file with sheets for Actual Data, Target Data, and KPI Definitions.
- What KPIs can I track?
You can track incident management KPIs, guard KPIs, compliance KPIs, access control KPIs, and many more.
- Can I customize the dashboard?
Yes, you can modify KPI names, formulas, units, targets, and visuals according to your security needs.
- Does the dashboard show MTD and YTD values?
Yes, it displays MTD actual and target numbers, YTD actual and target numbers, and comparisons with previous year values.
- Does it include trend analysis?
Yes, the KPI Trend Page shows combo charts for both MTD and YTD.
- Can I drill through to see KPI formulas?
Yes, you can use the KPI Definition Page to see formulas and definitions for each KPI.
- How often should I update the data?
You should update the Excel input sheets monthly or as per your reporting cycle.
- What tools do I need to use this dashboard?
You need Microsoft Excel and Microsoft Power BI Desktop or Power BI Service.
Visit our YouTube channel to learn step-by-step video tutorials
Watch the step-by-step video tutorial:
Click to buy Security KPI Dashboard in Power BI