The textiles and apparel industry runs on accuracy, quality, and speed. Production lines move fast, customer demand changes often, and quality expectations rise every year. Because of this, manufacturers need a simple but powerful way to track performance, measure progress, and improve efficiency. A Textiles & Apparel Manufacturing KPI Dashboard in Excel solves this need.
This article explains everything you must know about this dashboard. You will learn how it works, how each worksheet supports your reporting process, and how this template helps teams take better decisions. You will also see the advantages, best practices, and answers to common questions.
Click to buy Textiles & Apparel Manufacturing KPI Dashboard in Excel
What Is a Textiles & Apparel Manufacturing KPI Dashboard in Excel?
A Textiles & Apparel Manufacturing KPI Dashboard in Excel is a ready-to-use performance tracking tool created for textile mills, garment factories, apparel exporters, and manufacturing teams. It converts raw operational data into simple visuals so users can understand performance within seconds.
It helps you track:
- Production efficiency
- Quality performance
- Material usage
- Order delivery
- Machine productivity
- Rework and wastage
- Monthly and yearly target achievement
- Cost trends and variations
- Safety and compliance indicators
Since it runs in Excel, you do not need any advanced software. You can load the data, select the month, and review all key performance indicators (KPIs) at a glance.
Why Do Textiles & Apparel Manufacturers Need a KPI Dashboard?
The textiles and apparel industry faces several challenges:
- High raw-material costs
- Rapid demand changes
- Quality issues
- Tight production deadlines
- Skilled-labor shortages
- Machine downtime
- High wastage and rework
Without a proper dashboard, teams spend long hours checking data manually. They collect information from different sheets, calculate KPIs, prepare reports, and create charts again and again. This wastes time and slows down decision-making.
A KPI Dashboard in Excel solves all these problems because it brings everything into one place. It shows MTD (Month-to-Date) and YTD (Year-to-Date) numbers, target achievement, historical comparison, and trends in one clean layout.
How Does the Textiles & Apparel Manufacturing KPI Dashboard in Excel Work?
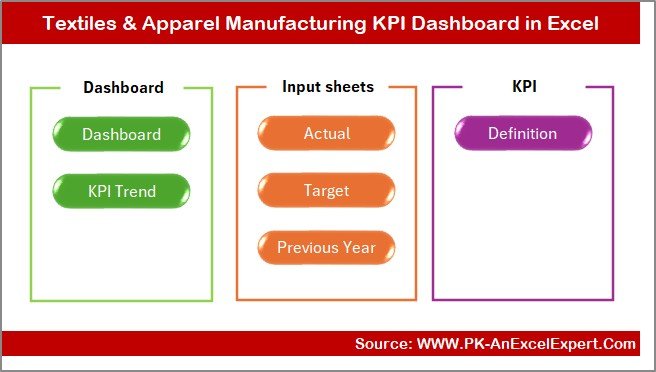
This dashboard includes 7 structured worksheets, and each sheet plays an important role. When you update the actual, target, or previous year numbers, the dashboard updates instantly.
Let us explore each worksheet in detail.
Summary Page – How Does the Index Page Help Users?
The Summary Page works as the main index of the dashboard. It helps users navigate the file with a single click.
This page includes six buttons that take you to different sheets in the dashboard.
Because of its simple layout, users can move to any analysis page instantly without scrolling through multiple sheets. This saves time and keeps reporting easy.
Click to buy Textiles & Apparel Manufacturing KPI Dashboard in Excel
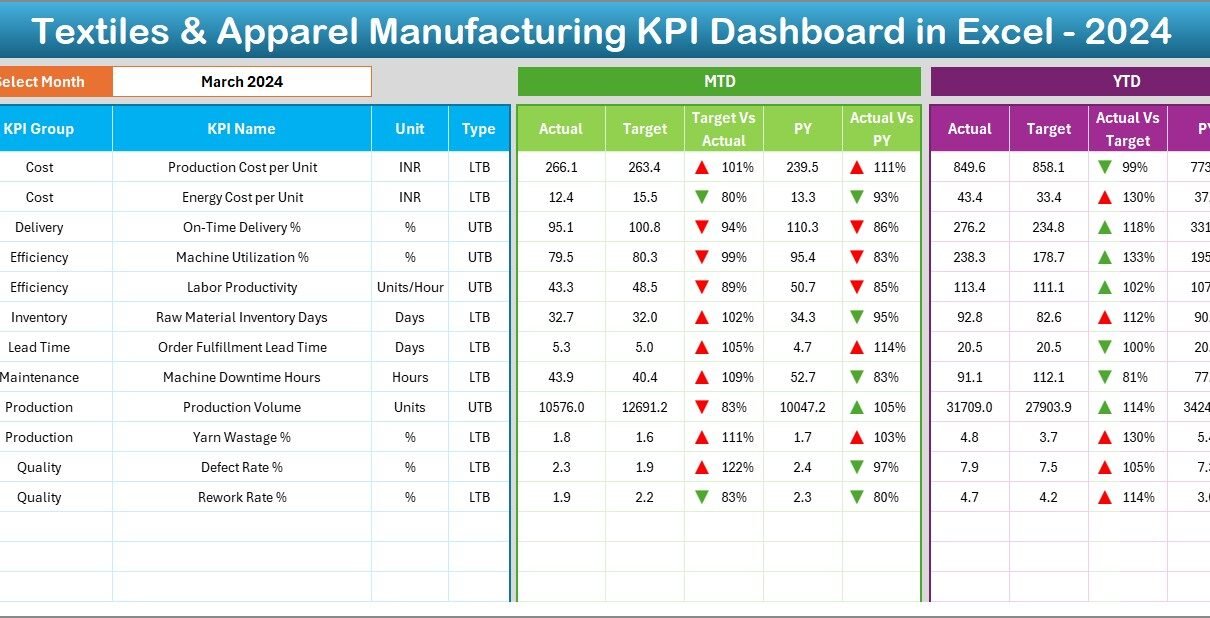
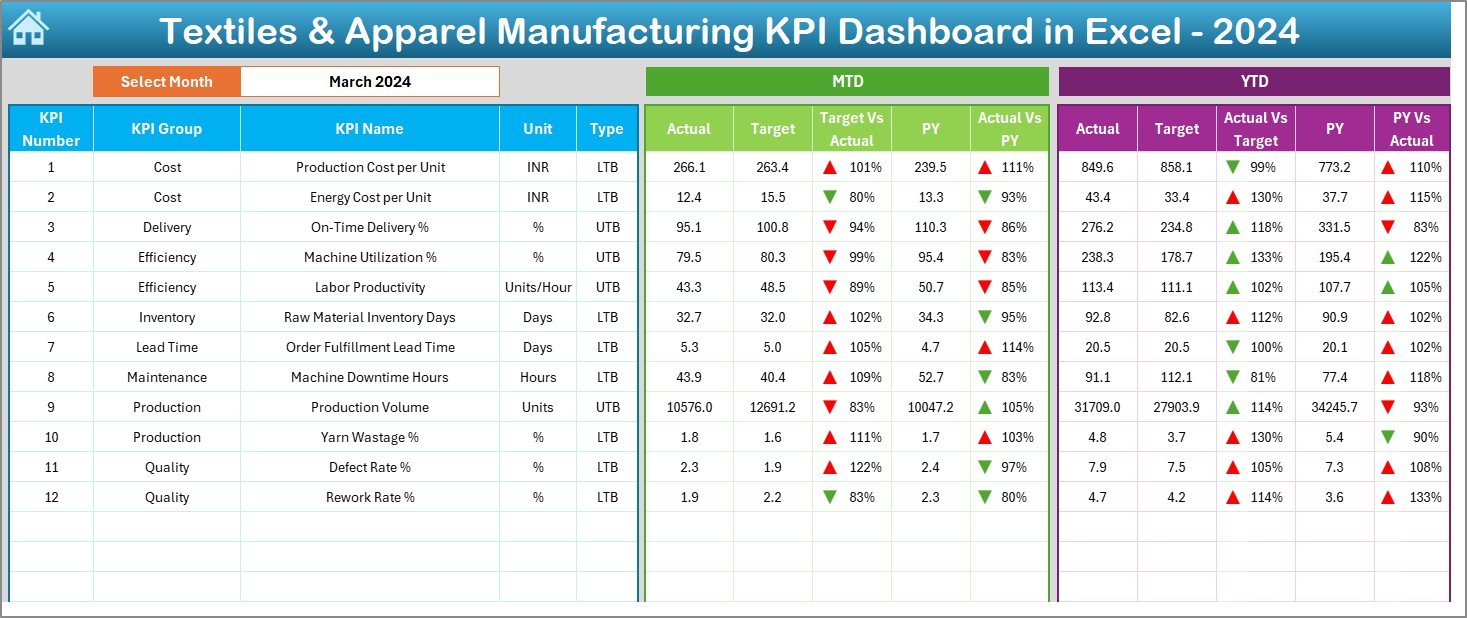
Dashboard Sheet – What Insights Does the Main Dashboard Provide?
The Dashboard Sheet is the heart of the entire system. It shows all KPIs in one view. You only need to choose the month from the drop-down list in cell D3, and the dashboard updates everything.
You will see:
MTD Actual, Target, and Previous Year Values
This compares current performance with:
- Monthly Target
- Last Year’s Same Month
YTD Actual, Target, and Previous Year Values
This shows cumulative performance across months.
Target vs Actual Performance
You can compare the real numbers with planned numbers.
PY vs Actual Comparison
This reveals whether performance improved or declined from last year.
Conditional Formatting Arrows
- Green upward arrow → performance improved
- Red downward arrow → performance declined
Because all metrics change with a single month selection, teams do not need to refresh formulas or charts manually. The dashboard prepares the complete report instantly.
Click to buy Textiles & Apparel Manufacturing KPI Dashboard in Excel
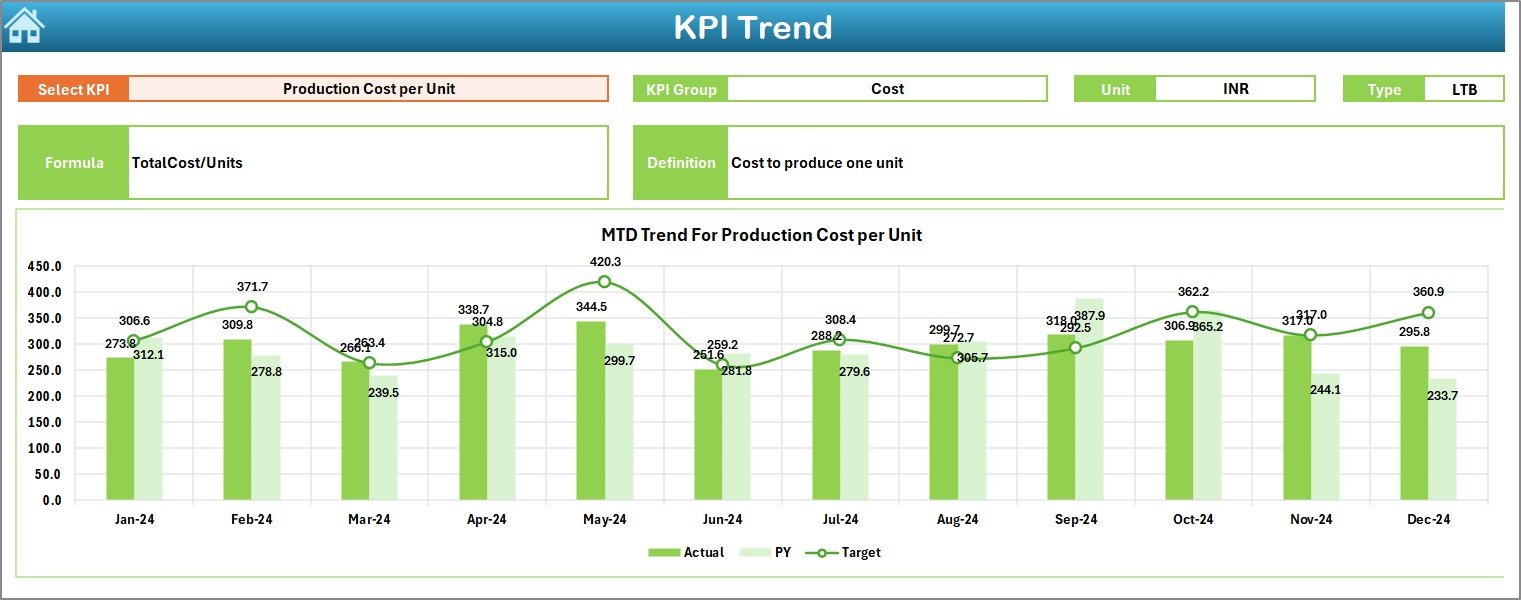
Trend Sheet – How Do KPI Trends Support Better Decisions?
The Trend Sheet gives deeper insight into how each KPI behaves across the year. You can pick any KPI from the drop-down in cell C3 and see trends for:
- MTD Actual
- MTD Target
- MTD Previous Year
- YTD Actual
- YTD Target
- YTD Previous Year
Before the charts, the sheet shows:
- KPI Group
- Unit of Measure
- KPI Type (Lower the Better or Upper the Better)
- Formula
- Definition
This helps users understand the logic behind each KPI.
The MTD and YTD charts show month-wise movement and help you identify:
- Growth trends
- Seasonal variations
- Declining performance
- Sudden improvements
- Efficiency gaps
- Issues in materials, machines, or processes
These insights guide managers in making quick improvements.
Click to buy Textiles & Apparel Manufacturing KPI Dashboard in Excel
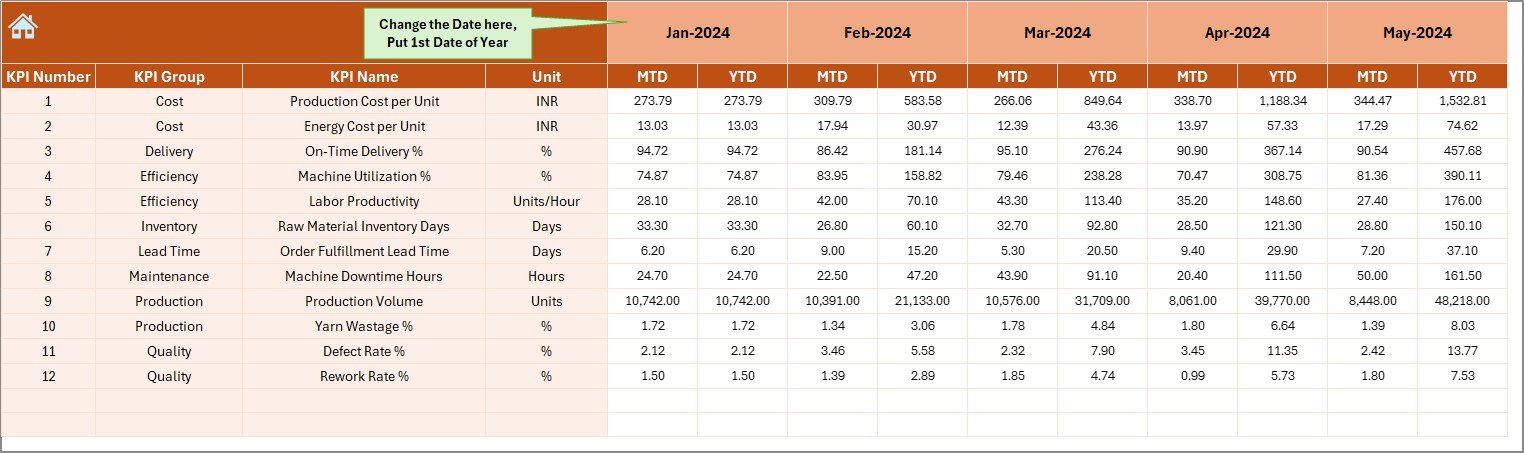
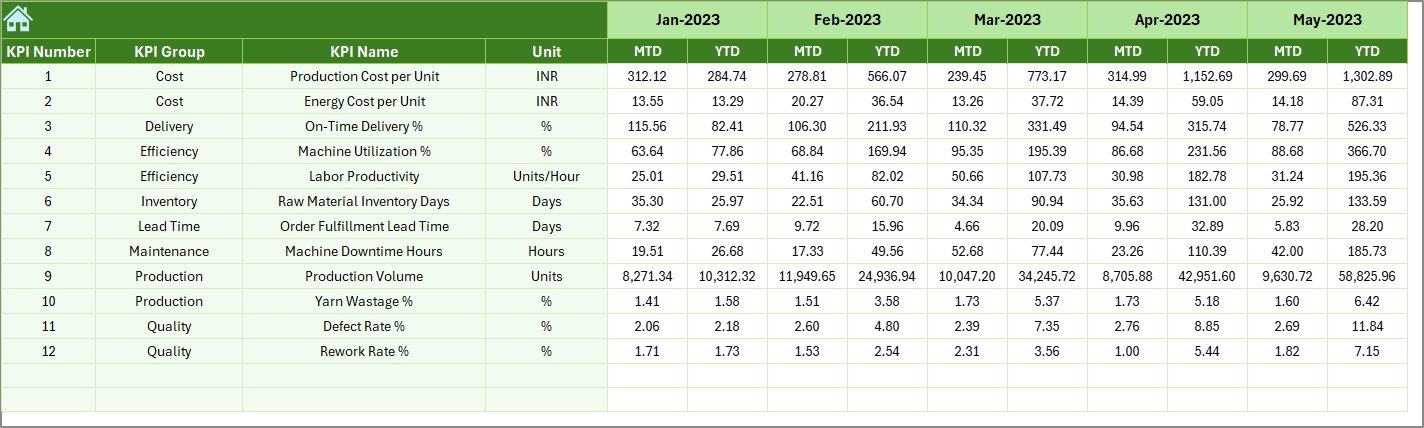
Actual Numbers Input Sheet – Why Is Accurate Data Entry Important?
The Actual Numbers Input sheet is the backbone of the dashboard. You enter the performance data for each month here.
You can set the first month of the year in cell E1. After this, the dashboard automatically adjusts all KPIs according to the selected month.
This sheet includes:
- MTD Actual
- YTD Actual
Because data entry is simple, the sheet reduces errors and improves reporting accuracy.
Target Sheet – How Does Target Setting Improve Manufacturing Results?
The Target Sheet allows you to enter monthly goals for each KPI. It includes:
- MTD Target
- YTD Target
Clear targets help teams understand the expected performance and allow easy comparison with actual numbers.
Targets support:
- Capacity planning
- Production planning
- Labor planning
- Cost control
- Quality improvement
- Machine maintenance schedules
When teams compare Actual vs Target, they stay focused on improving performance.

Click to buy Textiles & Apparel Manufacturing KPI Dashboard in Excel
Previous Year Numbers Sheet – Why Does Historical Comparison Matter?
This sheet stores previous year values for each KPI. Comparing current performance with last year helps understand:
- Growth rate
- Efficiency improvements
- Cost reductions
- Productivity trends
- Quality changes
- Seasonal patterns
Historical data also helps identify:
- Repeated problems
- Wastage trends
- Machine downtime cycles
- Order delivery delays
These insights help teams plan better.
KPI Definition Sheet – Why Do KPI Definitions Improve Clarity?
The KPI Definition Sheet includes:
- KPI Name
- KPI Group
- Unit
- Formula
- Definition
- Type (UTB or LTB)
It helps standardize the KPIs so every department understands them the same way.
This avoids confusion and ensures correct reporting.

What KPIs Can You Track Using This Dashboard?
This dashboard can track almost any KPI used in textile and apparel manufacturing. Some examples include:
- Production Volume
- Efficiency %
- Order Fulfillment %
- Fabric Utilization %
- Rejection Rate %
- Rework Cost
- Machine Downtime Hours
- Delivery Lead Time
- On-Time Delivery %
- Quality Score %
- Energy Consumption
- Labor Productivity
- Production Cost per Unit
Because the template is flexible, you can add more KPIs easily.
Advantages of Textiles & Apparel Manufacturing KPI Dashboard in Excel
A dashboard delivers many benefits for production teams, quality teams, top management, and planners. Some strong advantages include:
- Faster Decision-Making
Teams get real-time visibility of performance and take action quickly.
- Improved Productivity
Managers see which processes slow down production and fix them.
- Better Quality Control
Teams track rejections, rework, defects, and quality ratios with ease.
- Lower Wastage and Cost
Material usage, scrap percentage, and errors become clear.
- Accurate Reporting
All data stays in one file, so reporting stays consistent.
- Easy to Use
Anyone who knows Excel can use this dashboard without training.
- Clear Trend Analysis
MTD and YTD charts reveal performance changes month by month.
- Better Planning
Targets and historical comparisons support better planning.
- Enhanced Efficiency
Conditional formatting helps teams see performance changes instantly.
- One-Click Reporting
Managers can prepare reports for review meetings in minutes.
How to Use This KPI Dashboard Effectively?
Follow these steps:
- Open the dashboard file.
- Go to the Actual Numbers Input Sheet.
- Enter MTD and YTD values for each KPI.
- Go to the Target Sheet and add monthly goals.
- Enter previous year numbers.
- Go to the Dashboard Sheet.
- Select a month from D3.
- Review all KPIs, charts, and comparisons.
- Use the Trend Sheet for deeper insight.
This process keeps reporting simple and accurate.
Best Practices for the Textiles & Apparel Manufacturing KPI Dashboard in Excel
To get the best results from this dashboard, follow these best practices:
Refresh Data Regularly
Update actual numbers at the end of every production cycle.
Set Realistic Targets
Targets should reflect capacity, labor strength, and available resources.
Keep KPI Definitions Clear
Make sure all departments follow the same definitions.
Track Both MTD and YTD
Short-term and long-term analysis improves accuracy.
Use Trend Analysis for Forecasting
Trends help predict future performance.
Check Target vs Actual Every Week
This keeps teams alert and improves discipline.
Compare with Previous Year Data
This reveals long-term improvement.
Avoid Manual Calculations
Use formulas to reduce mistakes.
Review Dashboard in Review Meetings
Share insights with leadership and shop-floor teams.
Keep the File Clean
Do not add unnecessary sheets or complex formulas.
Conclusion
A Textiles & Apparel Manufacturing KPI Dashboard in Excel brings clarity, speed, and accuracy to manufacturing performance tracking. It helps teams understand their production, quality, cost, and efficiency trends with one click. Because it uses simple Excel functions, anyone can use it without learning new software.
When teams track the right KPIs, set clear targets, and compare performance with previous years, they improve productivity and reduce wastage. This dashboard supports continuous improvement and helps manufacturers stay competitive in a fast-changing market.
Frequently Asked Questions (FAQs)
- What is a KPI in textiles and apparel manufacturing?
A KPI is a measurable indicator that shows how well production, quality, or operations perform.
- Why should manufacturers use an Excel KPI dashboard?
Because Excel dashboards help track performance easily without complex tools.
- Can I add more KPIs to this dashboard?
Yes, the template allows adding unlimited KPIs.
- Does the dashboard update automatically?
Yes, once you enter the data, the dashboard updates instantly.
- Can beginners use this dashboard?
Yes, it is easy to use and needs only basic Excel knowledge.
- What data should I enter first?
Start with actual numbers, then add targets and previous year values.
- Why do we track MTD and YTD separately?
MTD shows monthly performance, while YTD shows cumulative progress.
- Does the template include trend charts?
Yes, the Trend Sheet has MTD and YTD trend charts.
- Can managers use this dashboard for review meetings?
Yes, the clean layout makes it ideal for management reporting.
- Is this dashboard suitable for both textiles and apparel units?
Yes, it works for mills, factories, exporters, and stitching units.
If you’d like, I can also create:
Visit our YouTube channel to learn step-by-step video tutorials
Watch the step-by-step video tutorial:
Click to buy Textiles & Apparel Manufacturing KPI Dashboard in Excel