The fintech industry grows fast, and every company wants to make quick and smart decisions. Teams need real-time insights to track growth, revenue, user activity, compliance, cost, and risk. However, fintech data usually sits across many tools and reports. Because of this, teams struggle to monitor the right KPIs at the right time.
A Fintech KPI Dashboard in Power BI solves this problem. It brings all key financial, operational, customer, and compliance metrics into one simple and interactive dashboard. Users can view instant reports, compare performance, and take action without wasting time.
This article explains everything about the Fintech KPI Dashboard in Power BI. You will learn its structure, key pages, features, benefits, best practices, and FAQs. So, let us explore how this dashboard helps fintech companies transform decision-making.
Click to buy Fintech KPI Dashboard in Power BI
What Is a Fintech KPI Dashboard in Power BI?
A Fintech KPI Dashboard in Power BI is a ready-to-use reporting system that tracks essential performance indicators of fintech companies. It shows the Month-to-Date (MTD) and Year-to-Date (YTD) progress for each KPI and highlights the target vs actual performance.
You can track metrics such as:
- Revenue growth
- Active users
- Loan disbursement
- Wallet load values
- Compliance scores
- Transaction success rate
- Customer acquisition
- NPA (Non-Performing Assets)
- Risk exposure
The dashboard runs inside Power BI, so teams can explore reports using filters, drill-down features, slicers, and charts. It gives a full picture of business performance within seconds.
Why Do Fintech Companies Need a KPI Dashboard?
Fintech companies deal with huge volumes of real-time financial transactions. These numbers change every second, and teams need a way to track these changes smoothly. A KPI dashboard helps companies monitor performance with clarity and make better decisions.
You need this dashboard because:
- It increases transparency
- It helps track revenue and cost
- It improves compliance monitoring
- It reduces reporting time
- It supports better forecasting
- It helps identify risk early
- It improves customer satisfaction
- It simplifies data entry and tracking
Now let us look at the structure and components of this dashboard.
Key Features of the Fintech KPI Dashboard in Power BI
The Fintech KPI Dashboard includes three main pages, each built to give a complete view of performance. The design is simple, clean, and easy for any user to understand.
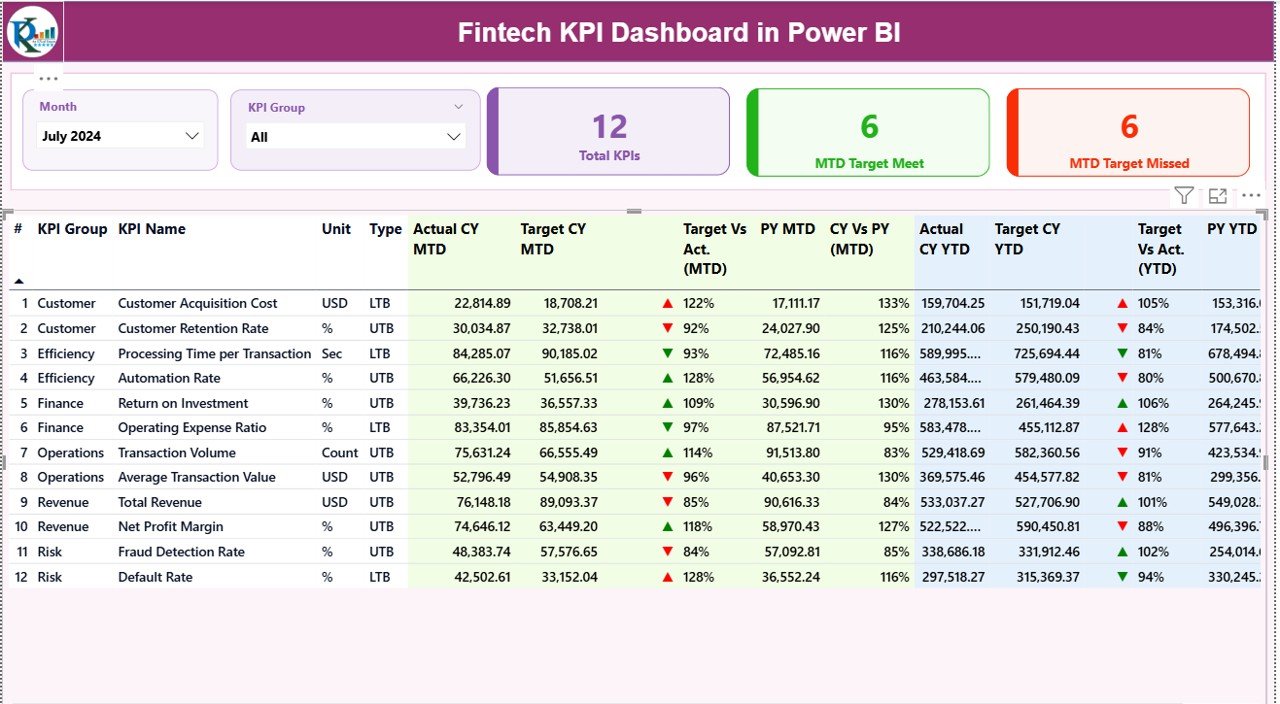
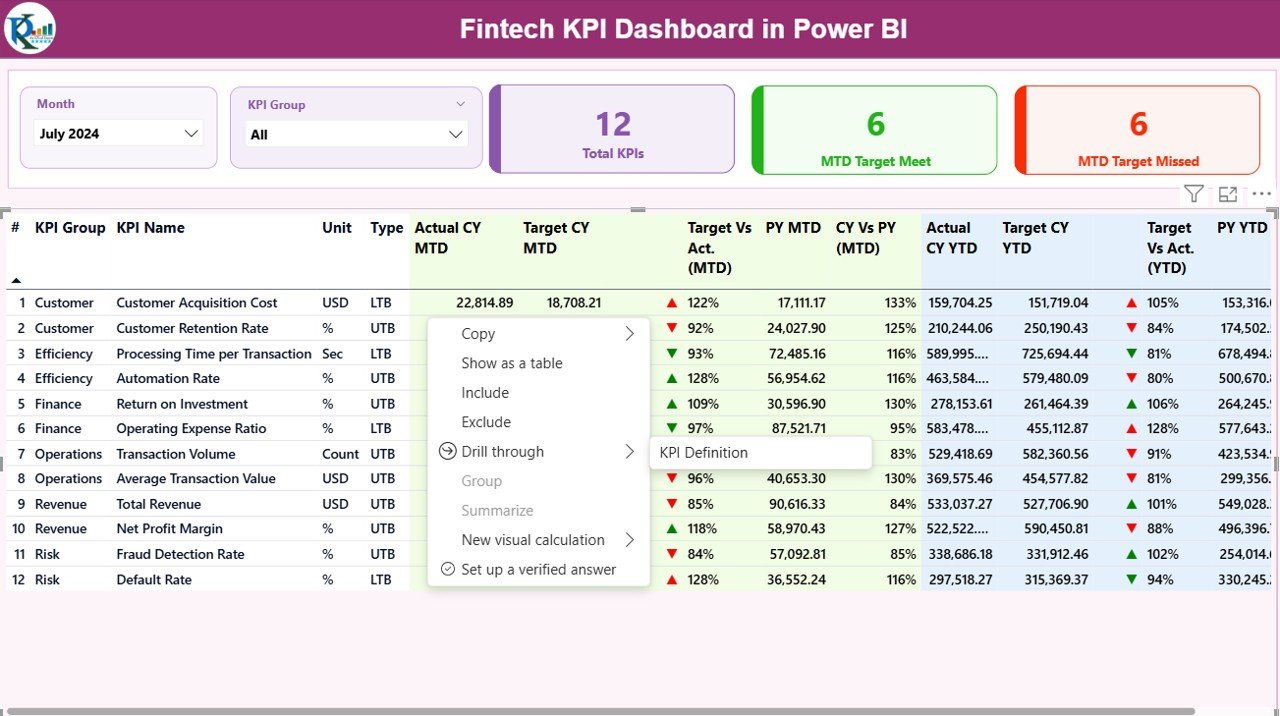
Summary Page: The Main Dashboard View
The Summary Page is the heart of the Fintech KPI Dashboard. Users start their analysis here. It provides a complete performance view for all KPIs with the help of slicers, tables, cards, and icons.
Key Elements in the Summary Page
Month Slicer
Users can choose the month, and the entire dashboard refreshes instantly.
KPI Group Slicer
This helps filter KPIs by category such as:
- Revenue
- Lending
- Compliance
- Fraud
- Transaction Operations
- Customer Management
High-Level KPI Cards
The top section shows three important cards:
- Total KPIs Count
- MTD Target Met
- MTD Target Missed
These cards show the overall health of your fintech performance.
Click to buy Fintech KPI Dashboard in Power BI
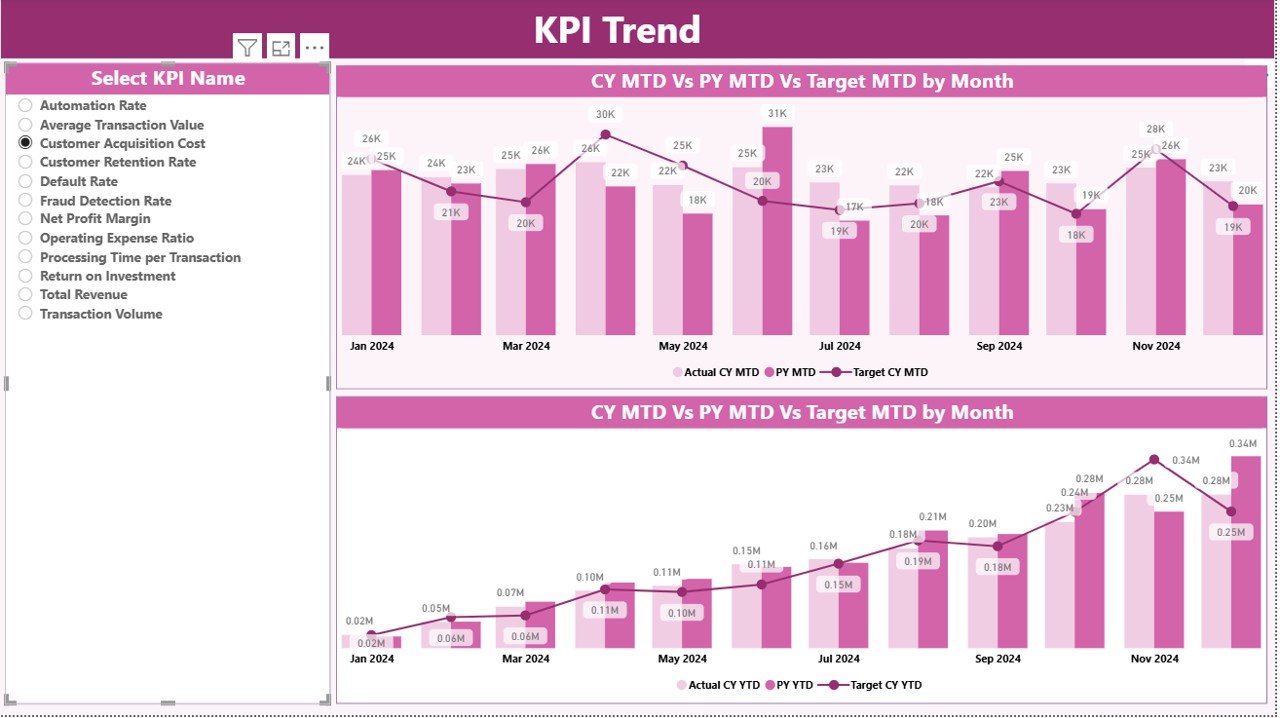
KPI Trend Page: Visual Trend Analysis
The KPI Trend Page is ideal for tracking the movement of performance. Users can choose a KPI name from the slicer on the left. After that, two combo charts display the KPI’s monthly movement.
Charts Included
MTD Trend Chart
Shows:
- Current Year MTD Actual
- Previous Year MTD Actual
- MTD Target
YTD Trend Chart
Shows:
- Current Year YTD Actual
- Previous Year YTD Actual
- YTD Target
These charts help identify:
- Growth patterns
- Variations between years
- Target gaps
- Monthly improvements
- Seasonal impacts
This view makes trend analysis simple and fast.
Click to buy Fintech KPI Dashboard in Power BI
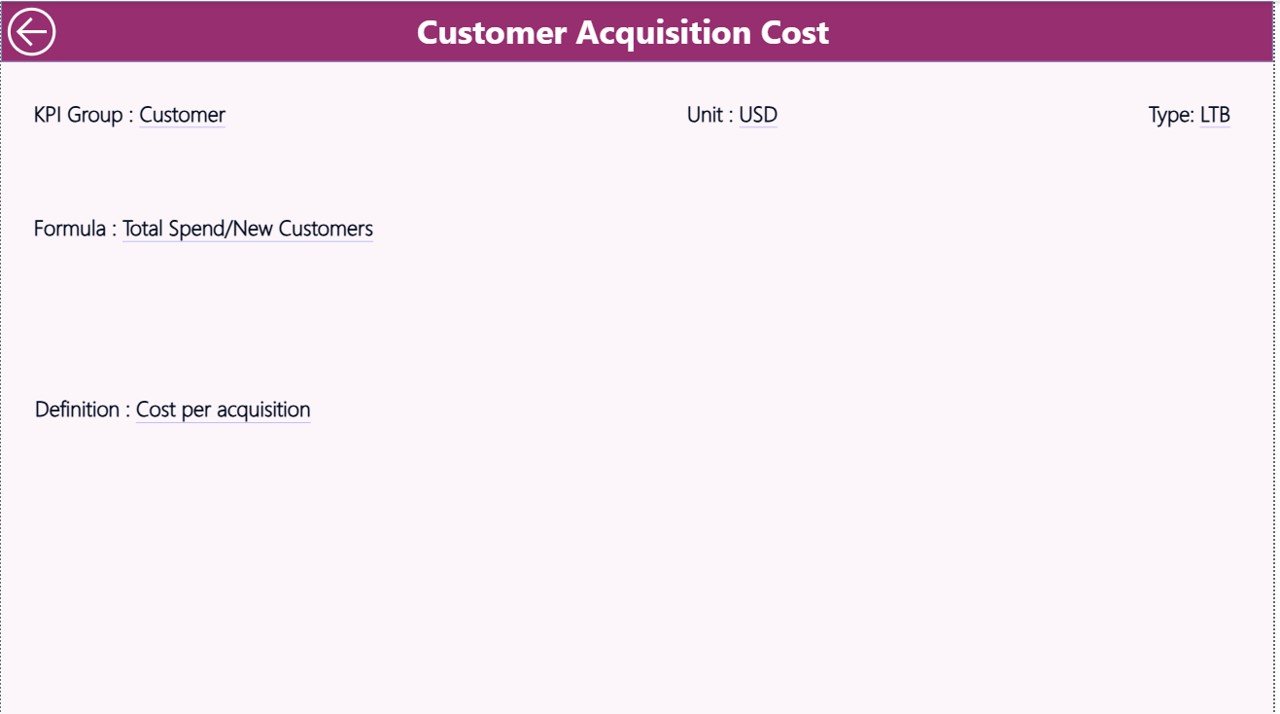
KPI Definition Page: Drill-Through Details
The KPI Definition Page is a hidden page used for drill-through. Users can right-click a KPI and view its full description.
This page includes:
- KPI Number
- KPI Name
- KPI Group
- Unit
- Formula
- KPI Definition
- KPI Type (LTB/UTB)
A back button on the top-left corner helps users return to the Summary Page.
Click to buy Fintech KPI Dashboard in Power BI
Excel Input Sheets for Data Management
The dashboard uses an Excel file as its data source. The Excel file has three input worksheets.
Input_Actual Sheet
You need to fill:
- KPI Name
- Month (use the first date of the month)
- MTD Actual
- YTD Actual
This sheet stores all actual performance data.
Input_Target Sheet
You need to fill:
- KPI Name
- Month (same date format)
- MTD Target
- YTD Target
This sheet stores all target data for KPIs.
KPI Definition Sheet
You need to fill:
- KPI Number
- KPI Group
- KPI Name
- Unit
- Formula
- Definition
- Type (LTB/UTB)
This helps maintain clean and structured KPI documentation.
Click to buy Fintech KPI Dashboard in Power BI
Important KPIs to Track in Fintech Companies
Although the dashboard is flexible and supports many KPIs, here are some common fintech KPIs:
Revenue & Growth KPIs
- Monthly Recurring Revenue (MRR)
- New Customer Revenue
- Loan Disbursement Amount
- Wallet Load Value
Customer KPIs
- Active Users
- Customer Acquisition Cost
- Customer Lifetime Value
Risk & Compliance KPIs
- Fraud Score
- KYC Completion Rate
- Dispute Resolution Rate
- NPA Percentage
Operational KPIs
- Transaction Success Rate
- Transaction Processing Time
- Uptime Percentage
Product KPIs
- Feature Adoption Rate
- API Failure Rate
- User Retention Rate
These KPIs help teams stay aligned with business objectives.
Advantages of Using a Fintech KPI Dashboard in Power BI
The dashboard offers many benefits that support both small and large fintech companies.
- Faster Decision-Making
Teams can check performance instantly. No need to compile sheets or request reports.
- Real-Time Insights
Because the data updates instantly in Power BI, teams get the latest numbers anytime.
- Improved Compliance
The dashboard shows compliance KPIs clearly. Users can take timely action and avoid penalties.
- Better Customer Experience
Tracking user activity helps teams improve engagement and product performance.
- Enhanced Forecasting
The trend charts help understand seasonality, demand, and revenue patterns.
- Reduced Reporting Time
Automated dashboards save hours of manual work every month.
- Clear Performance Visibility
The icons and color-coded indicators make the dashboard extremely easy to read.
Best Practices for Using a Fintech KPI Dashboard in Power BI
Follow these best practices for accurate and meaningful insights.
Use Clean and Valid Data
Always fill actual and target numbers correctly. This ensures accurate reporting.
Maintain Clear KPI Definitions
Use simple and direct formulas so anyone can understand the KPIs.
Update Targets Regularly
Update MTD and YTD targets every month to keep analysis relevant.
Review Trends Before Making Decisions
Use the trend charts to understand whether performance is stable, rising, or falling.
Keep KPI Groups Well-Organized
Group KPIs logically such as:
- Financial
- Operation
- Compliance
- Customer
Limit the Number of KPIs
Track only important KPIs. Too many KPIs confuse decision-makers.
Automate Data Refresh
Set scheduled refreshes in Power BI so that you always get updated numbers.
How This Dashboard Helps Fintech Teams Grow Faster
The dashboard does more than show numbers. It supports the entire decision-making process. Fintech teams can:
- Monitor performance
- Reduce risks
- Improve customer experience
- Increase revenue
- Control cost
- Maintain compliance
With clear insights, the dashboard becomes a powerful growth tool.
Conclusion
A Fintech KPI Dashboard in Power BI gives companies a smarter way to monitor performance. It simplifies reporting, highlights risks, and improves forecasting. With features like drill-through pages, slicers, detailed tables, and trend charts, it becomes a complete reporting system for any fintech team.
When teams use this dashboard daily, they understand their performance better and make stronger decisions. This is why more fintech companies now use dashboard-based analytics to stay ahead.
Frequently Asked Questions (FAQs)
- What is a Fintech KPI Dashboard?
It is a Power BI dashboard that tracks financial, operational, and compliance KPIs of a fintech company.
- Can beginners use this dashboard?
Yes. The dashboard uses simple filters, slicers, and charts that anyone can use.
- Does the dashboard support drill-through?
Yes. The KPI Definition page lets users drill through to see formulas and KPI details.
- What type of data does the dashboard need?
It needs Actual MTD, YTD values, and Target MTD, YTD values from an Excel file.
- Can I add more KPIs?
Yes. You can add new KPI definitions and the dashboard will update automatically.
- Can it help with compliance tracking?
Yes. You can track KYC, fraud, audit scores, and many other compliance KPIs.
- Does it show year-to-year comparisons?
Yes. The dashboard shows both MTD and YTD comparisons with previous year numbers.
Visit our YouTube channel to learn step-by-step video tutorials
Watch the step-by-step video tutorial:
Click to buy Fintech KPI Dashboard in Power BI