Running a personal care and beauty business becomes more challenging each year. Customer expectations rise, new competitors enter the market, and trends shift faster than ever. Because of this, beauty salons, skincare clinics, spas, cosmetic retailers, grooming centers, and wellness studios must track performance with accuracy. When you monitor your KPIs every month, you make better decisions, increase efficiency, and grow your business with confidence.
A Personal Care & Beauty KPI Dashboard in Power BI helps you achieve this goal. It shows all key metrics in one place and transforms raw data into clear visual insights. With Power BI, you move from guesswork to data-driven decision-making.
In this detailed article, you will learn what this dashboard is, how it works, why it matters, and how your beauty business can benefit from it. You will also explore its pages, features, advantages, best practices, and frequently asked questions.
Click to buy Personal Care & Beauty KPI Dashboard in Power BI
What Is a Personal Care & Beauty KPI Dashboard in Power BI?
A Personal Care & Beauty KPI Dashboard in Power BI is a ready-to-use reporting tool that displays all major performance indicators of your beauty business. It takes data from an Excel file and presents it as interactive visuals, charts, KPI cards, and tables. You can monitor:
- Monthly performance
- Year-to-date progress
- Customer growth
- Appointment volume
- Product sales
- Service utilization
- Revenue trends
- Customer satisfaction
- Staff productivity
Because everything stays organized in Power BI, you make decisions faster and improve operations without delays.
Why Do Beauty Businesses Need a KPI Dashboard?
Beauty business owners often rely on manual tracking, multiple spreadsheets, or daily reports from staff. This creates confusion and leads to:
- Missed growth opportunities
- Inaccurate performance tracking
- Delays in decision-making
- Poor forecasting
- Unclear understanding of service-level demand
A KPI dashboard solves all these issues. It shows you what is working and what needs improvement.
Key Features of the Personal Care & Beauty KPI Dashboard in Power BI
Our ready-to-use dashboard contains three main pages, each designed to give you the best view of your performance.
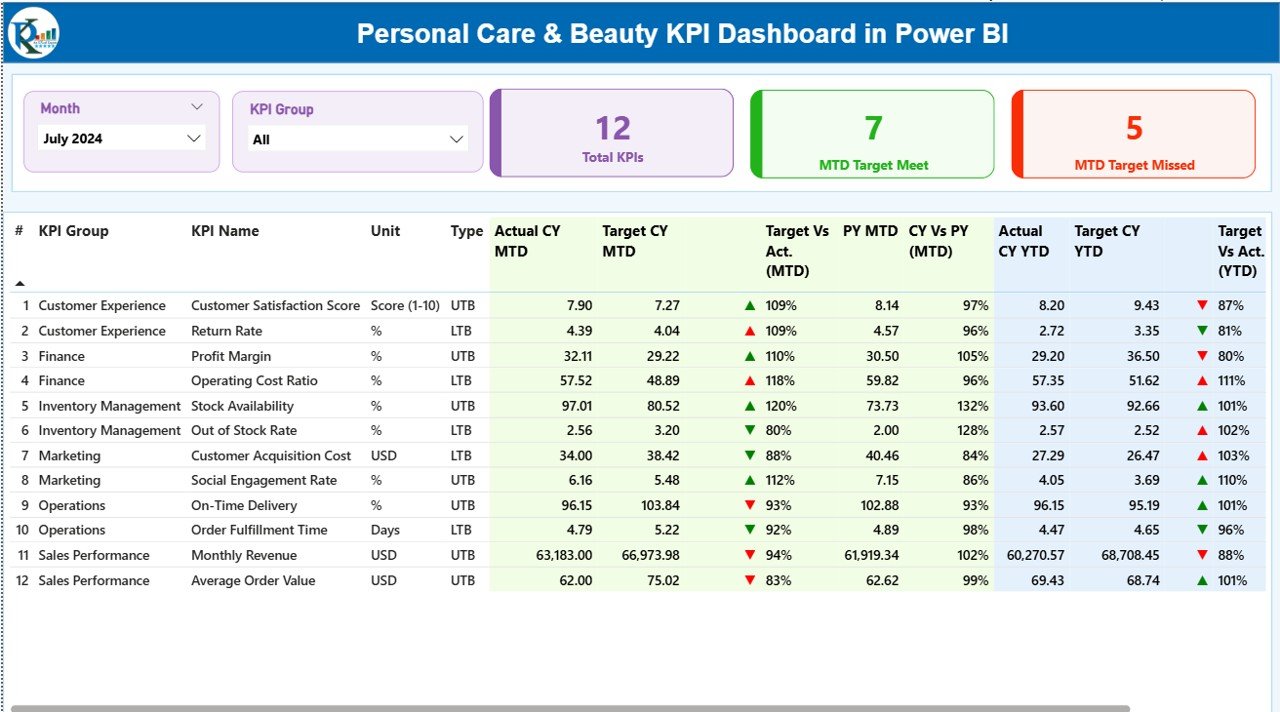
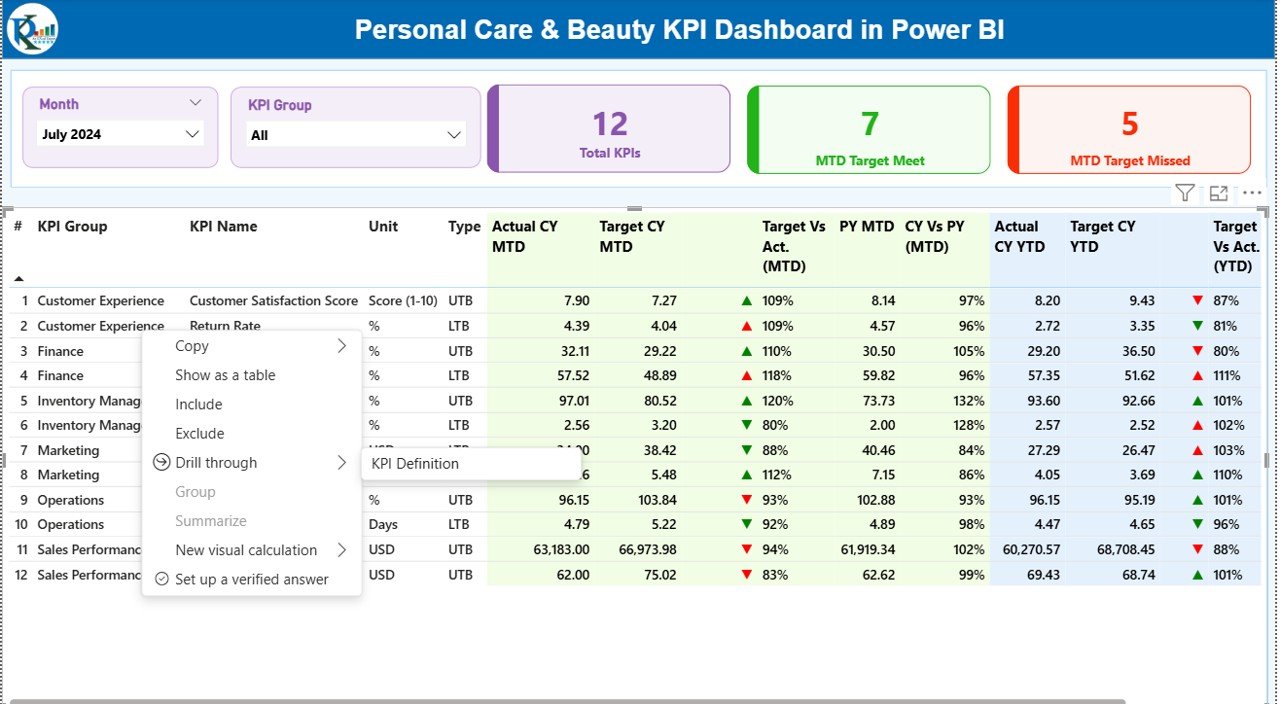
Summary Page – The Main Performance View
The Summary Page is the heart of the dashboard. It gives a quick and clear snapshot of all KPIs. You can use the slicers at the top to filter by:
- Month
- KPI Group
Right below the slicers, three KPI cards show:
- Total KPIs Count
- MTD Target Met
- MTD Target Missed
These cards help you see if your beauty business is performing well during the selected month.
Detailed KPI Table
The summary page includes a structured table with key values:
- KPI Number – Sequence number
- KPI Group – Category of the metric
- KPI Name – Name of the performance indicator
- Unit – Unit of measurement
- Type – LTB (Lower the Better) / UTB (Upper the Better)
- Actual CY MTD – Actual value of current month
- Target CY MTD – Target for the current month
- MTD Icon – ▲ or ▼ icons showing if the KPI met its target
- Target vs Actual (MTD) – Percentage performance
- PY MTD – Previous year’s value
- CY vs PY (MTD) – Comparison of current year and previous year
- Actual CY YTD – Year-to-date actual
- Target CY YTD – Year-to-date target
- YTD Icon – Target achievement indicator
- Target vs Actual (YTD) – YTD performance
- PY YTD – Previous year’s YTD
- CY vs PY (YTD) – Year-over-year YTD comparison
This table helps beauty businesses analyze performance in depth.
Click to buy Personal Care & Beauty KPI Dashboard in Power BI
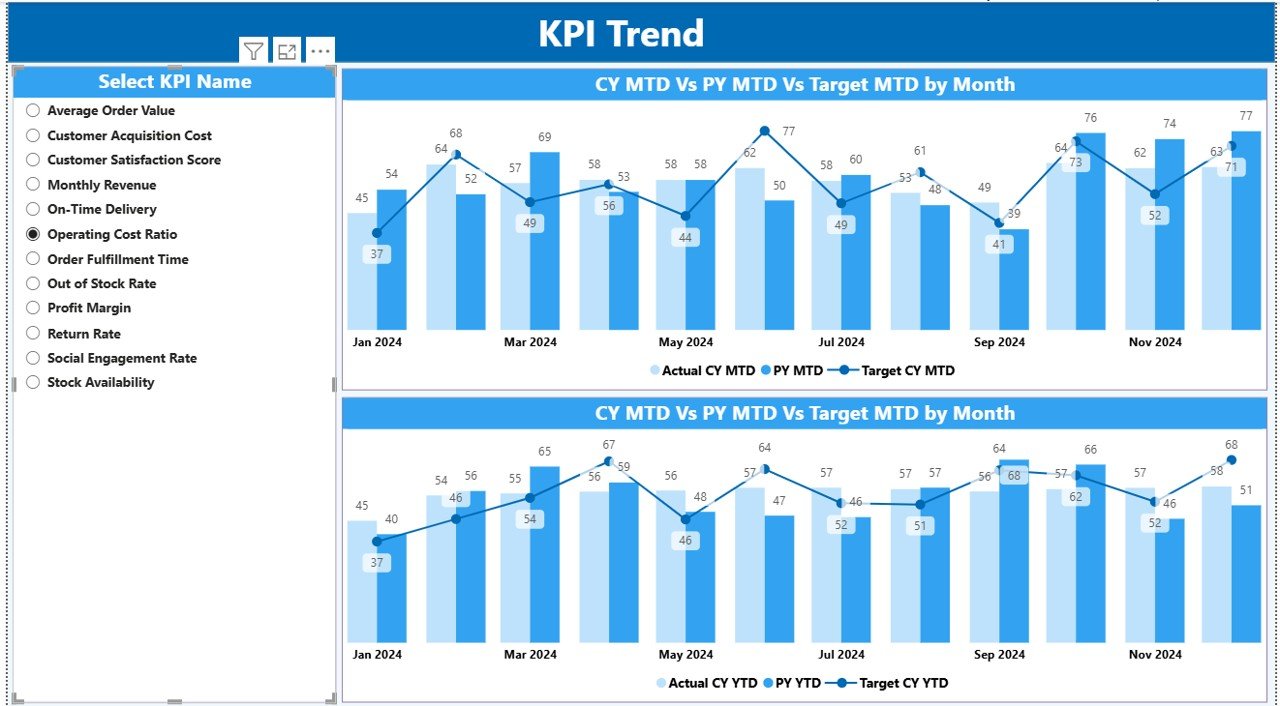
KPI Trend Page – View Monthly Trends Clearly
The KPI Trend Page shows the real movement of performance. Because beauty businesses face seasonal variations, trend analysis becomes important.
Here, you see:
- Two combo charts
- Actual CY, Previous Year, and Target values
- MTD and YTD visual trends
- A slicer to choose KPI Name
These charts help managers understand:
- Which services perform better
- How product sales move month by month
- How seasonal trends impact growth
- Whether targets align with performance
Click to buy Personal Care & Beauty KPI Dashboard in Power BI
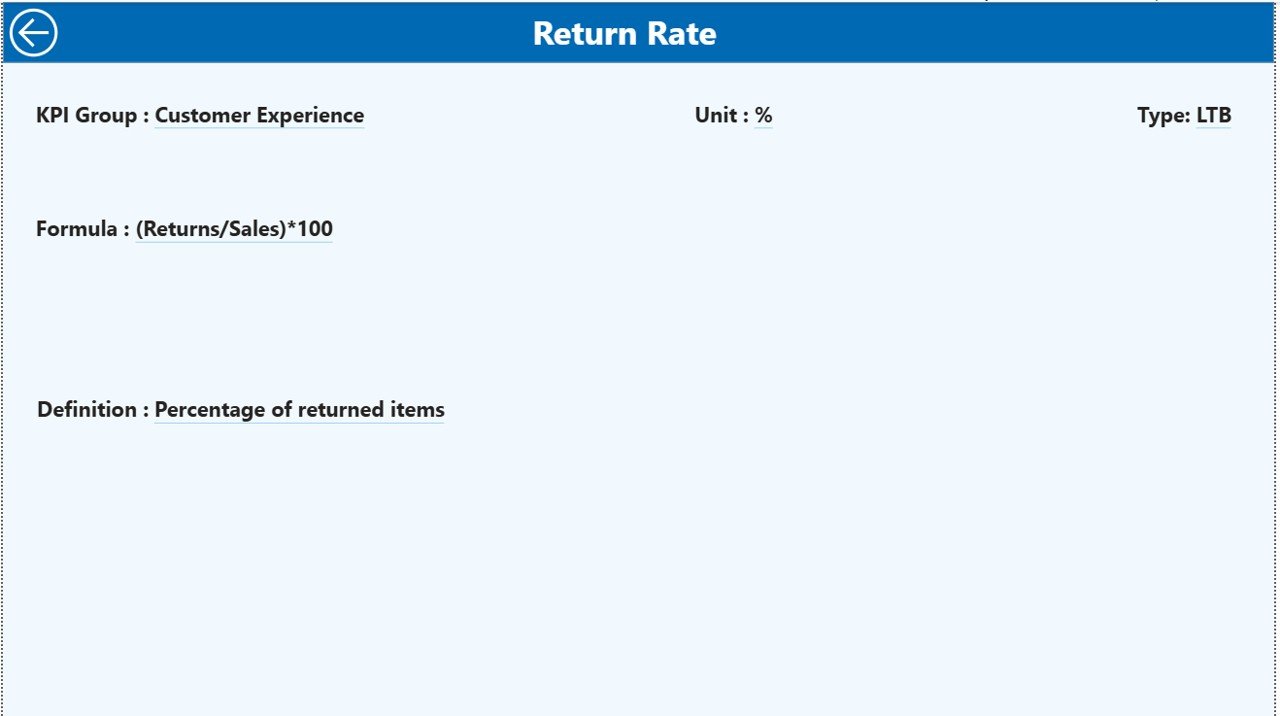
KPI Definition Page – Know the Formula Behind Each KPI
This is a hidden drill-through page. You access it by selecting a KPI from the Summary Page and drilling through. The page includes:
- Formula
- Unit
- KPI definition
- KPI type
When staff, owners, or managers need clarity, they can check this page.
Click to buy Personal Care & Beauty KPI Dashboard in Power BI
How the Excel Data Source Works
The dashboard uses an Excel file with three worksheets:
Input_Actual Sheet
You enter:
- KPI Name
- Month (use first date of the month)
- MTD actual numbers
- YTD actual numbers
Input_Target Sheet
You fill:
- KPI Name
- Month
- MTD target values
- YTD target values
KPI Definition Sheet
This sheet contains:
- KPI Number
- KPI Group
- KPI Name
- Unit
- Formula
- Definition
- Type (LTB or UTB)
Because all data stays in Excel, you update your dashboard quickly without editing Power BI.
Click to buy Personal Care & Beauty KPI Dashboard in Power BI
Which KPIs Should Beauty Businesses Track?
Here are common KPIs used in beauty and personal care:
Sales & Revenue KPIs
- Monthly Revenue
- Revenue per Service
- Product Sales Growth
- Average Transaction Value
Customer KPIs
- Customer Retention Rate
- New Customer Count
- Customer Satisfaction Score
- Appointment No-Show Rate
Service Performance KPIs
- Service Utilization Rate
- Appointment Volume
- Popular Services Ranking
- Cancellation Rate
Staff KPIs
- Productivity per Staff Member
- Service Delivery Time
- Staff Occupancy Rate
- Training Completion Rate
Operational KPIs
- Inventory Turnover
- Cost per Service
- Profit Margin per Service
- Discount Impact
Tracking these KPIs helps any beauty business identify trends and take action.
Advantages of the Personal Care & Beauty KPI Dashboard in Power BI
1. Better Decision Making
You see trends and patterns instantly, making decisions easier.
2. Real-Time Performance Tracking
You never wait for reports. Everything updates automatically.
3. Visual and Easy to Read
Charts and icons make the data simple to understand.
4. Saves Time
You don’t maintain multiple spreadsheets or manual reports.
5. Helps You Improve Services
You identify weak areas and improve customer experience.
6. Tracks Staff Productivity
You see which team members perform well and who needs support.
7. Improves Sales and Customer Growth
When KPIs show gaps, you take action to boost revenue.
8. Suitable for All Beauty Businesses
Salons, spas, clinics, grooming centers, and retail beauty stores can use it.
Best Practices for Using the Personal Care & Beauty KPI Dashboard
Follow these tips to get accurate insights:
Keep the Excel data updated every month
Use correct KPI formulas
Review both MTD and YTD numbers
Compare Current Year with Previous Year
Track staff performance separately
Review trends to understand seasonal impact
Use slicers to filter by KPI groups
Drill through to read KPI definitions
Ensure correct units (%, Nos., ₹, etc.)
Set realistic targets
When you follow these rules, your dashboard gives better results and supports consistent growth.
Conclusion
The Personal Care & Beauty KPI Dashboard in Power BI becomes the center of effective decision-making for beauty businesses. It converts your Excel data into meaningful visual insights, tracks every important KPI, and helps you understand where your business stands month after month. Because it shows MTD, YTD, and year-over-year comparisons, you get a complete and accurate performance picture.
Whether you run a salon, spa, clinic, or cosmetic retail store, this dashboard gives clarity, control, and confidence. You make smart choices, improve customer experience, and grow revenue faster.
Frequently Asked Questions (FAQs)
- What is a Beauty KPI Dashboard in Power BI?
It is a visual reporting system that shows all beauty business KPIs using interactive charts and tables.
- Why do beauty salons need a KPI dashboard?
It helps them track performance, measure growth, improve operations, and increase revenue.
- Can I update the dashboard manually?
Yes, you only update the Excel file. Power BI refreshes automatically.
- Does this dashboard support monthly and yearly views?
Yes, it includes MTD, YTD, and year-over-year comparisons.
- Can non-technical users use this dashboard?
Yes, the dashboard uses simple visuals and clear navigation.
- What KPIs are important for salons and spas?
Customer retention, revenue growth, service utilization, staff productivity, and appointment trends.
- Does the dashboard include a KPI definition page?
Yes, it includes a drill-through page that shows formula, type, and definition.
- Do I need Power BI Pro to use this dashboard?
No, you can use Power BI Desktop for free unless you want online sharing.
- Can I customize the KPI list?
Yes, you can modify the KPI Definition sheet anytime.
- Will this dashboard improve customer experience?
Yes, tracking KPIs helps you improve service quality and customer satisfaction.
Visit our YouTube channel to learn step-by-step video tutorials
Watch the step-by-step video tutorial:
Click to buy Personal Care & Beauty KPI Dashboard in Power BI