Businesses want simple and clear insights to control cost, reduce waste, and improve purchasing performance. However, procurement data often stays scattered across spreadsheets, emails, and multiple systems. As a result, teams struggle to track expenses, vendor performance, and departmental spending trends.
A Procurement Spend Analysis Dashboard in Excel solves these challenges. It brings all spending information into one easy-to-understand view. It helps teams track budgets, compare cost trends, monitor lead times, evaluate departments, and review category-level performance. Because Excel is flexible and widely used, this dashboard becomes a powerful tool that supports data-driven decisions without any complex software.
In this detailed article, you will learn what this dashboard offers, how each page works, the advantages, best practices, and answers to common questions. The goal is to help you understand everything you need to use the dashboard with confidence.
Click to buy Procurement Spend Analysis Dashboard in Excel
What Is a Procurement Spend Analysis Dashboard in Excel?
A Procurement Spend Analysis Dashboard in Excel is a ready-to-use template that tracks total cost, budget usage, category spending, lead time, regional trends, monthly changes, and department-wise performance. It uses clean visuals, slicers, pivot charts, and interactive elements that help procurement teams analyze spending patterns instantly.
The dashboard organizes procurement data into multiple analytical pages. Each page focuses on different elements like categories, departments, and regions. You can filter data, compare costs, evaluate performance, and identify areas where improvements are necessary.
Because Excel is familiar and easy to customize, businesses use this dashboard to increase visibility, save time, and enhance reporting accuracy.
Why Do Businesses Need a Procurement Spend Analysis Dashboard?
You manage purchases every day. You handle budgets, work with vendors, review invoices, and monitor spending patterns. Without a central view, you spend more time gathering data and less time making decisions.
This dashboard helps you:
- Track spending in real time
- Compare budget vs actual cost
- Identify cost-saving opportunities
- Review departmental and category trends
- Monitor lead time and delayed orders
- Improve reporting accuracy
- Reduce manual work
When teams use visual insights, they understand their buying behavior more clearly. They detect overspending quickly and take timely action to control costs.
What Does the Procurement Spend Analysis Dashboard Include?
The dashboard contains multiple sheet tabs, each designed to offer detailed insights. You can move between sheets using a simple navigation panel. Every sheet focuses on specific areas to help you understand procurement spending from different angles.
Below is a detailed explanation of each sheet:
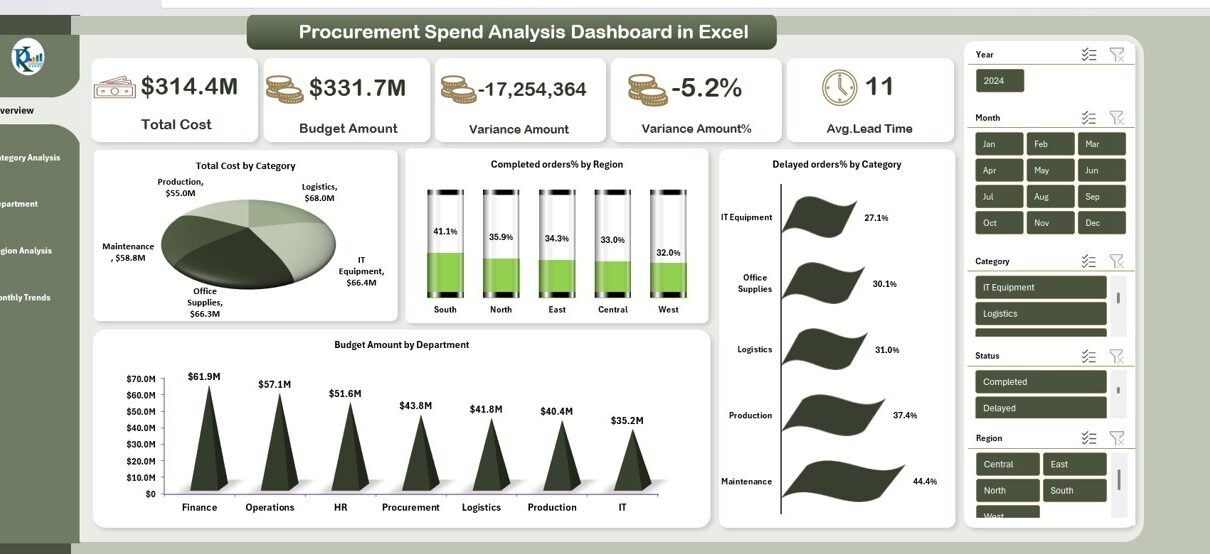
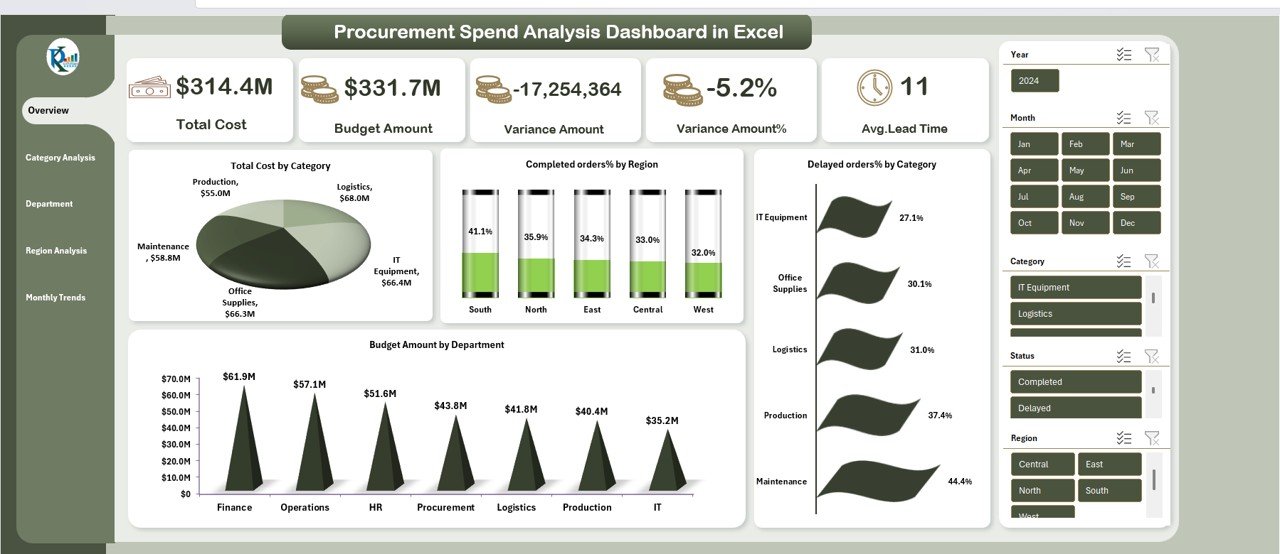
Overview Sheet Tab
The Overview Sheet gives you a complete summary of your procurement performance. It is the main page of the dashboard and includes key metrics and charts that help you see the whole picture instantly.
Key Metrics on the Overview Page
- Total Cost – The total procurement amount spent.
- Budget Amount – The total budget planned for a specific period.
- Variance Amount – The difference between budget and actual cost.
- Variance Amount % – Shows how far the actual cost is from the planned budget in percentage.
- Avg. Lead Time – The average time taken to complete procurement orders.
These metrics help you understand whether you stay on budget, overspend, or underspend. They also highlight performance issues in order processing.
Key Charts on the Overview Page
Total Cost by Category
This chart shows how much you spend on each procurement category. It helps you identify high-cost areas.
Completed Orders % by Region
This chart displays the percentage of completed orders from different regions.
Budget Amount by Department
This helps you track how much budget each department uses.
Delayed Orders % by Category
This chart reveals which categories face the most order delays. You can use this to improve supplier performance and internal processes.
The overview page helps you make quick, informed decisions because it highlights all major performance indicators in one place.
Click to buy Procurement Spend Analysis Dashboard in Excel
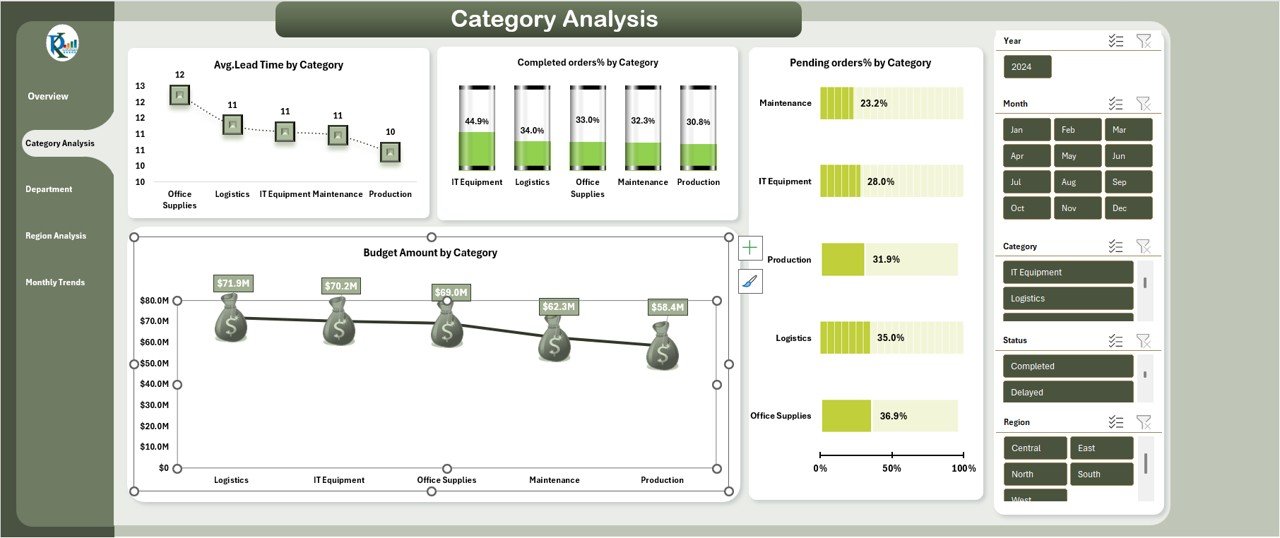
Category Analysis Sheet Tab
The Category Analysis sheet shows a deeper view of procurement categories. It helps you compare and analyze performance across all purchasing categories.
Category Analysis Page
Avg. Lead Time by Category
You can identify categories with longer processing times. This helps you improve vendor selection and internal workflows.
Budget Amount by Category
This chart compares the planned budget against different categories.
Estimated Hours by Employee Name
This highlights the work effort employees put into processing orders. You can use this to balance workload and improve efficiency.
Category analysis helps you understand where money goes and how much time each category consumes.
Click to buy Procurement Spend Analysis Dashboard in Excel
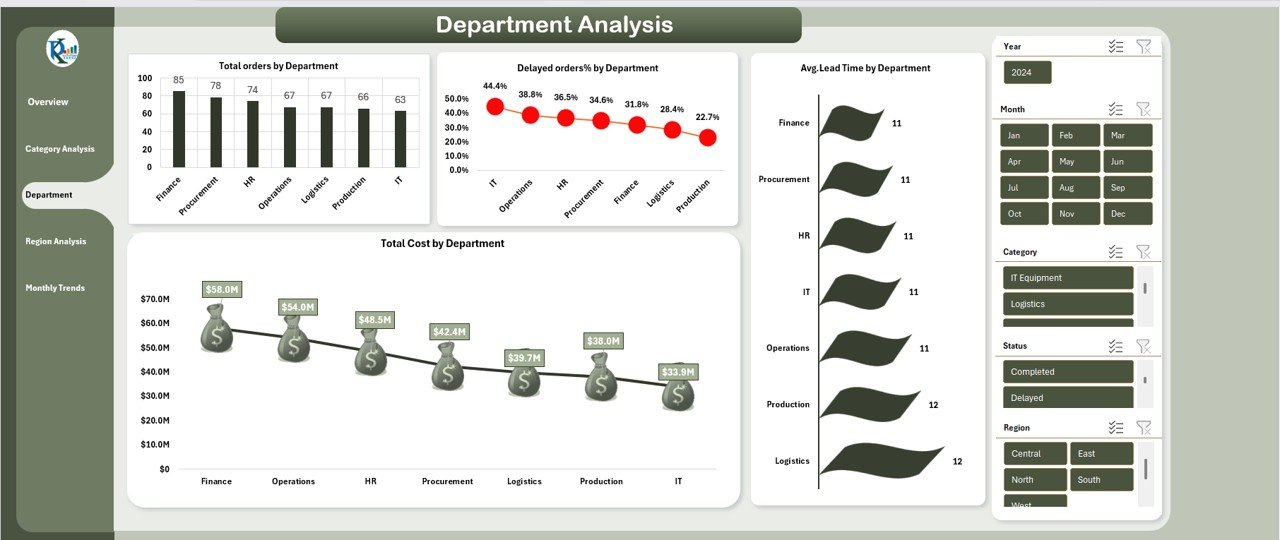
Department Analysis Page
Total Orders by Department
Shows how many orders each department places.
Total Cost by Department
Helps you understand which departments contribute the most to procurement spending.
Avg. Lead Time by Department
Displays how quickly each department processes orders.
Delayed Orders % by Department
Helps you find areas where delays happen more frequently.
With departmental insights, you can support training, process improvement, and better resource allocation.
Click to buy Procurement Spend Analysis Dashboard in Excel
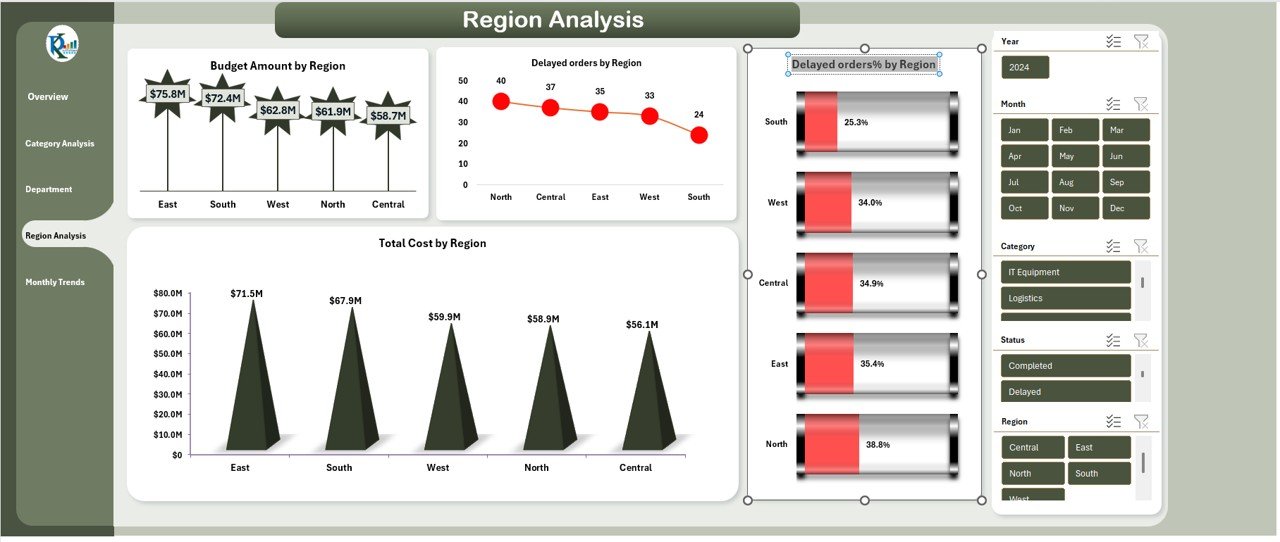
Region Analysis Sheet Tab
The Region Analysis page monitors procurement performance across geographic regions. This is useful when businesses operate in multiple locations.
Key Charts on the Region Analysis Page
Budget Amount by Region
Tracks how much budget each region uses.
Total Cost by Region
Shows actual spending by region.
Delayed Orders by Region
Helps you find locations that face more issues with order delays.
Delayed Orders % by Region
Shows the share of delayed orders in each region.
When you see how regions differ in spending and performance, you can focus on the areas that need attention.
Click to buy Procurement Spend Analysis Dashboard in Excel
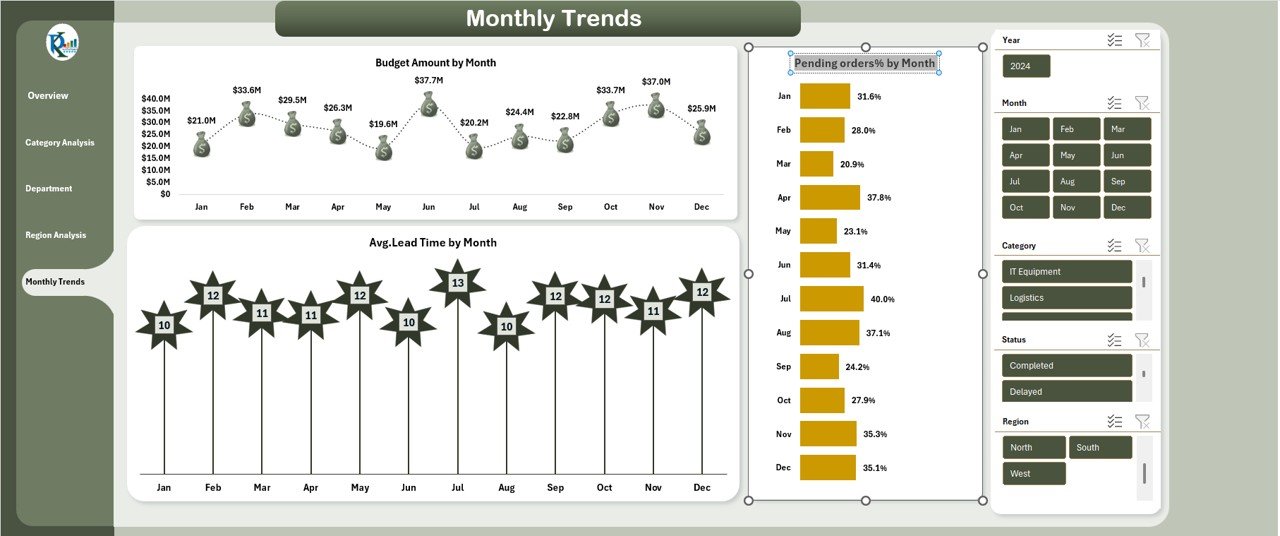
Monthly Trends Sheet Tab
The Monthly Trends page helps you track procurement patterns over time. Seasonal trends and monthly comparisons become easy to understand.
Key Charts on the Monthly Trends Page
Budget Amount by Month
This shows how each month’s planned budget changes.
Avg. Lead Time by Month
Tracks how quickly orders get processed month-by-month.
Pending Orders % by Month
Shows how many orders remain pending each month.
Monthly analysis helps you identify trends, forecast future spending, and plan procurement activities better.
Click to buy Procurement Spend Analysis Dashboard in Excel
Advantages of Using a Procurement Spend Analysis Dashboard in Excel
A dedicated section on advantages helps you understand why this dashboard is valuable. Below are some of the biggest benefits:
- Clear and Centralized Visibility
The dashboard brings all procurement data into one place, which removes confusion and reduces manual work.
- Fast and Simple Decision-Making
You get instant visuals that make analysis quick and easy. This helps leaders take effective action.
- Budget Control and Cost Savings
You can find areas where overspending happens and take steps to reduce waste.
- Improved Supplier and Process Performance
You understand which categories or regions face delays. This helps you develop better vendor strategies.
- Easy Customization and Flexibility
Excel allows easy edits, new charts, additional data fields, and advanced automation.
- Better Department and Category Insights
You can see performance at every level, which supports better resource management.
Best Practices for Using the Procurement Spend Analysis Dashboard
Using best practices helps you get maximum value from this tool. Below are the most useful methods:
- Update Data Regularly
Make sure the dashboard reflects the most recent information to get accurate insights.
- Standardize Category and Department Names
Avoid duplicate names to maintain accuracy in pivot charts.
- Use Filters and Slicers Smartly
Apply slicers to analyze data by year, vendor, region, or category.
- Compare Budget vs Actual Often
Review variations monthly to prevent overspending.
- Identify Patterns Through Monthly Trends
Use month-wise analysis to track growth, delays, and seasonal changes.
- Focus on High-Impact Categories
Identify categories with high cost or longer lead times and optimize them first.
- Validate Data Before Importing
Clean data helps avoid errors in charts and calculations.
Following these best practices ensures strong and reliable reporting.
Conclusion
A Procurement Spend Analysis Dashboard in Excel gives you full control over cost, category trends, lead time, regional performance, and budget management. It provides a clear and structured view of procurement operations. Because the dashboard is simple to use, it supports better decision-making, reduces errors, and increases overall purchasing efficiency.
When teams use the dashboard regularly, they track spending better, detect problems early, and improve supplier performance. Whether your business is small or large, this dashboard helps you understand your procurement activities in a more meaningful way.
Frequently Asked Questions (FAQs)
- What is a Procurement Spend Analysis Dashboard?
It is an Excel-based dashboard that tracks procurement cost, budget usage, lead time, category trends, and department-wise spending using charts and metrics.
- Why should businesses use this dashboard?
Businesses use it to improve visibility, control budgets, monitor supplier performance, reduce waste, and make faster decisions.
- Can beginners use this dashboard easily?
Yes. The dashboard uses simple navigation, clean visuals, and pivot charts that make it beginner-friendly.
- Can I customize the dashboard based on my needs?
Yes. You can add new fields, charts, slicers, and filters based on your business requirements.
- Does the dashboard support monthly and category-level analysis?
Yes. It includes pages for monthly trends, category analysis, region insights, and departmental comparisons.
- Does Excel offer automation for procurement dashboards?
Yes. You can add formulas, conditional formatting, macros, and Power Query to automate data refresh and reporting.
Visit our YouTube channel to learn step-by-step video tutorials
Watch the step-by-step video tutorial:
Click to buy Procurement Spend Analysis Dashboard in Excel