Running a clinic requires more than medical skills. You need strong data insights, fast decision-making, and clear visibility of day-to-day operational performance. However, most clinics still rely on scattered spreadsheets, manual reports, and disconnected tools. As a result, leaders struggle to see the complete picture of how their clinic performs every month.
Because of this, a Clinics KPI Dashboard in Power BI becomes a powerful solution. It helps healthcare teams track essential metrics, improve patient services, reduce operational delays, boost revenue, and monitor overall performance in real time. With one glance, you understand what works and what needs improvement.
In this complete guide, I will explain everything about the Clinics KPI Dashboard in Power BI. You will learn its structure, pages, data sources, KPIs, advantages, best practices, and answers to common questions. I will also expand your existing content to create a detailed and engaging article that offers real value to readers.
Click to buy Clinics KPI Dashboard in Power BI
What Is a Clinics KPI Dashboard in Power BI?
A Clinics KPI Dashboard in Power BI is a ready-to-use reporting tool that helps clinic administrators, doctors, management teams, and healthcare decision-makers track key performance indicators (KPIs) in one interactive dashboard. It brings multiple clinical metrics into a clean visual format where you can see monthly and yearly results with a single click.
Because this dashboard sits inside Power BI, it refreshes instantly, analyzes data quickly, and gives a clear view of everything from patient flow to revenue trends. It works beautifully for single clinics, multi-branch setups, specialty clinics, and diagnostic centers.
The dashboard captures data from Excel files and converts it into a powerful analytical system. You can track metrics such as:
- Monthly patient visits
- Revenue trends
- Appointment efficiency
- Consultation time
- Diagnostic services performance
- Treatment cycle metrics
- Customer satisfaction
- Billing performance
- Medical staff productivity
This dashboard helps you monitor clinical health and operational efficiency in real time, so your clinic stays agile and responsive.
Why Do Clinics Need a KPI Dashboard?
Clinics handle large amounts of data every day—appointments, patients, billing, diagnostics, and staff performance. Without a clear dashboard, this data becomes confusing and hard to manage.
A KPI dashboard solves these challenges because it:
- Organizes every metric in a single system
- Helps you make faster decisions
- Improves clinic efficiency
- Reduces bottlenecks
- Enhances patient experience
- Supports compliance and quality standards
Most importantly, it gives clarity. You do not guess anymore—you see the truth in numbers.
Key Features of the Clinics KPI Dashboard in Power BI
This Clinics KPI Dashboard includes three powerful pages inside the Power BI file. Each page offers a unique perspective and helps you track your KPIs with clarity.
Let’s explore each section in detail.
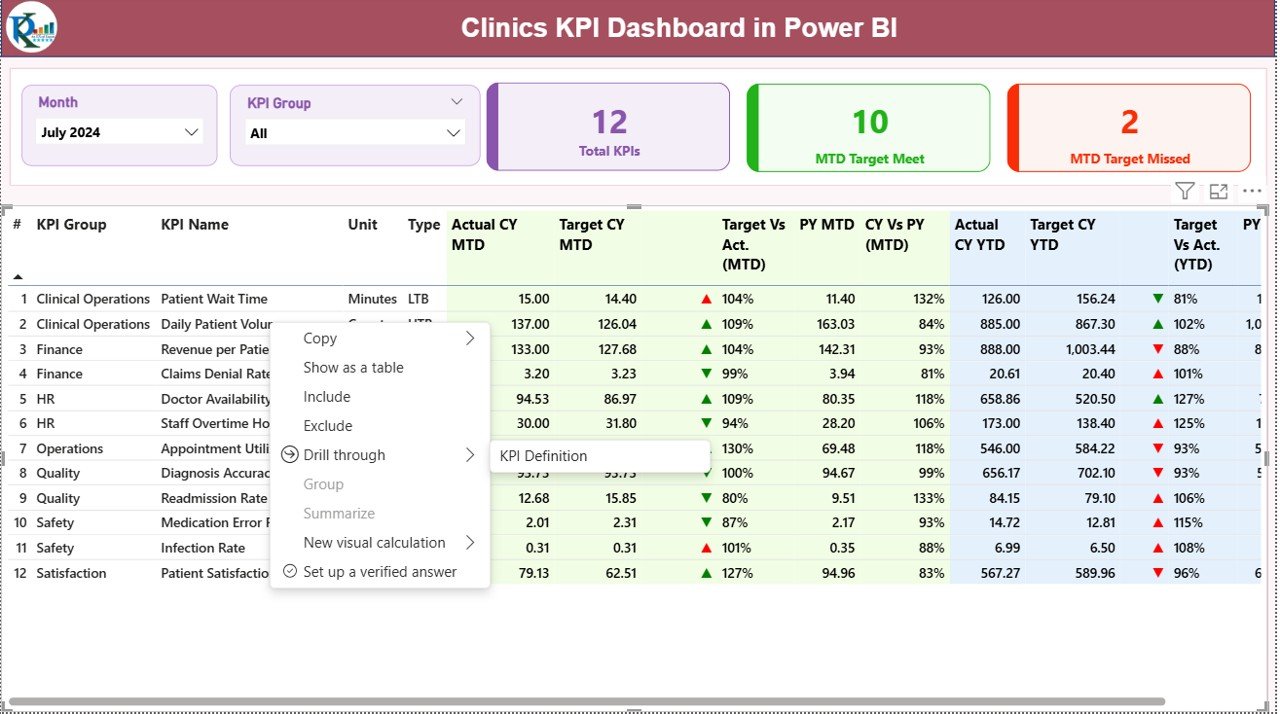
Summary Page – Your Main View for Clinic Performance
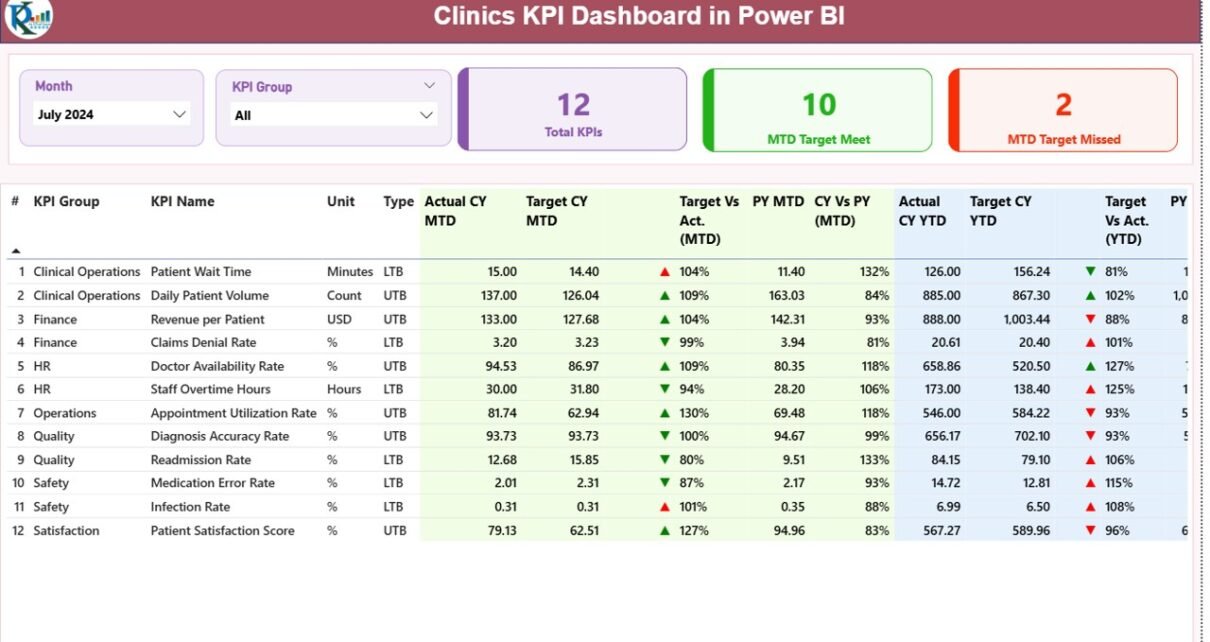
The Summary Page is the heart of the dashboard. It shows a complete overview of all KPIs in a clean and simple interface. Decision-makers use this page daily because it displays instant performance insights.
Top Area: Filters and KPI Cards
At the top, you see:
- Month slicer – Select the month you want to analyze
- KPI Group slicer – Filter KPIs by category
- Three important KPI cards:
- Total KPIs Count
- MTD Target Met
- MTD Target Missed
These cards help you understand overall performance instantly.
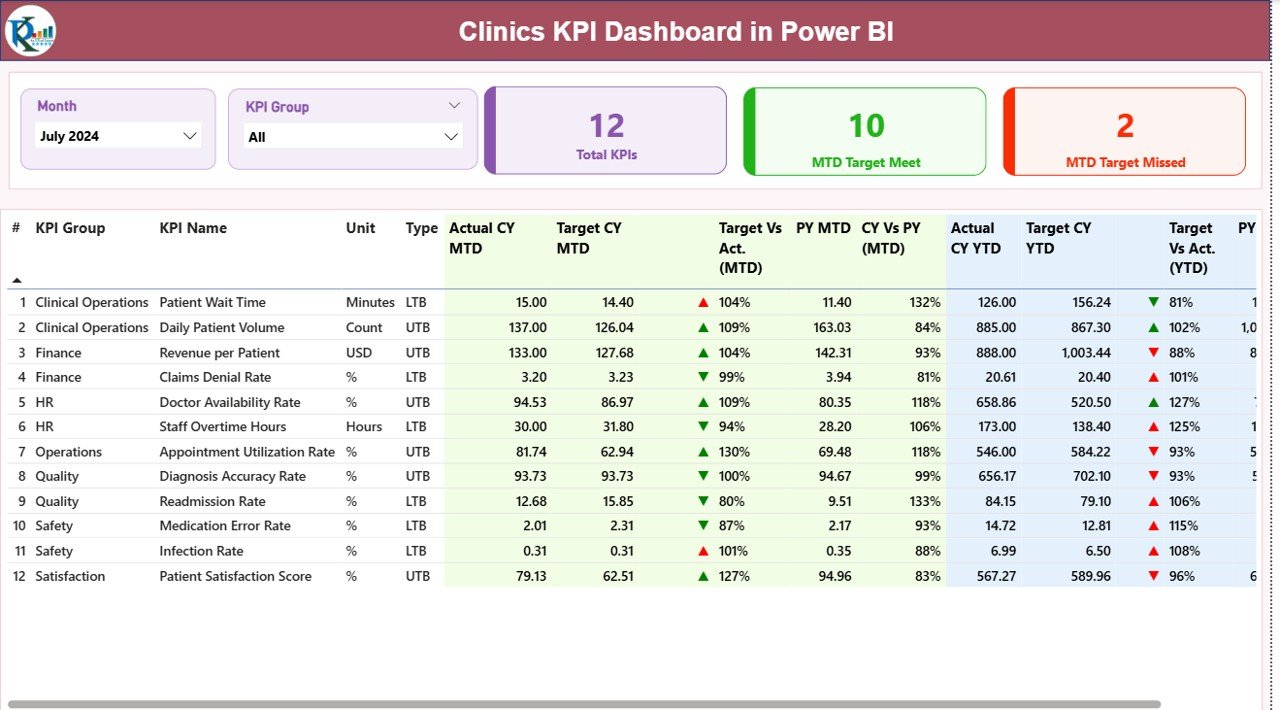
Detailed KPI Table
Below the cards, the dashboard displays a detailed table for every KPI with essential fields:
- KPI Number
- KPI Group
- KPI Name
- Unit
- Type (LTB = Lower the Better, UTB = Upper the Better)
- Actual CY MTD
- Target CY MTD
- MTD Icon (▲ or ▼ to show KPI status)
- Target vs Actual (MTD)
- PY MTD
- CY vs PY (MTD)
- Actual CY YTD
- Target CY YTD
- YTD Icon (▲ or ▼)
- Target vs Actual (YTD)
- PY YTD
- CY vs PY (YTD)
This table gives a complete view of every KPI’s monthly and yearly performance. You understand trends, performance gaps, and progress instantly.
Click to buy Clinics KPI Dashboard in Power BI
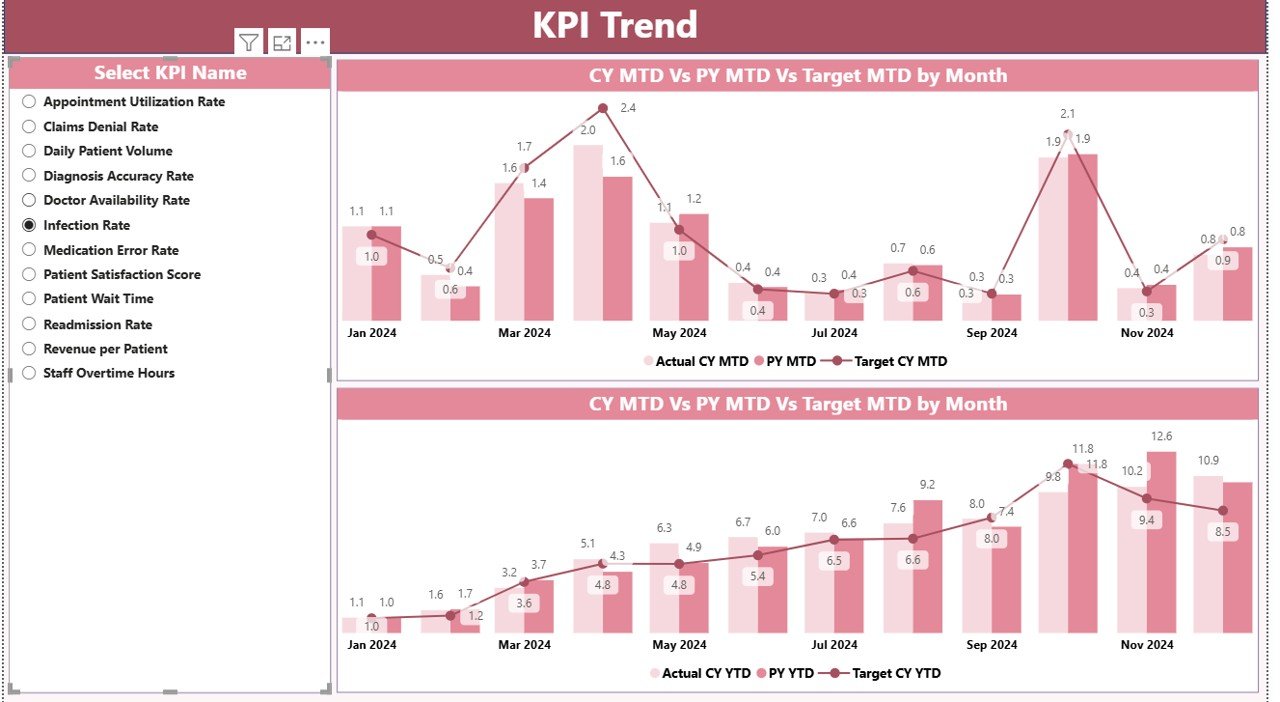
KPI Trend Page – Visualize Your Clinical Performance
The KPI Trend Page helps you visualize progress over time. It displays two combo charts:
- MTD Trends: Actual, Target, and Previous Year
- YTD Trends: Actual, Target, and Previous Year
On the left side, you see a slicer to select specific KPIs. The chart updates instantly and helps you compare:
- Monthly performance
- Previous year trends
- Year-to-date values
- Gap between target and actual
This visual analysis helps doctors, managers, and owners make fast decisions.
Click to buy Clinics KPI Dashboard in Power BI
KPI Definition Page – Drill-Through for Clarity
Power BI includes a hidden drill-through page called KPI Definition. This page gives full clarity about:
- KPI number
- KPI group
- KPI name
- Unit
- Formula
- Definition
- Type (LTB/UTB)
Users can right-click any KPI in the summary table and drill through to see details. This feature reduces confusion and ensures consistency across departments.
You return to the main page by clicking the Back button provided at the top left corner.
Click to buy Clinics KPI Dashboard in Power BI
Excel File as the Data Source
The dashboard uses an Excel file as the data source, making it simple and easy to update. You only update three sheets:
Input_Actual Sheet
Here you enter:
- KPI Name
- Month (first day of the month)
- MTD numbers
- YTD numbers
Input_Target Sheet
Here you enter:
- KPI Name
- Month
- MTD targets
- YTD targets
KPI Definition Sheet
Here you fill:
- KPI number
- Group
- KPI name
- Unit
- Formula
- Definition
- Type (LTB or UTB)
You only update these sheets each month and refresh Power BI. The dashboard updates automatically.

Click to buy Clinics KPI Dashboard in Power BI
What KPIs Can a Clinic Track Using This Dashboard?
Clinics work across many departments, so KPIs must cover clinical, operational, financial, and patient service areas. Here are some important KPI categories you can track:
Clinical KPIs
- Patient visits
- Consultation time
- Follow-up visits
- Treatment cycle time
Operational KPIs
- Appointment scheduling efficiency
- Average waiting time
- Staff productivity
- Diagnostic service performance
Financial KPIs
- Monthly revenue
- Revenue per doctor
- Billing accuracy
- Outstanding payments
Patient Experience KPIs
- Patient satisfaction score
- Complaint resolution time
- Referral rate
- Repeat visit percentage
This dashboard makes all these KPIs measurable and easy to track.
Advantages of Using a Clinics KPI Dashboard in Power BI
A Clinics KPI Dashboard offers many benefits. It transforms how your clinic operates and improves overall efficiency.
- Fast Decision-Making
The dashboard displays instant results for every KPI. You do not look at multiple spreadsheets or reports. Because of this clarity, you make better decisions quickly.
- Improved Patient Experience
You monitor waiting time, consultation time, and staff productivity in real time. As a result, you improve service quality and reduce delays.
- Better Revenue Tracking
Financial KPIs help you see how your clinic performs every month and year. You track revenue trends and understand which areas need improvement.
- Higher Staff Productivity
You monitor doctor performance, appointment efficiency, and workload distribution. This helps you optimize staff schedules and improve productivity.
- Smooth Operations
Your clinic runs better because every department works with accurate and updated data.
- Easy Updating Process
You only update the Excel file. Power BI handles all calculations and visuals automatically.
- Real-Time Insights
The dashboard refreshes instantly, giving you updated results whenever you need them.
How Does This Dashboard Help Clinic Managers?
Clinic managers handle multiple responsibilities daily. This dashboard supports them by:
- Showing monthly clinic performance
- Highlighting problem areas
- Improving team accountability
- Supporting patient-centered decisions
- Reducing workload through automation
Managers get a complete picture, so operations run smoothly.
Best Practices for Using a Clinics KPI Dashboard in Power BI
To get full value from this dashboard, follow these best practices:
- Update Data Monthly
Enter actual and target numbers every month so the dashboard stays accurate.
- Use Standard KPI Definitions
Keep clear formulas and descriptions for every KPI. This avoids confusion.
- Monitor Both MTD and YTD
Monthly and yearly views together help you understand long-term trends.
- Train Your Staff
Teach your doctors, billing team, and reception team how to read KPIs.
- Use Drill-Through Carefully
Check definitions before making decisions. This ensures accuracy.
- Compare Current Year with Previous Year
This helps you see improvement or decline clearly.
- Take Action Quickly
If a KPI icon turns red, fix the issue without delay.
- Review KPI Groups Regularly
Group KPIs into clinical, operational, financial, and service categories.
- Automate Data Refresh
Set scheduled refresh in Power BI Service for real-time insights.
Conclusion
A Clinics KPI Dashboard in Power BI gives clinic owners, doctors, and managers a complete and clear view of their performance. It tracks monthly and yearly KPIs, compares actuals with targets, and highlights improvements or gaps. Because it uses Excel as its data source, you update it easily and keep all information consistent.
Whether you manage a small clinic or a multi-branch chain, this dashboard helps you improve service quality, increase revenue, and run your operations smoothly. With real-time insights, better decisions, and clear visual analytics, you elevate your clinic’s performance to the next level.
Frequently Asked Questions (FAQs)
- What is a Clinics KPI Dashboard in Power BI?
It is an interactive reporting tool that tracks clinical, operational, financial, and patient-related performance metrics in one visual dashboard.
- Can I customize the KPIs?
Yes. You can add or remove KPIs based on your clinic’s needs by updating the Excel source file.
- Do I need advanced Power BI knowledge?
No. The dashboard works with simple Excel inputs and auto-refreshes.
- Can this dashboard work for multi-branch clinics?
Yes. You can use filters to track each branch separately or combine them.
- How often should I update data?
Update the Excel sheets every month to keep results accurate.
- Does this dashboard support year-over-year comparison?
Yes. It shows both MTD and YTD comparisons with previous year data.
- Can clinic staff use this dashboard easily?
Yes. The interface is simple, clean, and easy for non-technical users.
Visit our YouTube channel to learn step-by-step video tutorials
Watch the step-by-step video tutorial:
Click to buy Clinics KPI Dashboard in Power BI