Managing healthcare contracts is not simple. Hospitals, clinics, and healthcare organizations deal with multiple vendors, compliance rules, service-level agreements, and cost controls every day. Therefore, decision-makers need a reliable system that delivers real-time visibility, accuracy, and performance tracking.
That is exactly where the Health Contract Management KPI Dashboard in Power BI plays a vital role.
This comprehensive guide explains everything about the Health Contract Management KPI Dashboard in Power BI. You will learn how it works, why it matters, how to use it effectively, and how it improves contract performance across healthcare operations. Moreover, this article explains its advantages, best practices, and frequently asked questions in detail.
Click to buy Health Contract Management KPI Dashboard in Power BI
What Is a Health Contract Management KPI Dashboard in Power BI?
A Health Contract Management KPI Dashboard in Power BI is an interactive and data-driven reporting solution that helps healthcare organizations track, analyze, and manage contract-related performance indicators.
Instead of managing scattered Excel files and manual reports, this dashboard brings all contract KPIs into a single visual interface. As a result, decision-makers can monitor targets, evaluate performance, and identify risks in real time.
Moreover, this dashboard uses Excel as a data source, which makes data entry easy and flexible. You can update contract metrics without technical complexity and instantly view insights inside Power BI.
Why Do Healthcare Organizations Need a Contract Management KPI Dashboard?
Healthcare contracts directly affect costs, compliance, service quality, and vendor performance. However, managing them manually often leads to errors, delays, and poor visibility.
A Health Contract Management KPI Dashboard solves these problems by:
- Providing real-time KPI tracking
- Improving contract compliance monitoring
- Reducing financial leakages
- Supporting data-driven decision-making
- Enhancing vendor accountability
Moreover, when healthcare organizations track performance visually, they respond faster to issues and improve operational efficiency.
Overview of Health Contract Management KPI Dashboard
The Health Contract Management KPI Dashboard in Power BI is a ready-to-use dashboard designed specifically for healthcare contract tracking.
It includes:
- Clean visual layout
- Interactive slicers
- KPI-based performance indicators
- MTD and YTD analysis
- Excel-based data input
- Drill-through functionality
This dashboard contains three powerful pages, each serving a specific purpose.
Dashboard Structure and Features
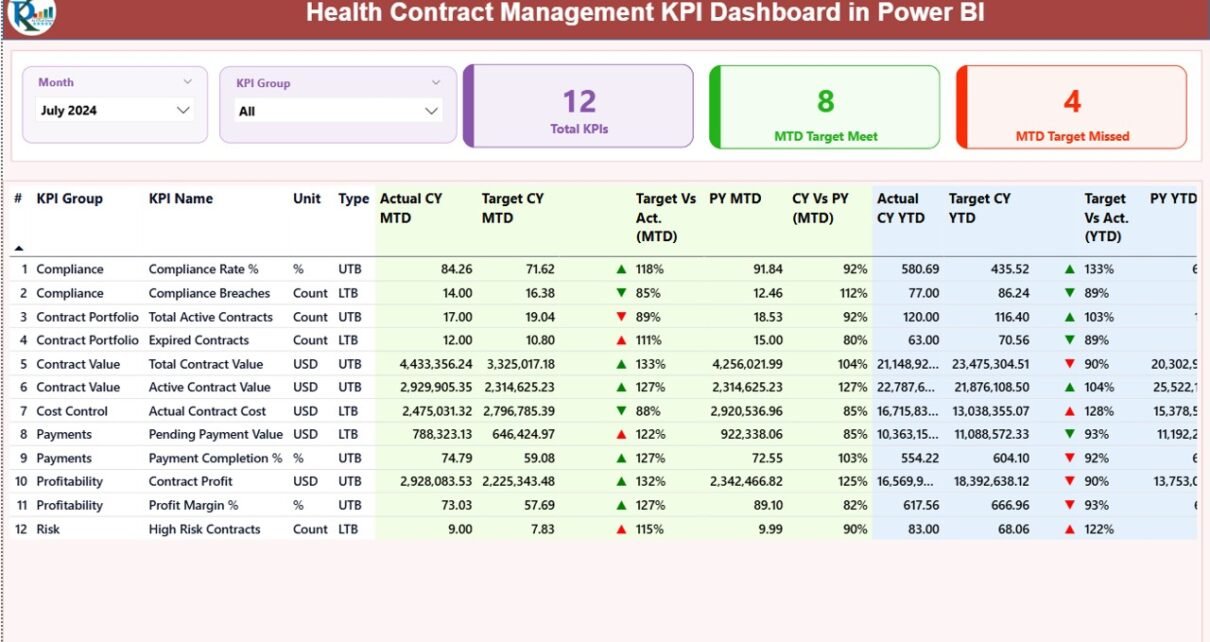
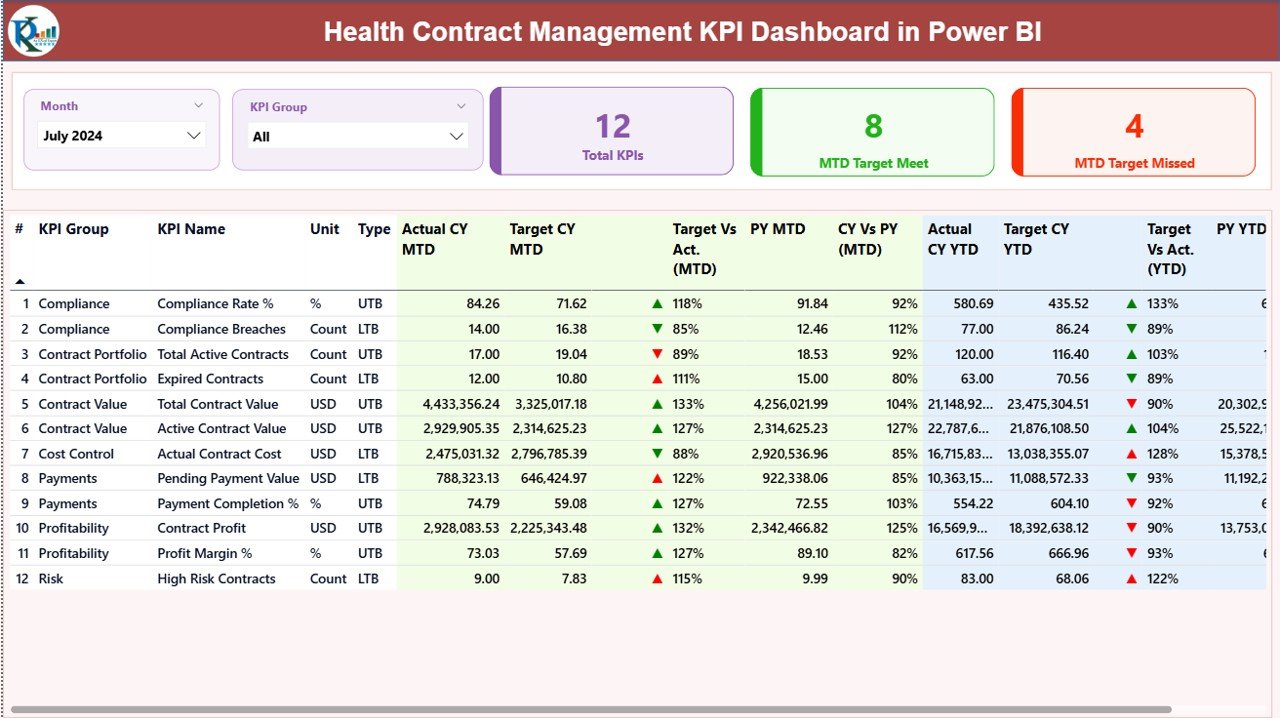
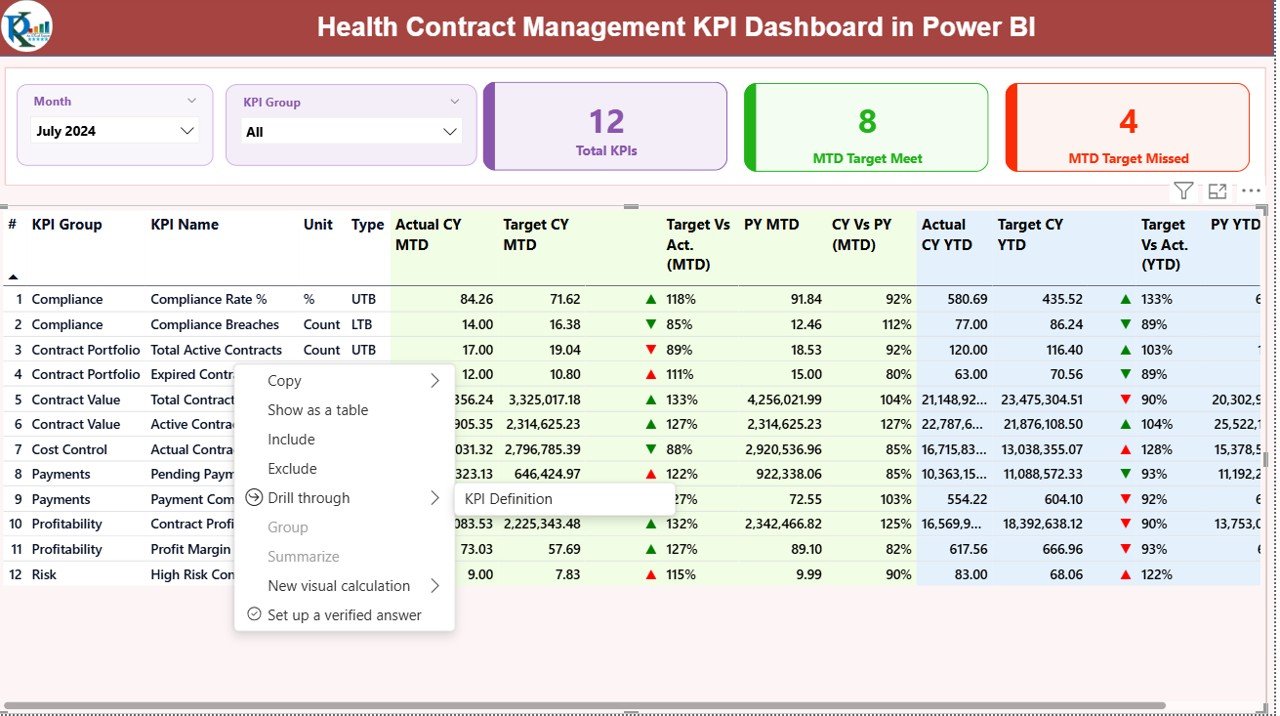
Summary Page – Complete Performance Snapshot
The Summary Page acts as the central control panel of the dashboard. It displays all key metrics at a glance.
Key Elements of Summary Page
Slicers
- Month Selector
- KPI Group Selector
These slicers help users filter performance data instantly.
KPI Cards
The dashboard displays three important cards:
- Total KPIs Count
- MTD Target Met
- MTD Target Missed
These cards quickly show overall performance health.
Detailed KPI Table (Core of the Dashboard)
Below the cards, the dashboard displays a structured KPI table that includes:
- KPI Number – Unique identifier for each KPI
- KPI Group – Category or classification of the KPI
- KPI Name – Name of the performance indicator
- Unit – Measurement unit (%, Days, Cost, etc.)
- Type – LTB (Lower the Better) or UTB (Upper the Better)
MTD Performance Metrics
- Actual CY MTD – Current year actual value
Target CY MTD – Current year target
MTD Status Icon –
🔺 Green arrow = Target achieved
🔻 Red arrow = Target missed
Target vs Actual (MTD) – Percentage comparison
PY MTD – Previous year same month value
- CY vs PY (MTD) – Year-over-year comparison
YTD Performance Metrics
- Actual CY YTD
- Target CY YTD
- YTD Status Icon
- Target vs Actual (YTD)
- PY YTD
- CY vs PY (YTD)
These metrics help healthcare leaders analyze long-term performance trends.
Click to buy Health Contract Management KPI Dashboard in Power BI
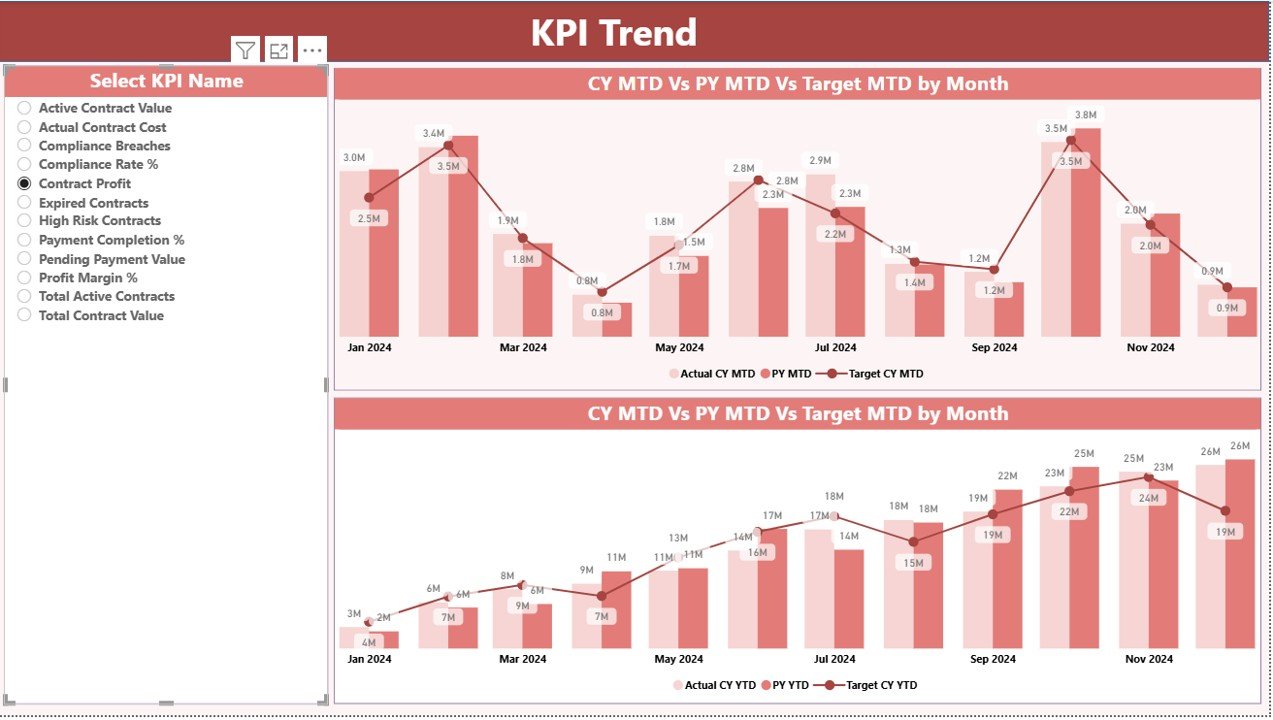
KPI Trend Page – Visual Performance Tracking
The KPI Trend Page focuses on trend analysis and performance comparison.
- Key Features
- Two combo charts
Comparison between:
Current Year Actual
Previous Year Actual
Target Values
Separate views for:
MTD Trends
YTD Trends
KPI selection slicer for focused analysis
This page helps identify:
- Performance improvement areas
- Seasonal trends
- Long-term growth or decline
Click to buy Health Contract Management KPI Dashboard in Power BI
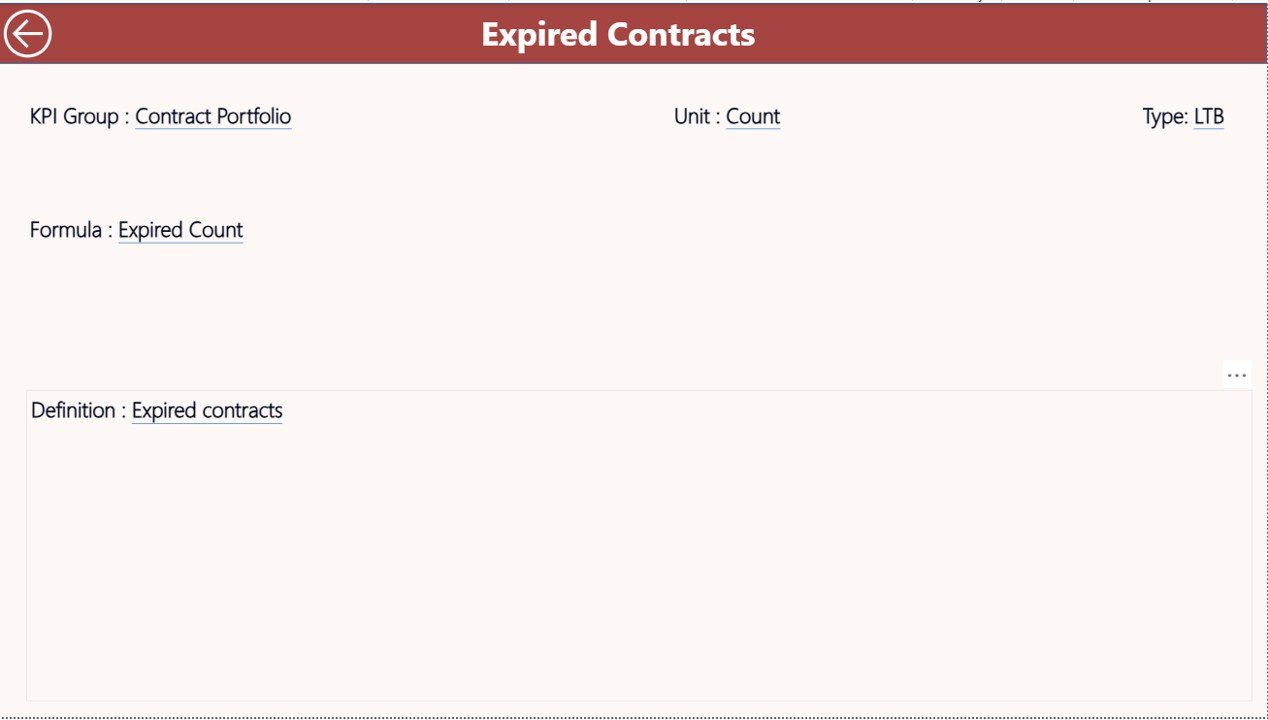
KPI Definition Page – Detailed KPI Explanation
The KPI Definition Page works as a drill-through page.
What This Page Shows:
- KPI Name
- KPI Formula
- KPI Definition
- KPI Type (LTB or UTB)
This page improves clarity and ensures every user understands how each KPI works.
Users can easily return to the summary page using the Back Button on the top-left corner.
Click to buy Health Contract Management KPI Dashboard in Power BI
Excel Data Structure Used in the Dashboard
The dashboard uses Excel as the backend data source, making it easy to maintain and update.
Sheet 1: Input_Actual
Used to store:
- KPI Name
- Month (First date of the month)
- MTD Actual
- YTD Actual
Sheet 2: Input_Target
Used to store:
- KPI Name
- Month
- MTD Target
- YTD Target
Click to buy Health Contract Management KPI Dashboard in Power BI
Sheet 3: KPI Definition
Contains:
- KPI Number
- KPI Group
- KPI Name
- Unit
- Formula
- Definition
- KPI Type (LTB or UTB)
This structure ensures clean data modeling and accurate reporting.
Advantages of Health Contract Management KPI Dashboard
Improves Contract Visibility
You can track every KPI in one place without searching multiple files.
Enhances Decision-Making
The dashboard delivers real-time insights that support faster decisions.
Saves Time
Automated calculations reduce manual effort and reporting time.
Improves Compliance Tracking
You can monitor contract compliance and identify risks early.
Supports Performance Optimization
Trend analysis helps improve vendor and contract performance.
Easy to Use
Excel-based input ensures ease of use for non-technical users.
.Highly Customizable
You can add KPIs, modify targets, and adjust visuals easily.
Best Practices for Health Contract Management KPI Dashboard
Define Clear KPIs
Always define KPIs that align with healthcare contract goals.
Maintain Accurate Data
Update Excel sheets regularly to maintain data accuracy.
Use Monthly Reviews
Analyze MTD and YTD data every month for better control.
Monitor Trend Changes
Track KPI movement instead of only looking at totals.
Use Drill-Through Wisely
Review KPI definitions before making decisions.
Standardize KPI Definitions
Ensure all departments follow the same KPI logic.
Train Users
Train staff to read dashboards correctly for better adoption.
Who Should Use This Dashboard?
This dashboard is ideal for:
- Healthcare Administrators
- Hospital Management Teams
- Contract Managers
- Finance Teams
- Procurement Departments
- Healthcare Consultants
- Performance Analysts
Why Choose Power BI for Health Contract Management?
Power BI offers:
- Interactive visuals
- Real-time data refresh
- Secure data handling
- Easy Excel integration
- Advanced analytics
- Professional reporting
As a result, healthcare organizations gain better visibility and control.
Conclusion
The Health Contract Management KPI Dashboard in Power BI provides a powerful, user-friendly, and data-driven solution for managing healthcare contracts efficiently.
By combining structured KPI tracking, visual analytics, and Excel-based data input, this dashboard helps organizations:
- Monitor performance
- Improve compliance
- Reduce financial risks
- Enhance operational efficiency
Moreover, the dashboard simplifies decision-making and ensures transparency across contract operations. If your organization aims to improve contract performance, this dashboard becomes an essential tool.
Frequently Asked Questions (FAQs)
What is a Health Contract Management KPI Dashboard?
It is a Power BI dashboard that tracks healthcare contract performance using KPIs, trends, and visual analytics.
Can I update data using Excel?
Yes, the dashboard uses Excel as a data source, making updates simple and flexible.
What KPIs does the dashboard track?
It tracks MTD, YTD, target vs actual, previous year comparisons, and performance indicators.
Is this dashboard customizable?
Yes, you can add KPIs, change visuals, and modify formulas easily.
Who can use this dashboard?
Healthcare managers, contract teams, finance professionals, and analysts can use it.
Does it support trend analysis?
Yes, the KPI Trend page shows MTD and YTD trends clearly.
Is Power BI required to use this dashboard?
Yes, Power BI Desktop is required to view and interact with the dashboard.
Visit our YouTube channel to learn step-by-step video tutorials
Watch the step-by-step video tutorial:
Click to buy Health Contract Management KPI Dashboard in Power BI