Healthcare organizations handle thousands of purchasing transactions every month. Therefore, without a structured monitoring system, purchasing teams often struggle with cost overruns, supplier inefficiencies, and missed performance targets. That is exactly why a Health Purchasing KPI Dashboard in Power BI plays a critical role in modern healthcare management.
This article explains everything about the Health Purchasing KPI Dashboard in Power BI, including its structure, features, benefits, working process, and best practices. Moreover, you will also learn how this dashboard improves decision-making, increases transparency, and ensures data-driven purchasing operations.
If you want full control over healthcare purchasing performance, this guide will help you understand why this dashboard is essential.
Click to buy Health Purchasing KPI Dashboard in Power BI
What Is a Health Purchasing KPI Dashboard in Power BI?
A Health Purchasing KPI Dashboard in Power BI is a visual analytics tool that helps healthcare organizations track, analyze, and optimize purchasing performance using key performance indicators (KPIs).
Instead of managing scattered Excel sheets and manual reports, this dashboard centralizes all purchasing metrics into one interactive Power BI report. As a result, purchasing managers can quickly identify performance gaps, control costs, and improve supplier efficiency.
Moreover, the dashboard connects directly with Excel, which makes data entry easy and flexible. You only need to update the Excel file, and Power BI automatically refreshes all reports and visuals.
Why Do Healthcare Organizations Need a Purchasing KPI Dashboard?
Healthcare purchasing involves complex operations. Therefore, organizations must monitor performance continuously. Without a structured dashboard, decision-makers often face:
- Lack of visibility into purchasing trends
- Delays in identifying cost overruns
- Poor tracking of targets vs actuals
- Manual reporting errors
- Limited data-driven decision-making
However, a Health Purchasing KPI Dashboard in Power BI solves these problems effectively.
Key Reasons to Use a Purchasing KPI Dashboard
- It provides real-time performance visibility
- It improves cost control and budgeting
- It supports better vendor evaluation
- It reduces manual reporting work
- It improves strategic decision-making
As a result, healthcare organizations achieve better purchasing efficiency and financial control.
Overview of Health Purchasing KPI Dashboard in Power BI
The Health Purchasing KPI Dashboard is a ready-to-use Power BI solution designed specifically for healthcare procurement teams.
The dashboard includes three powerful pages, each serving a specific purpose:
- Summary Page
- KPI Trend Page
- KPI Definition Page
Additionally, the dashboard uses Excel as the data source, which ensures easy updates and flexibility.
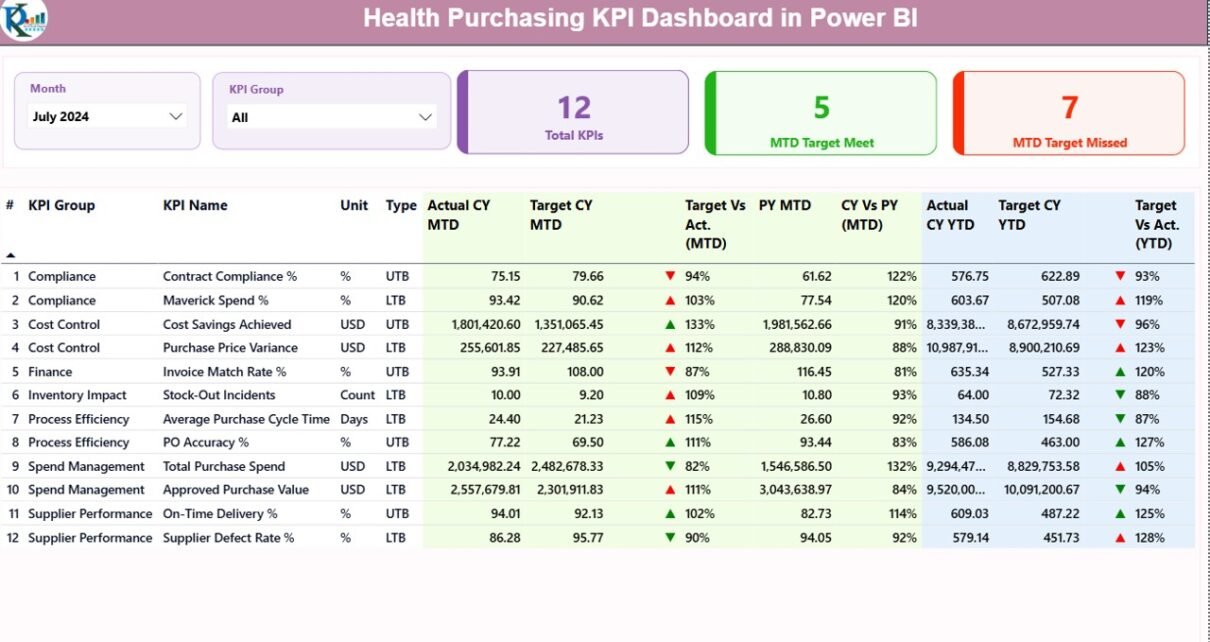
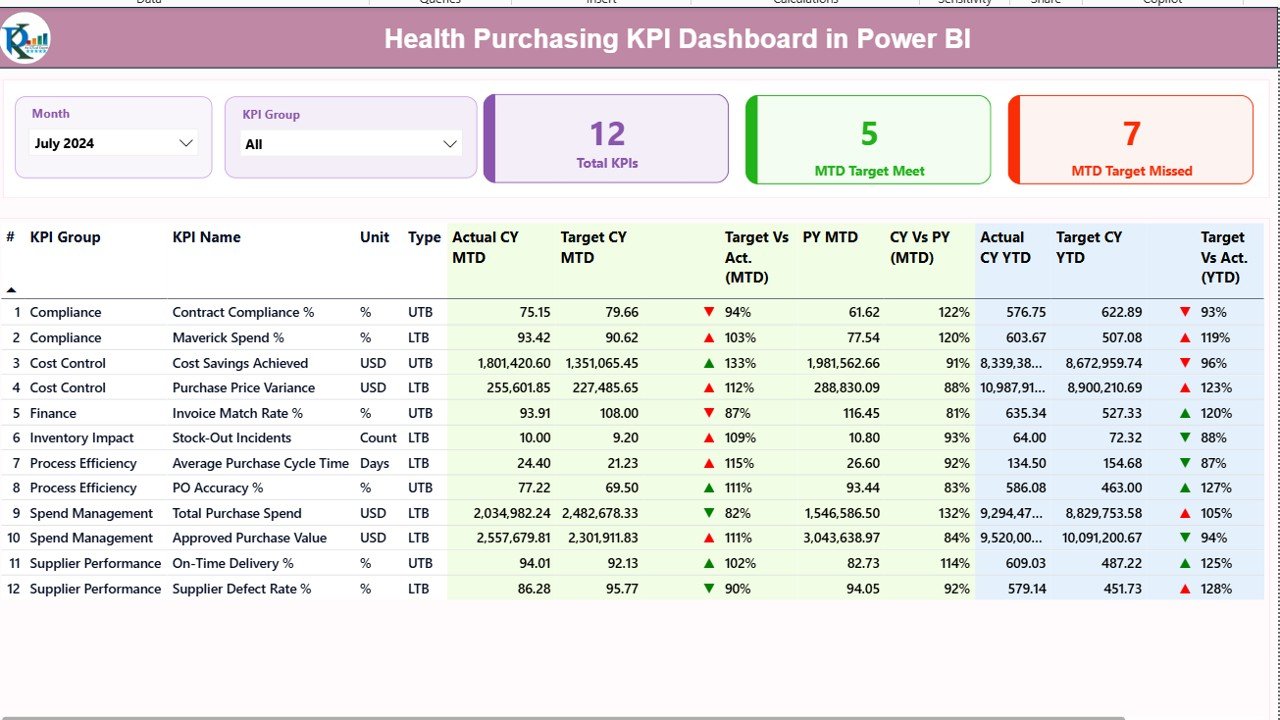
Summary Page – Central View of Purchasing Performance
The Summary Page acts as the main control panel of the dashboard. It displays all key performance metrics at a glance.
Key Features of the Summary Page
- Month and KPI Group Slicer
At the top of the page, you can find:
- Month slicer
- KPI Group slicer
These slicers allow users to filter data dynamically and analyze performance for specific periods or KPI categories.
Click to buy Health Purchasing KPI Dashboard in Power BI
KPI Summary Cards
The dashboard shows three powerful KPI cards:
- Total KPIs Count – Displays the total number of KPIs tracked
- MTD Target Met – Shows how many KPIs achieved targets
- MTD Target Missed – Highlights KPIs that missed targets
These cards instantly give decision-makers a performance snapshot.
Detailed KPI Table
Below the KPI cards, the dashboard displays a comprehensive KPI table with the following fields:
KPI Number
A unique identifier assigned to each KPI.
KPI Group
Shows the category or group to which the KPI belongs.
KPI Name
Displays the name of the KPI being tracked.
Unit
Indicates the unit of measurement such as %, count, or amount.
Type (LTB / UTB)
- LTB (Lower the Better) – Used for cost or error-based KPIs
- UTB (Upper the Better) – Used for performance or efficiency KPIs
Actual CY MTD
Displays the actual performance value for the current month.
Target CY MTD
Shows the target value for the current month.
MTD Status Icon
- ▲ Green arrow → Target achieved
- ▼ Red arrow → Target missed
This icon allows users to instantly identify performance issues.
Target vs Actual (MTD)
Calculated using the formula:
Actual MTD / Target MTD
This metric shows how close the organization is to achieving its monthly goal.
Previous Year MTD
Displays the same period’s performance from the previous year.
CY vs PY (MTD)
Compares current month performance with the previous year using:
Current Year MTD / Previous Year MTD
YTD Performance Tracking
The dashboard also includes year-to-date analysis:
- Actual CY YTD
- Target CY YTD
- YTD Status Icon
- Target vs Actual (YTD)
- Previous Year YTD
- CY vs PY (YTD)
This section helps management track long-term performance trends.
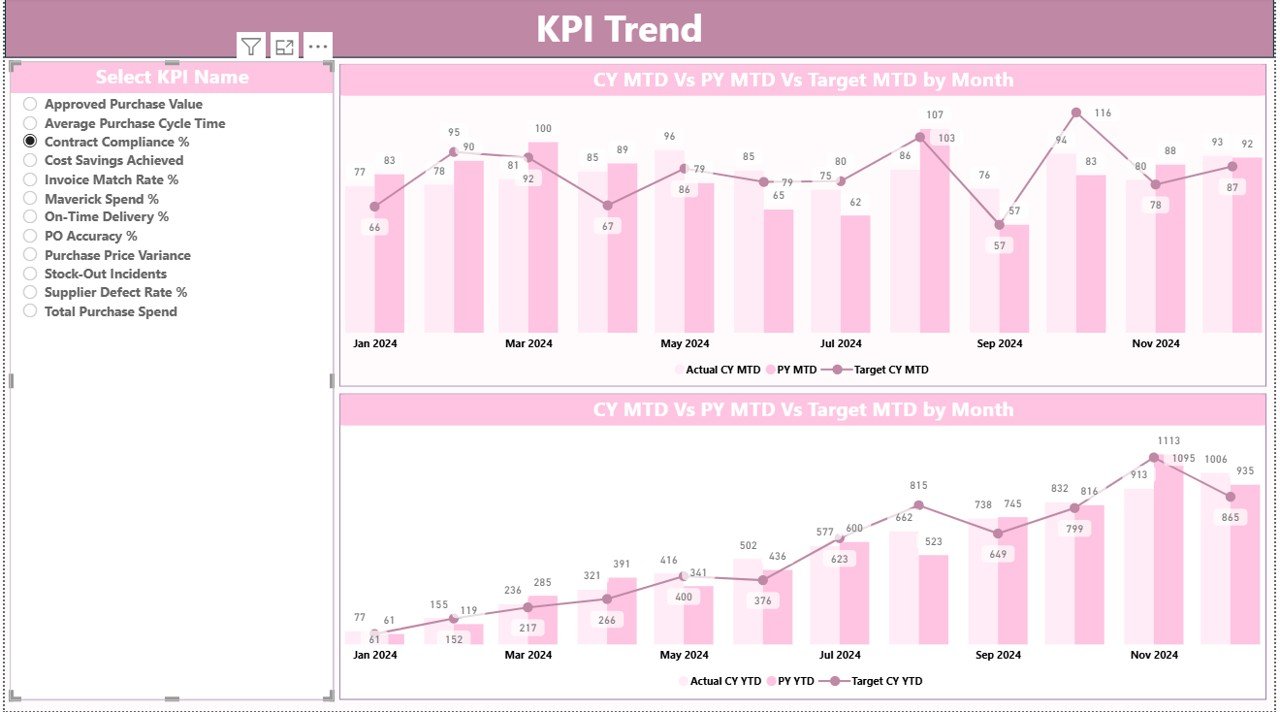
KPI Trend Page – Performance Visualization
The KPI Trend Page helps users analyze KPI performance visually.
Key Features of the KPI Trend Page
Two interactive combo charts
Current Year vs Previous Year comparison
Target comparison
MTD and YTD analysis
KPI selection slicer
How This Page Helps
- Identifies performance trends
- Highlights seasonal variations
- Shows target achievement patterns
- Supports better forecasting
Moreover, users can select any KPI from the slicer to view detailed trend analysis.
Click to buy Health Purchasing KPI Dashboard in Power BI
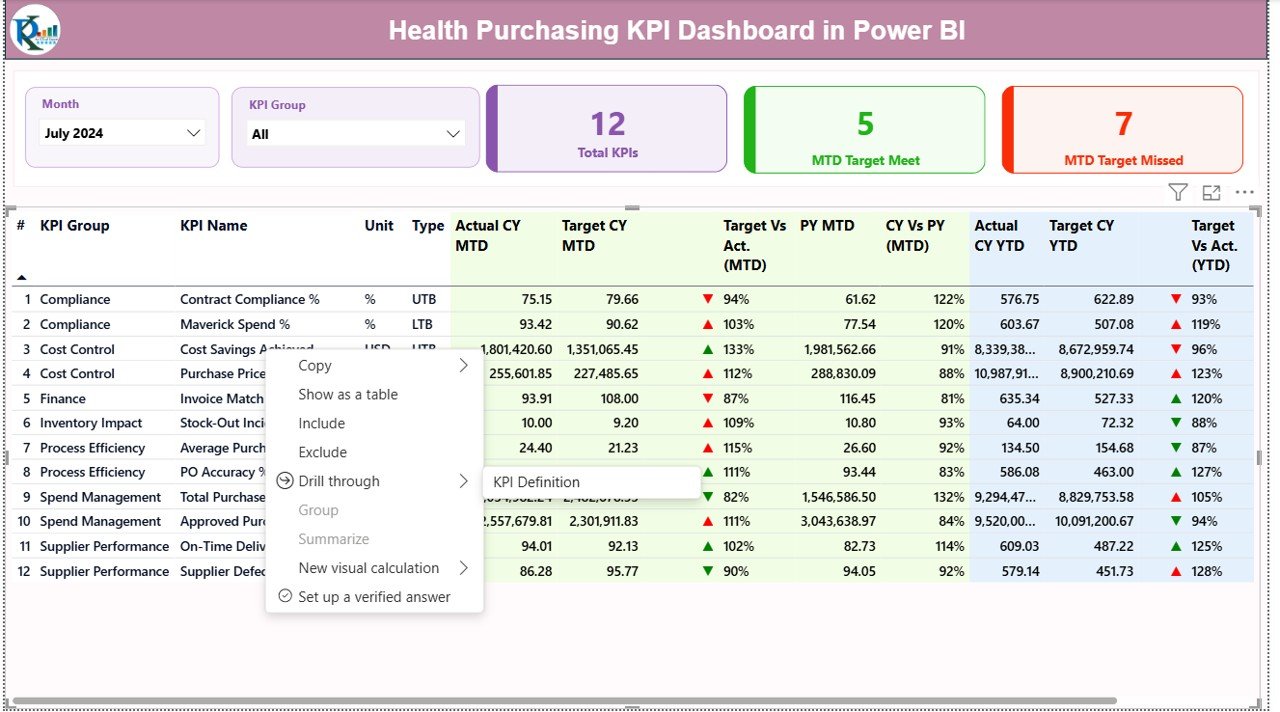
KPI Definition Page – Complete KPI Understanding
The KPI Definition Page acts as a reference page.
Features of KPI Definition Page
- KPI Name
- KPI Number
- KPI Group
- Unit of Measurement
- KPI Formula
- KPI Definition
- KPI Type (LTB / UTB)
This page remains hidden by default. However, users can access it using the drill-through option from the Summary Page.
Why This Page Matters
- Ensures KPI clarity
- Improves user understanding
- Avoids interpretation errors
- Supports training and audits

Click to buy Health Purchasing KPI Dashboard in Power BI
Excel Data Structure Used in the Dashboard
The dashboard uses an Excel file as its data source. This approach ensures flexibility and ease of use.
Input_Actual Sheet
This sheet stores actual performance data.
Required columns:
- KPI Name
- Month (first date of the month)
- MTD Value
- YTD Value
Users only need to update these values monthly.
⃣Input_Target Sheet
This sheet stores target values.
Required columns:
- KPI Name
- Month
- MTD Target
- YTD Target
This data helps compare performance against planned targets.
KPI Definition Sheet
This sheet defines KPIs.
Columns include:
- KPI Number
- KPI Group
- KPI Name
- Unit
- Formula
- Definition
- Type (LTB / UTB)
This structure ensures consistency across all reports.
Click to buy Health Purchasing KPI Dashboard in Power BI
Advantages of Health Purchasing KPI Dashboard in Power BI
Improves Purchasing Visibility
The dashboard provides real-time visibility into purchasing performance. Therefore, decision-makers can take action faster.
Enhances Cost Control
Since the dashboard highlights target vs actual values, organizations can control overspending easily.
Saves Time and Effort
Automated calculations eliminate manual reporting and reduce errors.
Supports Data-Driven Decisions
Visual insights help management make informed decisions based on facts, not assumptions.
Easy to Use and Maintain
Excel-based input makes the system user-friendly for non-technical users.
Improves Accountability
Each KPI has a clear definition and owner, which improves accountability.
Best Practices for Health Purchasing KPI Dashboard
Keep KPIs Relevant
Always track KPIs that directly impact purchasing performance.
Update Data Regularly
Update Excel data on a monthly basis to maintain accuracy.
Use Clear KPI Definitions
Define each KPI clearly to avoid confusion.
Review Trends Periodically
Analyze MTD and YTD trends to identify improvement areas.
Use Visual Indicators Wisely
Icons and colors should clearly reflect performance status.
Train Users Properly
Ensure users understand how to interpret the dashboard.
Review Targets Annually
Update targets based on business goals and market conditions.
How This Dashboard Helps Healthcare Organizations
This dashboard helps healthcare organizations:
- Reduce purchasing costs
- Improve vendor performance
- Track procurement efficiency
- Increase transparency
- Improve audit readiness
- Strengthen data-driven culture
As a result, organizations achieve better financial control and operational efficiency.
Conclusion
The Health Purchasing KPI Dashboard in Power BI serves as a powerful tool for healthcare organizations that want to manage purchasing performance efficiently.
It simplifies complex data, improves visibility, and supports faster decision-making. Moreover, its Excel-based structure makes it easy to maintain, while Power BI visuals make insights clear and actionable.
By implementing this dashboard, healthcare organizations can move from manual tracking to intelligent, data-driven purchasing management.
Frequently Asked Questions (FAQs)
What is a Health Purchasing KPI Dashboard?
A Health Purchasing KPI Dashboard is a Power BI report that tracks purchasing performance using key metrics such as targets, actuals, trends, and comparisons.
What data source does this dashboard use?
The dashboard uses Excel as its primary data source, making it simple and flexible.
Can non-technical users use this dashboard?
Yes. The dashboard is user-friendly and requires only basic Excel knowledge.
What KPIs can I track?
You can track cost efficiency, supplier performance, purchase volume, target achievement, and more.
Can I customize the KPIs?
Yes. You can easily modify KPIs using the KPI Definition sheet.
Does the dashboard support MTD and YTD analysis?
Yes. It includes both Month-to-Date and Year-to-Date performance tracking.
Is this dashboard suitable for hospitals?
Absolutely. It works perfectly for hospitals, clinics, and healthcare organizations.
Click to buy Health Purchasing KPI Dashboard in Power BI
Visit our YouTube channel to learn step-by-step video tutorials
Watch the step-by-step video tutorial: