Managing healthcare projects is complex. Hospitals and healthcare organizations handle infrastructure upgrades, IT system implementations, medical equipment installations, compliance initiatives, and patient service improvement programs at the same time. Because budgets remain tight and timelines stay critical, healthcare leaders need complete visibility into project performance, cost control, and delivery progress.
That is exactly why a Health Project Management Dashboard in Power BI becomes an essential solution. This ready-to-use dashboard converts raw project data into clear, interactive, and actionable insights. It allows hospital administrators, project managers, finance teams, and leadership to monitor project status, cost variance, risk levels, and completion trends in real time.
In this article, we explain how the Health Project Management Dashboard in Power BI works, what insights it delivers, how each dashboard section supports decision-making, and why healthcare organizations rely on it for better project governance.
What Is a Health Project Management Dashboard in Power BI?
A Health Project Management Dashboard in Power BI is a centralized reporting solution designed to track and analyze healthcare project performance. It consolidates data such as planned budgets, actual costs, project status, risk levels, and completion rates into a single interactive dashboard.
Because the dashboard uses Power BI, users benefit from:
-
Real-time data refresh
-
Interactive filtering and drill-downs
-
Clear visuals for executives
-
Scalable analytics across hospitals and departments
-
Secure and role-based access
Instead of relying on multiple spreadsheets and static reports, healthcare organizations gain a single source of truth for project monitoring.
Key Objectives of the Dashboard
Click to Buy Health Project Management Dashboard in Power BI
This dashboard helps healthcare organizations:
-
Control project budgets
-
Track cost overruns early
-
Monitor project completion progress
-
Manage project risks proactively
-
Improve accountability across teams
-
Support data-driven project decisions
Each dashboard page focuses on a specific performance dimension, making insights easy to understand and act upon.
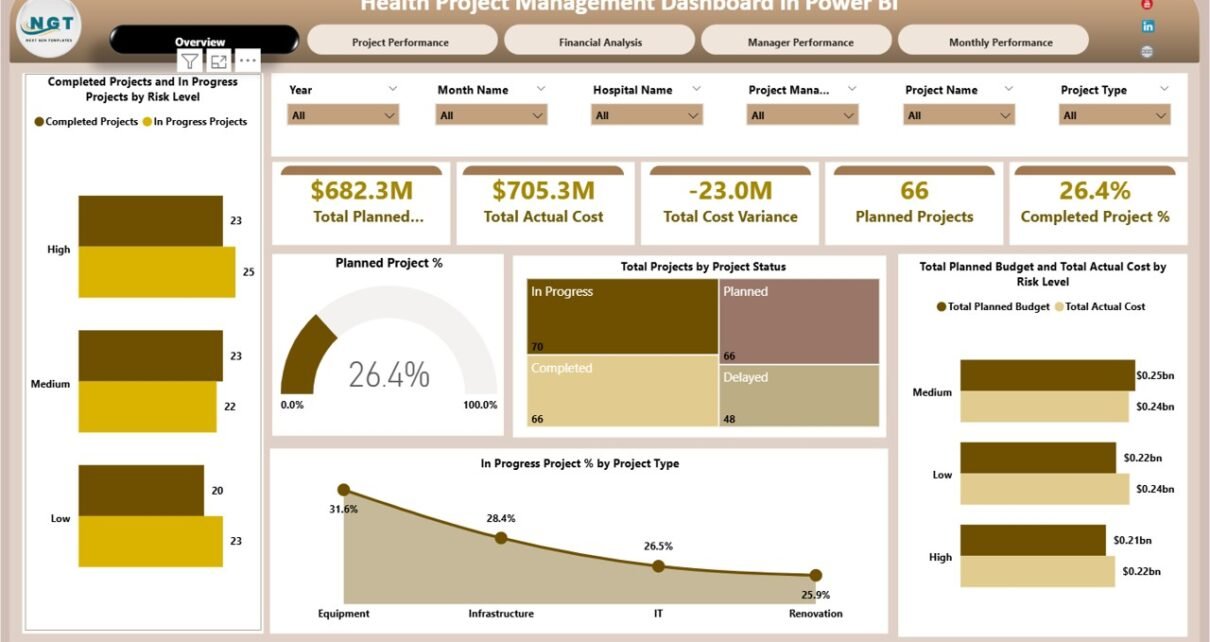
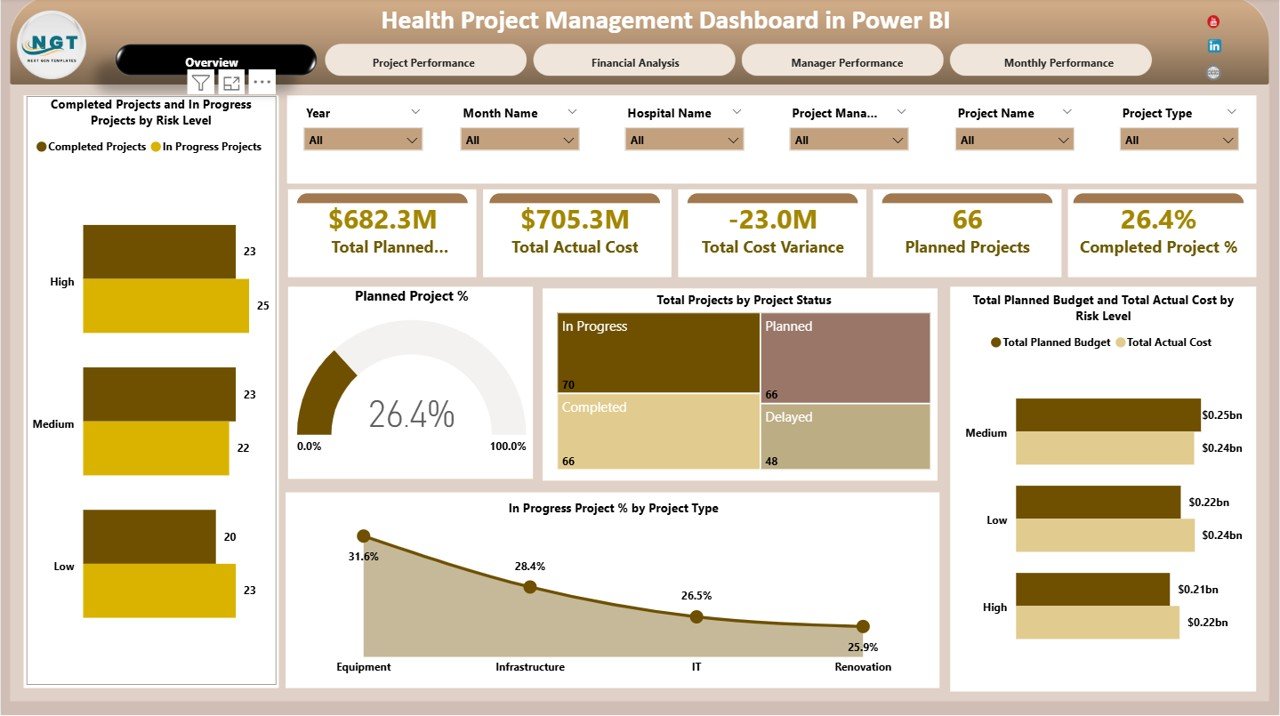
Overview Section –
The Overview section provides a high-level summary of all healthcare projects.
KPI Cards
These cards display instant performance metrics:
-
Total Planned Budget – Total approved budget for all projects
-
Total Actual Cost – Actual spending to date
-
Total Cost Variance – Difference between planned and actual cost
-
Planned Projects – Total number of approved projects
-
Completed Project % – Percentage of completed projects
These KPIs give leadership immediate clarity on financial health and project progress.
Overview Charts
Completed Projects and In-Progress Projects by Risk Level
This chart highlights how many projects fall under low, medium, or high risk and their current status. It helps leadership focus on high-risk projects before issues escalate.
Planned Project %
Shows how many projects remain planned versus executed. This supports resource planning and execution tracking.
Total Projects by Project Status
Displays projects by status such as Planned, In Progress, Completed, or On Hold. It improves transparency and accountability.
Total Planned Budget vs Total Actual Cost by Risk Level
Compares budget and spending across risk categories. This helps identify cost overruns linked to higher-risk projects.
In-Progress Project % by Project Type
Shows which project types remain active, such as IT, Infrastructure, Equipment, or Compliance initiatives.
Click to Buy Health Project Management Dashboard in Power BI
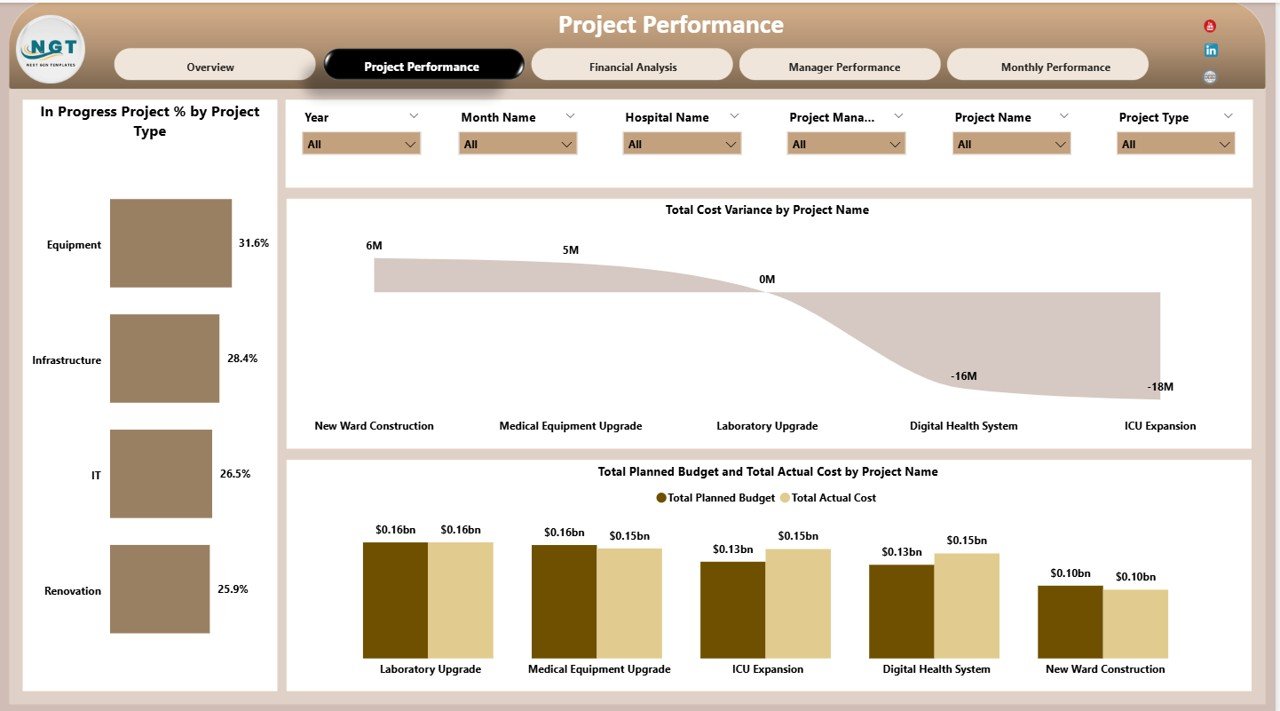
Project Performance Section
This section focuses on how different project categories perform.
Key Charts
In-Progress Project % by Project Type
Helps understand which project categories consume the most time and resources.
Total Cost Variance by Project Name
Identifies projects with major budget deviations so teams can take corrective actions early.
Total Planned Budget vs Total Actual Cost by Project Name
Provides a detailed comparison for each project, helping managers track financial discipline.
This section supports project prioritization and financial control.
Click to Buy Health Project Management Dashboard in Power BI
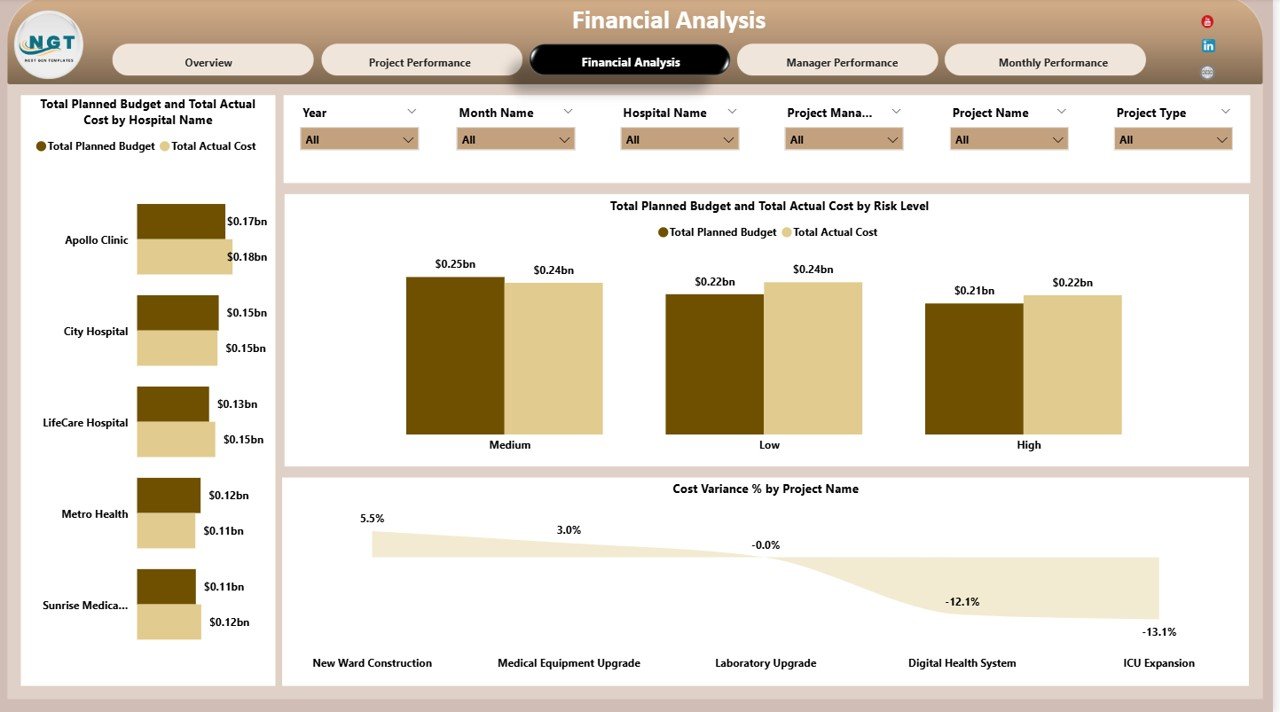
Financial Analysis Section
Healthcare projects often involve significant investments. This section ensures financial transparency.
Key Charts
Total Planned Budget vs Total Actual Cost by Hospital Name
Compares spending efficiency across hospitals or facilities.
Total Planned Budget vs Total Actual Cost by Risk Level
Reinforces how risk impacts cost control.
Cost Variance % by Project Name
Shows percentage deviation from budget, making it easier to assess financial risk.
This analysis helps finance teams enforce budget discipline across projects.
Click to Buy Health Project Management Dashboard in Power BI
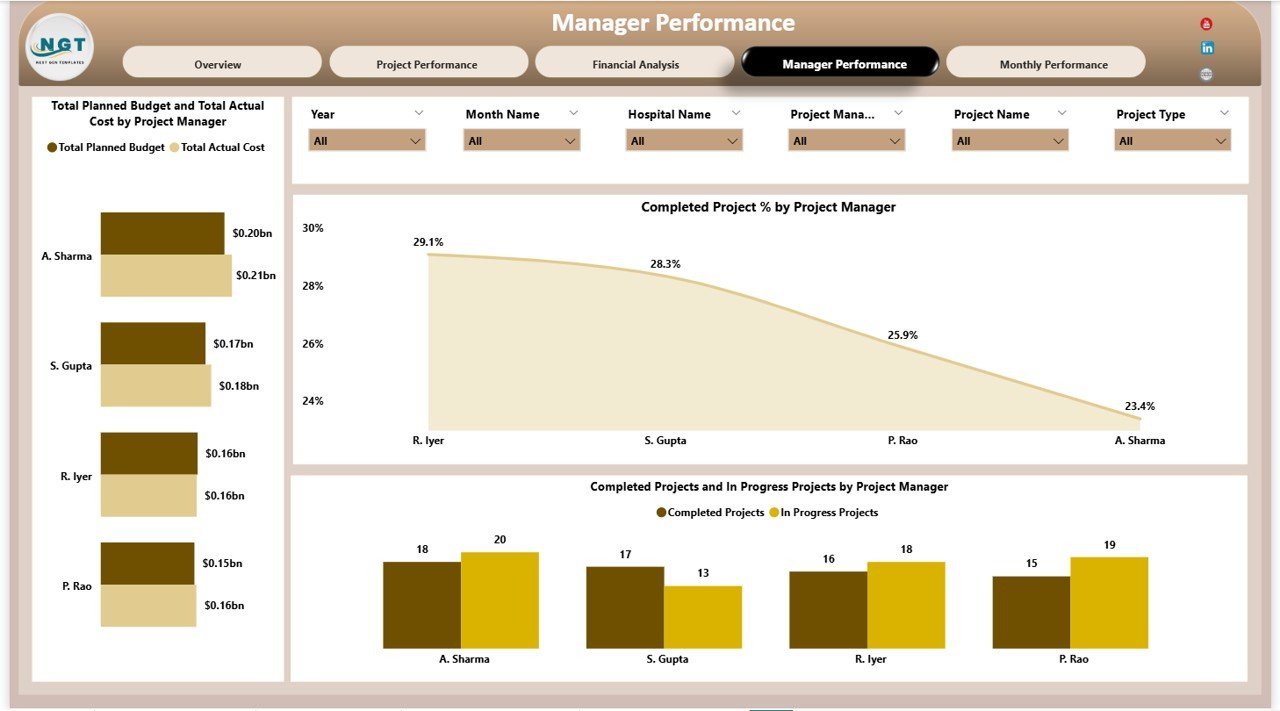
Manager Performance Section
Strong project outcomes depend on effective leadership.
Key Charts
Total Planned Budget vs Total Actual Cost by Project Manager
Highlights how well each project manager controls costs.
Completed Project % by Project Manager
Shows delivery efficiency by manager.
Completed Projects and In-Progress Projects by Project Manager
Balances workload visibility and performance accountability.
This section helps leadership identify top performers and training needs.
Click to Buy Health Project Management Dashboard in Power BI
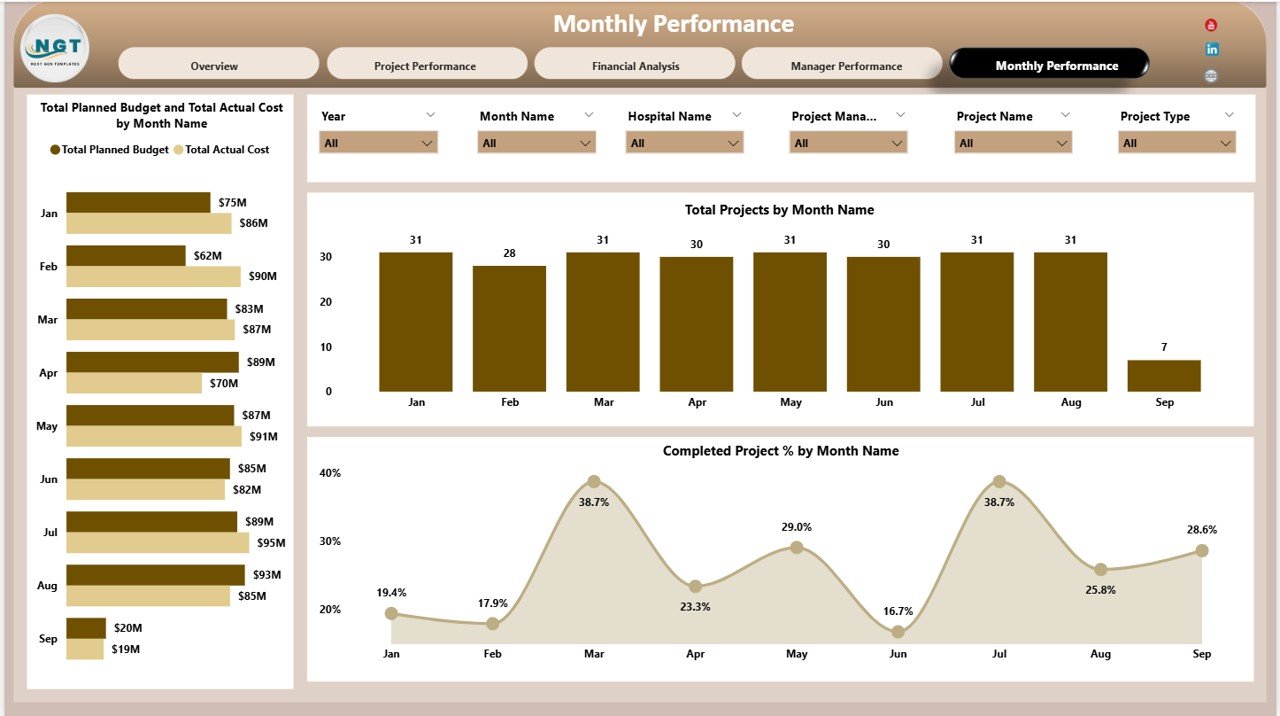
Monthly Performance Section
Tracking trends over time helps predict future outcomes.
Key Charts
Total Planned Budget vs Total Actual Cost by Month Name
Reveals spending trends and seasonal patterns.
Total Projects by Month Name
Shows project initiation and completion flow.
Completed Project % by Month Name
Tracks improvement in execution efficiency over time.
Monthly trend analysis supports forecasting and capacity planning.
Click to Buy Health Project Management Dashboard in Power BI
Advantages of Health Project Management Dashboard in Power BI
-
Centralized project monitoring
-
Real-time cost and progress tracking
-
Early detection of budget overruns
-
Clear visibility across hospitals and departments
-
Improved accountability for project managers
-
Executive-friendly visuals
-
Scalable across large healthcare networks
Because of these benefits, healthcare organizations achieve better project outcomes with fewer surprises.
Opportunities for Improvement in Health Project Management
Click to Buy Health Project Management Dashboard in Power BI
Even a strong dashboard can evolve further. Healthcare teams can enhance this dashboard by:
-
Adding project milestone tracking
-
Including resource utilization metrics
-
Integrating risk mitigation action tracking
-
Adding forecast vs actual projections
-
Automating data refresh from project management tools
These improvements increase strategic value and predictive insights.
Best Practices for Using the Dashboard
-
Update project data regularly
-
Review high-risk projects weekly
-
Monitor cost variance early, not after completion
-
Use manager-level insights for coaching
-
Align dashboard KPIs with organizational goals
-
Share insights during leadership reviews
Consistent usage ensures maximum return on the dashboard investment.
Why Healthcare Organizations Prefer Power BI for Project Dashboards
Click to Buy Health Project Management Dashboard in Power BI
Power BI suits healthcare project management because it offers:
-
Secure data handling
-
Role-based access
-
High-performance analytics
-
Easy integration with Excel, SQL, and ERP systems
-
Interactive and executive-ready visuals
As a result, Power BI becomes the preferred platform for healthcare analytics.
Conclusion
A Health Project Management Dashboard in Power BI gives healthcare organizations full control over project execution, budget management, and performance tracking. It transforms complex project data into clear insights that support faster decisions, stronger accountability, and improved financial outcomes.
With structured analysis across risk, cost, manager performance, and monthly trends, this dashboard becomes an essential tool for hospitals and healthcare leaders aiming for operational excellence.
Frequently Asked Questions (FAQs)
Click to Buy Health Project Management Dashboard in Power BI
1. Who should use this dashboard?
Hospital administrators, project managers, finance teams, and healthcare leadership.
2. Can this dashboard handle multiple hospitals?
Yes, it scales easily across multiple facilities.
3. Does it support real-time updates?
Yes, Power BI supports automated data refresh.
4. Can I customize project categories?
Yes, the dashboard structure allows easy customization.
5. Does it help reduce cost overruns?
Yes, early visibility helps prevent uncontrolled spending.
6. Is this suitable for large healthcare networks?
Absolutely. Power BI handles large datasets efficiently.
Visit our YouTube channel to learn step-by-step video tutorials
Watch the step-by-step video tutorial:
Click to Buy Health Project Management Dashboard in Power BI