Introduction
The Clinical Trials Management KPI Dashboard is an essential tool designed to streamline and enhance the monitoring of critical performance indicators in clinical trials. This ready-to-use template enables clinical research teams to track, analyze, and manage key performance metrics efficiently. In this article, we will explore the dashboard’s key features, explain its worksheets, discuss its advantages, and offer best practices for its optimal usage.
Key Features of Clinical Trials Management KPI Dashboard
- Seven comprehensive worksheets dedicated to different functions.
- Interactive drop-downs for month and KPI selections.
- Visual indicators like conditional formatting with up/down arrows to highlight KPI performance.
- Comparison of Month-to-Date (MTD), Year-to-Date (YTD), previous year data, and targets.
- Trend charts for KPIs showing actual, target, and previous year progress.
- Clear input sheets for actual numbers, target numbers, and previous year values.
- Detailed KPI definitions with measurement units, formulas, and performance type guidance.
Dashboard Pages Explanation
Click to Buy Clinical Trials Management KPI Dashboard in Excel
1. Home Sheet
This is the index sheet that provides six buttons for easy navigation to the respective worksheets within the dashboard.

Home Page
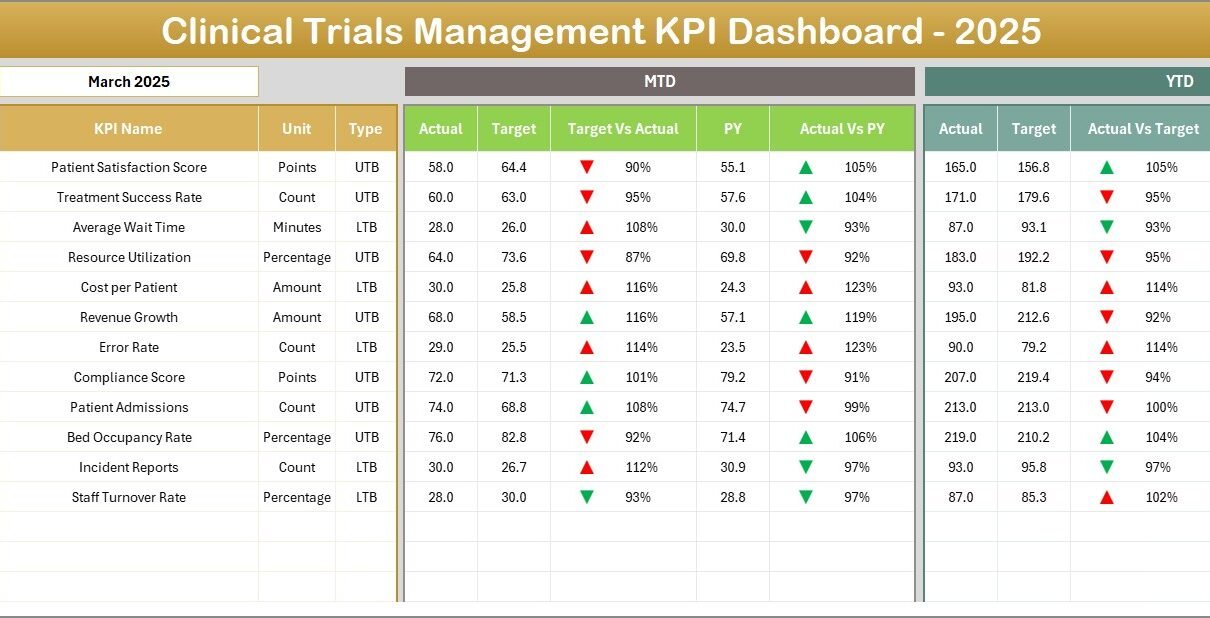
2. Dashboard Sheet
The main KPIs are displayed here with dynamic filtering by month via a drop-down on cell D3. Numerical data for MTD Actual, Target, Previous Year (PY) along with Target vs Actual and PY vs Actual comparisons are presented. Conditional formatting with up/down arrows visually indicates performance betterments or declines. Similarly, YTD figures are also shown in this sheet.
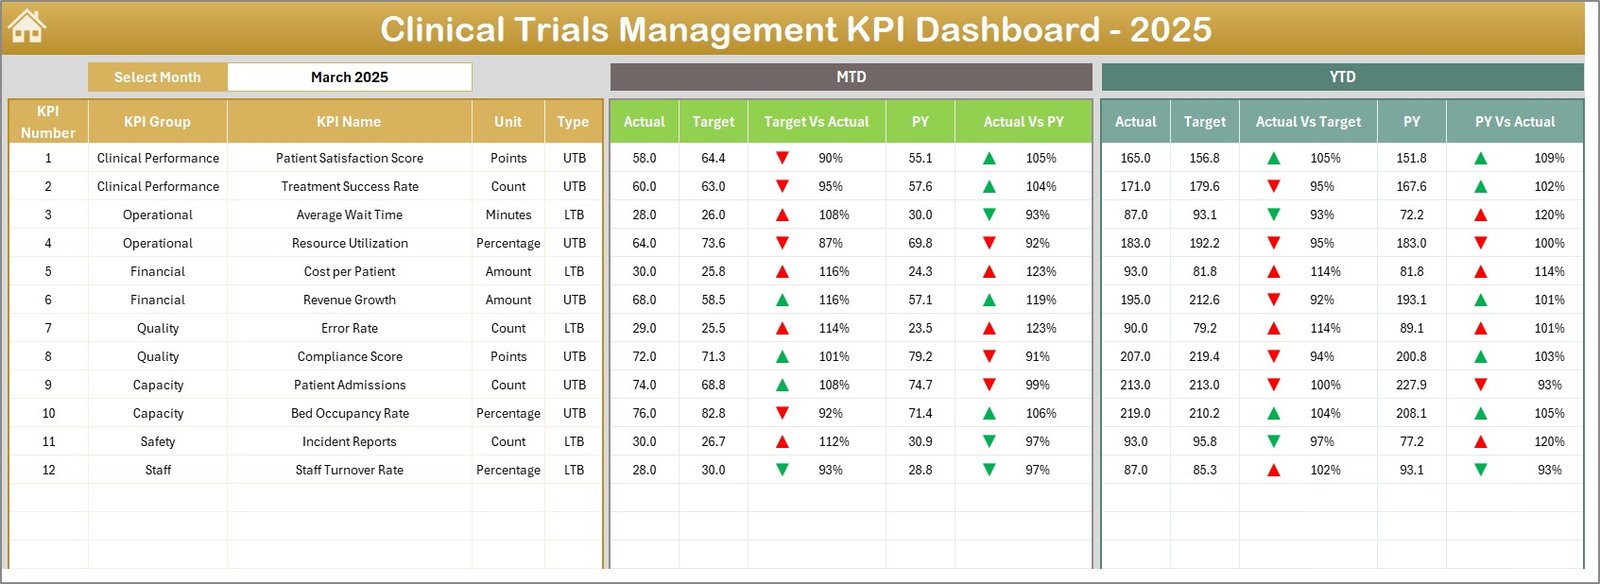
Clinical Trials Management KPI Dashboard
Click to Buy Clinical Trials Management KPI Dashboard in Excel
3. KPI Trend Sheet
Users select specific KPIs through a drop-down on cell C3 and view detailed KPI metadata such as group, unit, formula, and definition. This sheet also includes visual trend charts for MTD and YTD Actual, Target, and PY values helping identify performance patterns over time.
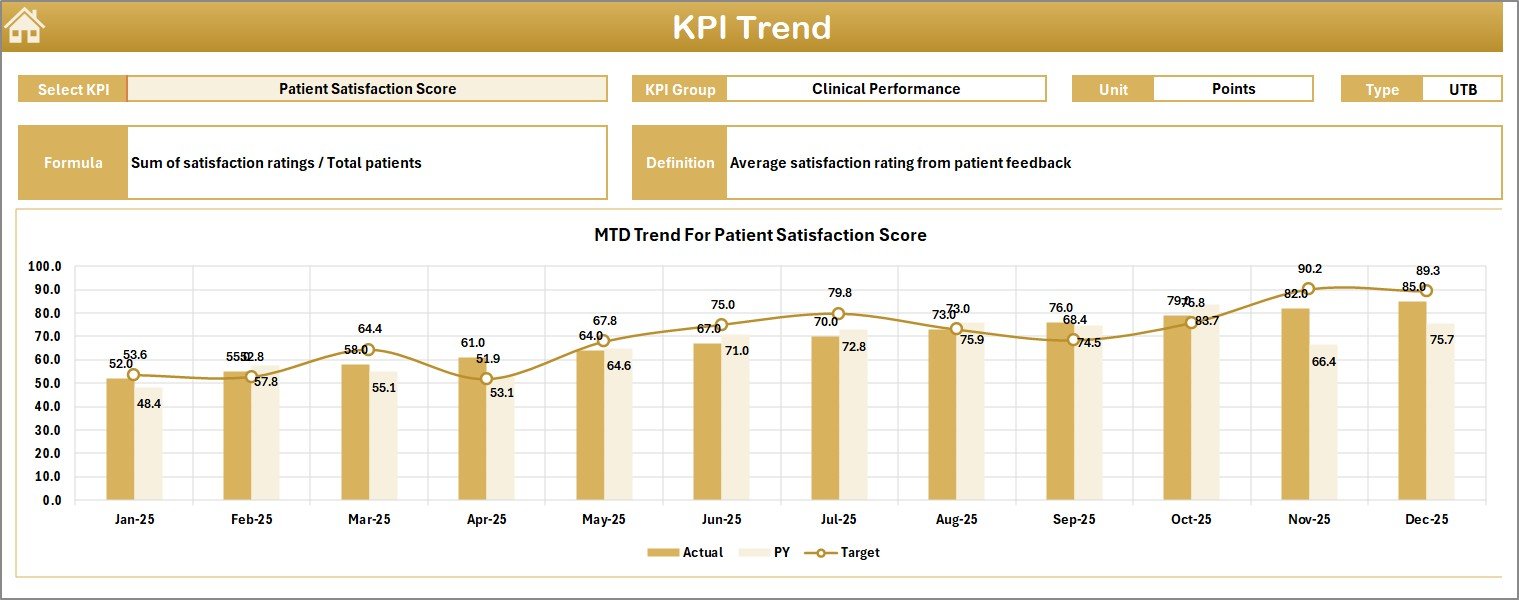
KPI Trend Sheet
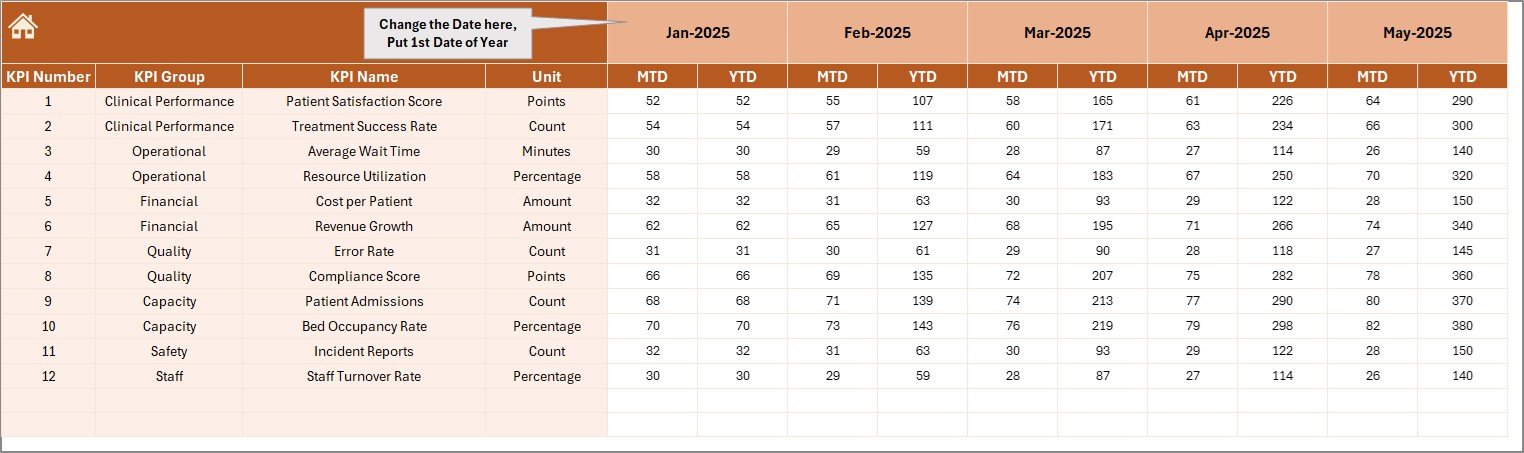
4. Actual Numbers Input Sheet
This sheet is dedicated for entering actual YTD and MTD values for selected months. Users configure the first month of the year in cell E1 to align monthly data input.
5. Target Number Input Sheet
In this worksheet tab, target numbers for each KPI are inputted monthly as MTD and YTD targets to benchmark performance effectively.

Target Number Input sheet
6. Previous Year Number Input Sheet
This sheet stores the prior year’s KPI values similar to current year inputs, facilitating year-over-year comparisons on the dashboard.

7. KPI Definition Sheet
This key reference sheet contains all KPI details including name, group, units, calculation formula, and whether the KPI is better when lower (LTB) or higher (UTB).
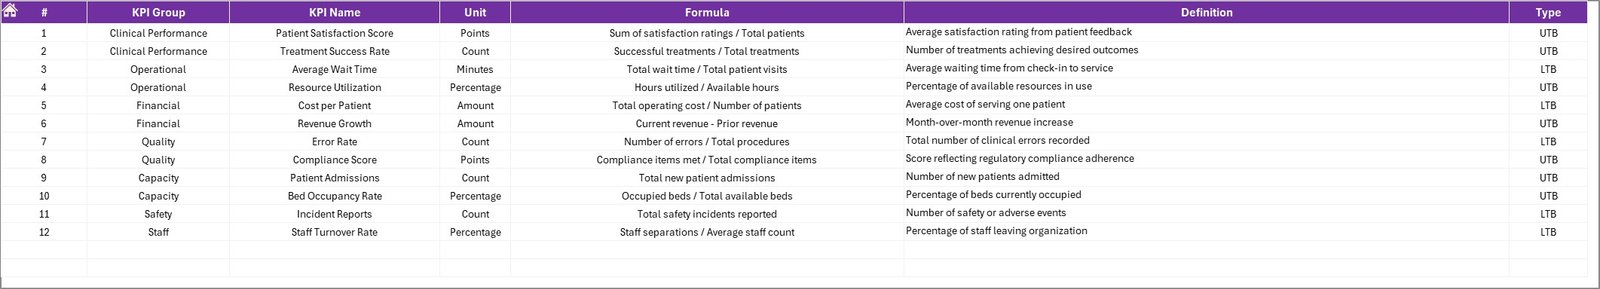
KPI Definition sheet
Advantages of Clinical Trials Management KPI Dashboard
- Centralized data monitoring: Consolidates all KPIs in one accessible interface.
- Improved decision-making: Visual trends and comparisons help stakeholders analyze performance effectively.
- Customizable timeframes: Easy selection of months and KPIs to focus analysis on relevant periods.
- Performance insights: Conditional formatting highlights areas needing attention or improvement.
- User-friendly interface: Navigation buttons and clear layout reduce complexity for end-users.
- Historical benchmarking: Previous year data supports trend analysis and goal setting.
Opportunities for Improvement
Click to Buy Clinical Trials Management KPI Dashboard in Excel
- Integrate automated data import from clinical trial management systems to reduce manual entry.
- Add real-time collaboration features for multi-user input and review.
- Enhance visualizations with more interactive charts and drill-down capabilities.
- Include alert systems for KPIs that fall below threshold targets.
Best Practices
- Regularly update actual, target, and previous year data to maintain dashboard accuracy.
- Use the KPI definition sheet to train team members on what each KPI indicates.
- Leverage trend charts to proactively address potential performance issues.
- Customize the dashboard monthly view to focus on periods aligned with clinical trial milestones.
FAQs
Click to Buy Clinical Trials Management KPI Dashboard in Excel
Q1: Can this KPI dashboard be used for other types of clinical studies?
Yes, this dashboard is customizable and can be adapted to different clinical research contexts by updating KPIs and data inputs accordingly.
Q2: Is prior Excel or dashboard experience required to use this template?
The dashboard is designed to be user-friendly with intuitive navigation, but familiarity with Excel basics will enhance user experience.
Q3: How can I update the KPI definitions?
Simply go to the KPI Definition sheet and modify the columns for KPI Name, formula, units, and performance type as needed.
Conclusion
The Clinical Trials Management KPI Dashboard is an effective and versatile tool that empowers clinical research teams with insightful performance tracking and management. Its well-structured worksheets and dynamic features make it easier to monitor KPIs, analyze trends, and drive improvements across trials. By implementing best practices and exploring further enhancements, this dashboard can significantly support successful clinical trial outcomes.
For more insights and live demonstrations, visit our YouTube channel: NextGenTemplates
For detailed guidance on Excel dashboard creation, explore Microsoft’s official resources: Microsoft Excel Support
Click to Buy Clinical Trials Management KPI Dashboard in Excel