In today’s rapidly advancing healthcare industry, stem cell banks play a critical role in preserving life-saving biological samples. Every day, these organizations handle complex operations such as sample collection, storage, processing, and compliance tracking. However, when this data remains scattered across spreadsheets, it becomes difficult to monitor performance and make timely decisions.
So, how can stem cell banks track KPIs, improve efficiency, and ensure compliance—all in one place?
Stem Cell Banks KPI Dashboard in Power BI.
This powerful, ready-to-use dashboard helps healthcare professionals, lab managers, and analysts monitor key performance indicators (KPIs) in real time. Moreover, it transforms raw data into clear, interactive visuals that support faster and smarter decision-making.
In this comprehensive guide, you will learn everything about this dashboard, including its features, structure, advantages, best practices, and frequently asked questions.
📊 What is a Stem Cell Banks KPI Dashboard in Power BI?
A Stem Cell Banks KPI Dashboard in Power BI is an advanced reporting and analytics tool designed to track, measure, and analyze performance metrics related to stem cell banking operations.
Instead of managing multiple reports, this dashboard allows you to:
- 📈 Monitor KPI performance in real time
- 🎯 Compare actual vs target values
- 📊 Analyze monthly and yearly trends
- 🔍 Evaluate operational efficiency
- ⚖️ Ensure regulatory compliance
As a result, organizations gain better visibility into their operations and can improve overall performance.
❓ Why Do Stem Cell Banks Need a KPI Dashboard?
Click to Buy Stem Cell Banks KPI Dashboard in Power BI
Stem cell banks deal with sensitive and critical data. Therefore, accurate tracking becomes essential.
Here’s why this dashboard is important:
- ✔️ It centralizes all KPI data in one place
- ✔️ It improves decision-making speed and accuracy
- ✔️ It reduces manual errors in reporting
- ✔️ It enhances transparency and accountability
- ✔️ It supports compliance with healthcare standards
In short, this dashboard helps you stay in control of your operations at all times.
🧩 Key Features of Stem Cell Banks KPI Dashboard in Power BI
This dashboard includes 3 well-structured pages, each designed to provide deep insights into performance metrics.
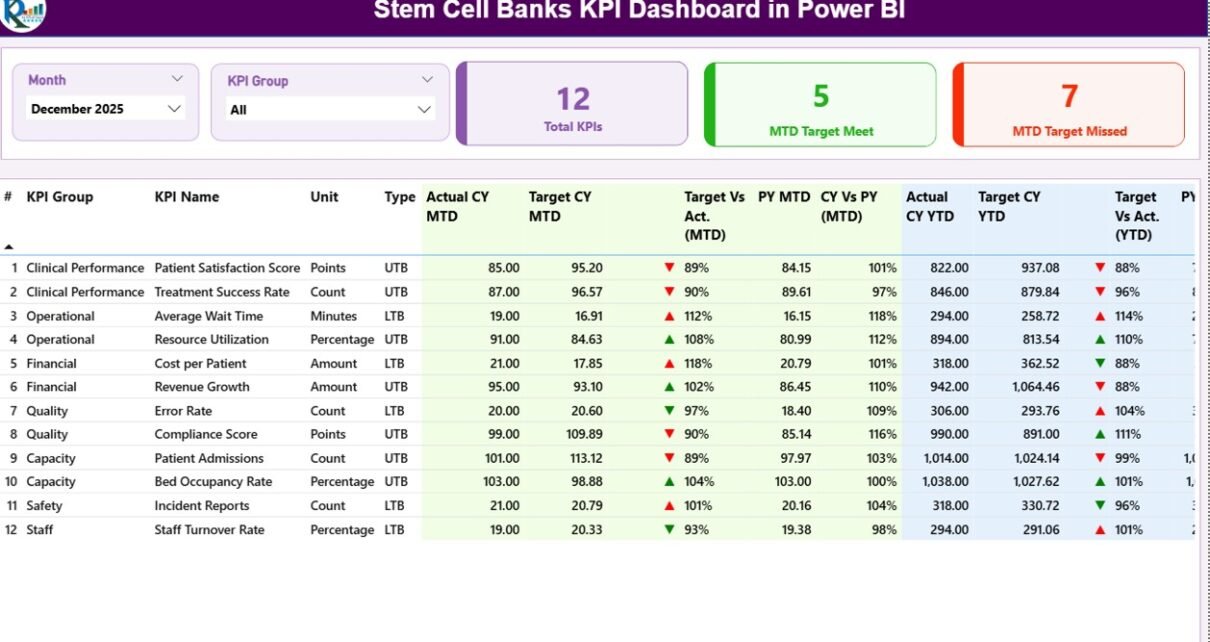
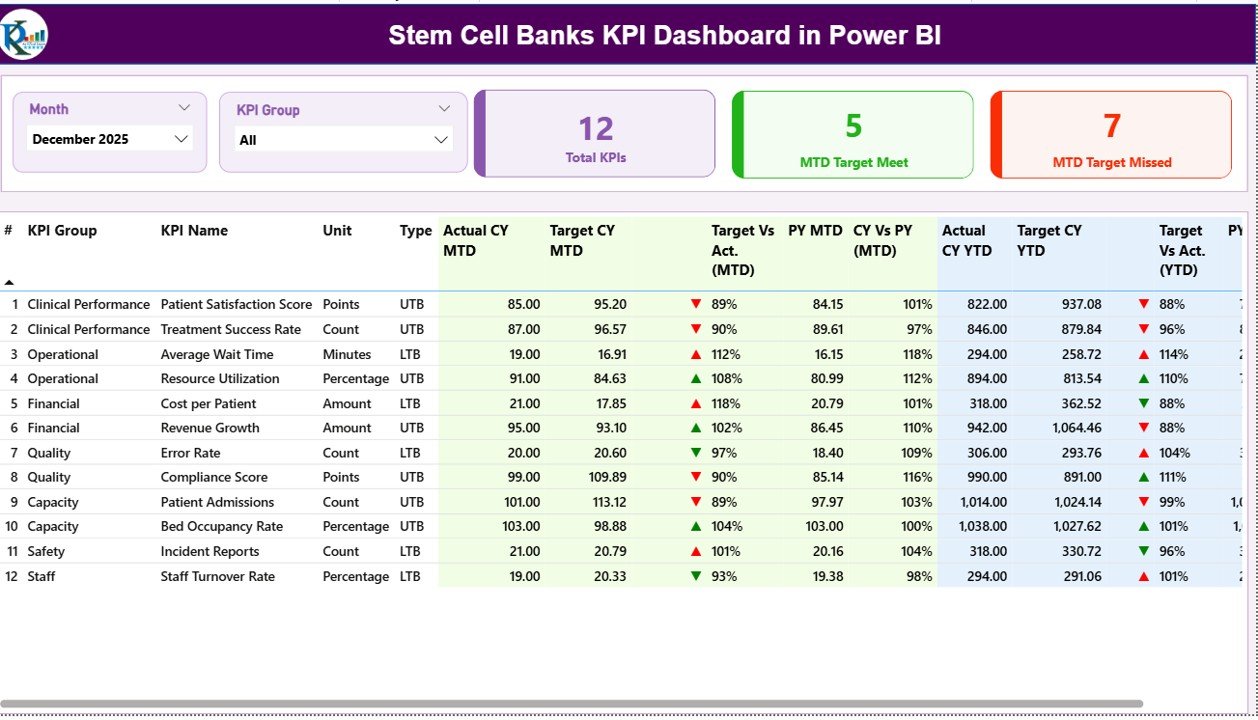
🏠 1. Summary Page – Get a Complete KPI Overview
Click to Buy Stem Cell Banks KPI Dashboard in Power BI
The Summary Page acts as the main control panel of the dashboard. It provides a quick snapshot of KPI performance.
🔑 Key Highlights:
- 🎛️ Slicers (Filters):
- Month slicer
- KPI Group slicer
- 📊 3 KPI Cards:
- Total KPIs Count
- MTD Target Meet Count
- MTD Target Missed Count
- 📋 Detailed KPI Table Includes:
- 🔢 KPI Number
- 📂 KPI Group
- 🏷️ KPI Name
- 📏 Unit
- 🔄 Type (LTB – Lower the Better / UTB – Upper the Better)
- 📈 Actual CY MTD
- 🎯 Target CY MTD
- 🔺🔻 MTD Icon (Performance Indicator)
- 📊 Target vs Actual (MTD %)
- 📅 Previous Year MTD (PY MTD)
- 🔍 CY vs PY (MTD %)
- 📈 Actual CY YTD
- 🎯 Target CY YTD
- 🔺🔻 YTD Icon (Performance Indicator)
- 📊 Target vs Actual (YTD %)
- 📅 Previous Year YTD (PY YTD)
- 🔍 CY vs PY (YTD %)
Click to Buy Stem Cell Banks KPI Dashboard in Power BI
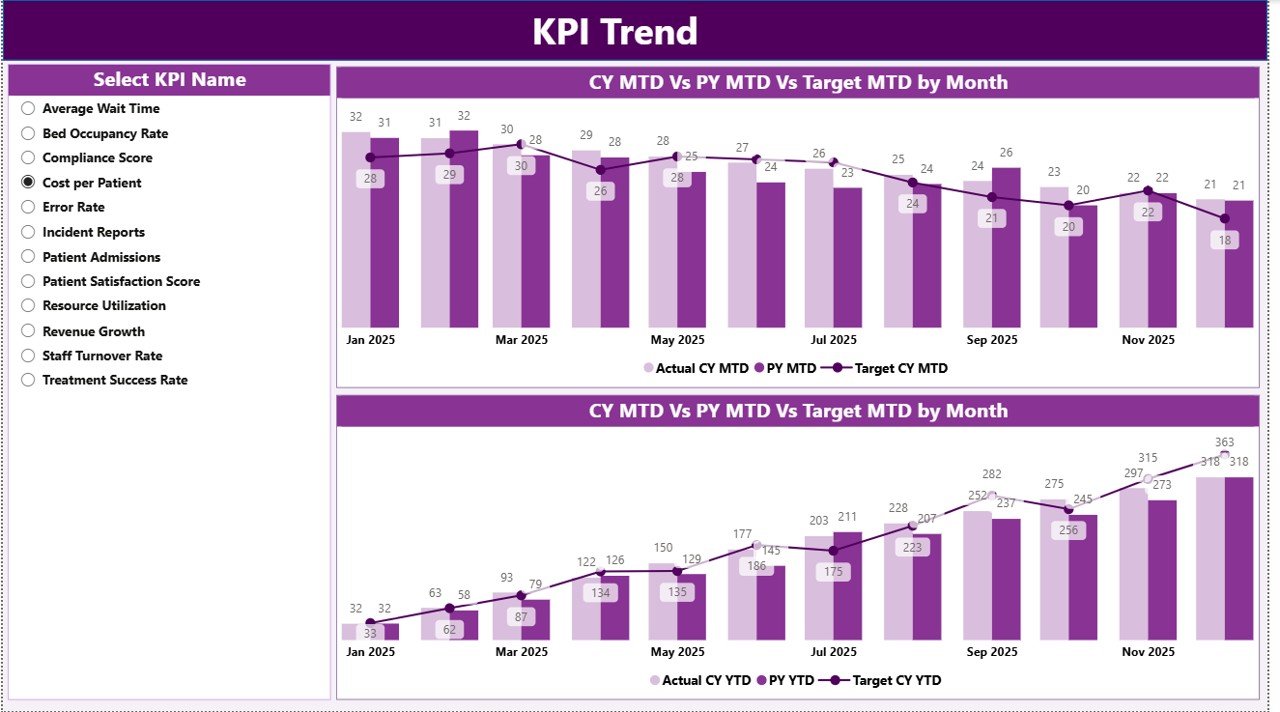
2. KPI Trend Page – Analyze Performance Over Time
The KPI Trend Page helps you track KPI performance trends effectively.
Key Features:
- 📉 2 Combo Charts:
- Actual vs Target vs Previous Year (MTD)
- Actual vs Target vs Previous Year (YTD)
- 🎛️ KPI Name Slicer:
- Select specific KPIs to analyze trends
Insights You Can Gain:
- Track performance growth or decline
- Compare current year vs previous year
- Identify patterns and trends
Click to Buy Stem Cell Banks KPI Dashboard in Power BI
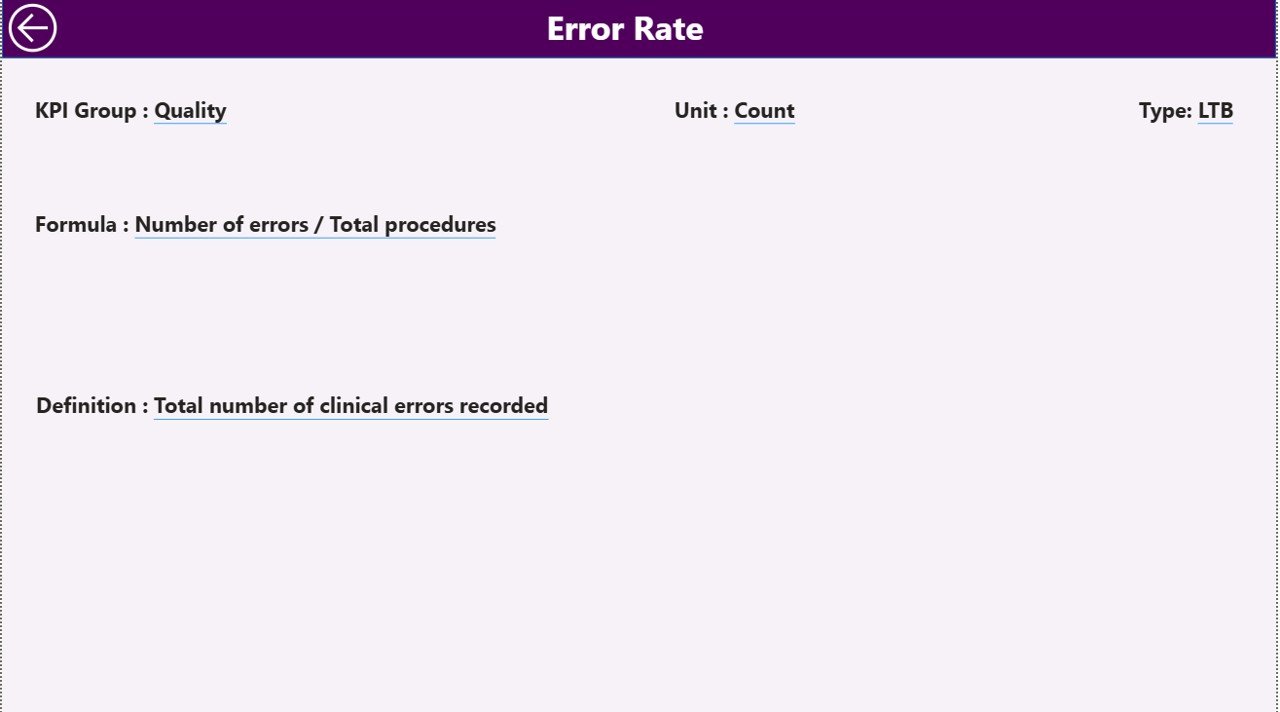
3. KPI Definition Page – Understand KPI Logic
The KPI Definition Page is a drill-through page that provides detailed KPI information.
Includes:
- KPI Number
- KPI Group
- KPI Name
- Unit
- Formula
- Definition
- Type (LTB or UTB)
Click to Buy Stem Cell Banks KPI Dashboard in Power BI
Excel Data Source Structure
This dashboard uses an Excel file as its data source. Therefore, you can easily manage and update data.
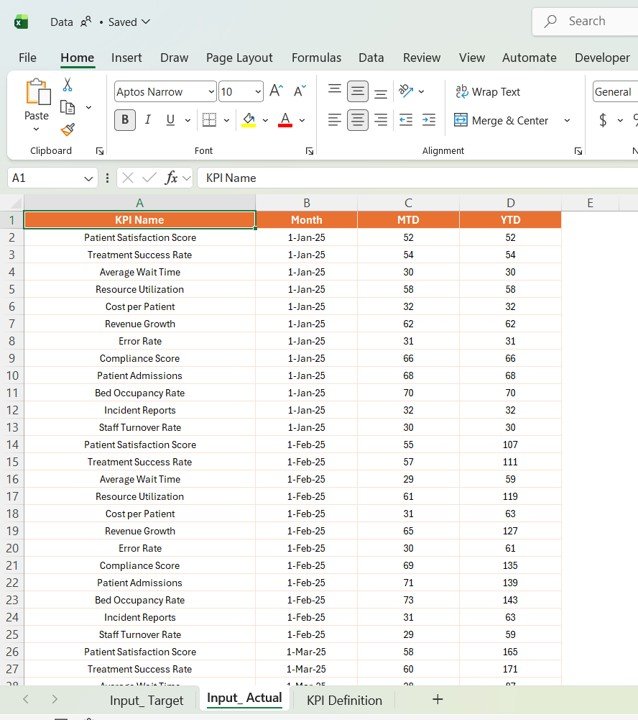
1. Input_Actual Sheet
- Enter KPI Name
- Add Month (First date of month)
- Fill MTD values
- Fill YTD values
Click to Buy Stem Cell Banks KPI Dashboard in Power BI
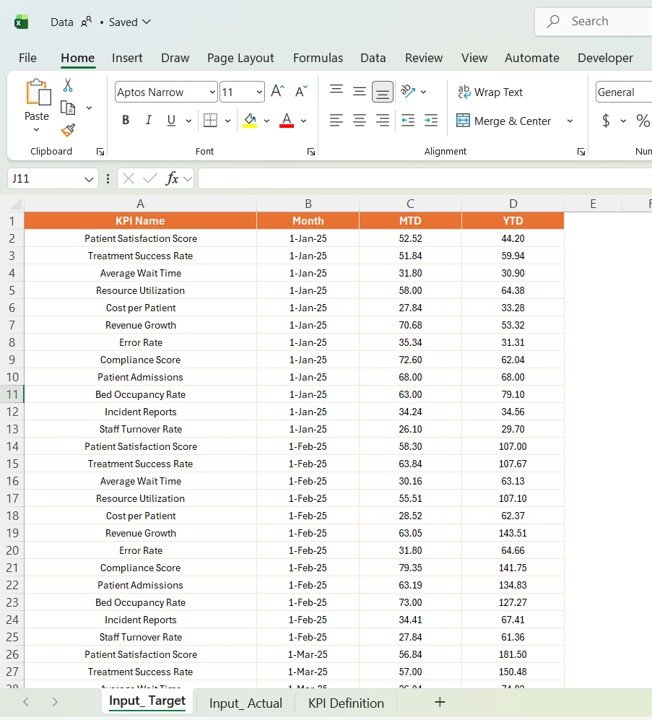
2. Input_Target Sheet
- Enter KPI Name
- Add Month
- Fill Target MTD values
- Fill Target YTD values
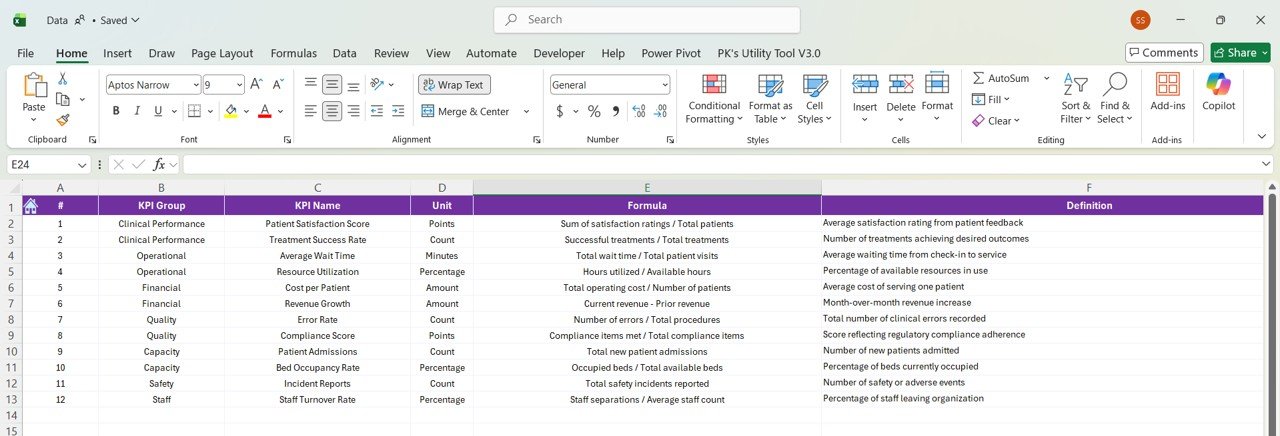
3. KPI Definition Sheet
- KPI Number
- KPI Group
- KPI Name
- Unit
- Formula
- Definition
- Type (LTB/UTB)
Click to Buy Stem Cell Banks KPI Dashboard in Power BI
Advantages of Stem Cell Banks KPI Dashboard in Power BI
Using this dashboard offers several benefits:
1. Real-Time Monitoring
You can track KPIs instantly. Therefore, you stay updated with performance.
2. Improved Decision-Making
Since you get clear insights, you can make faster decisions.
3. Better Compliance Management
You can monitor KPIs related to regulatory requirements.
4. Enhanced Data Accuracy
The dashboard reduces manual errors.
5. Time-Saving Automation
It automates reporting and analysis.
6. Easy Data Visualization
Charts and visuals make data easy to understand.
Opportunities for Improvement
Click to Buy Stem Cell Banks KPI Dashboard in Power BI
You can enhance this dashboard further:
- Add AI-based predictive analytics
- Include automated alerts for KPI deviations
- Make it mobile-friendly
- Integrate with hospital management systems
- Add advanced data security features
Best Practices for the Stem Cell Banks KPI Dashboard in Power BI
Click to Buy Stem Cell Banks KPI Dashboard in Power BI
To maximize effectiveness, follow these best practices:
1. Keep Data Updated Regularly
Always refresh data to maintain accuracy.
2. Define KPIs Clearly
Ensure each KPI has a clear definition and formula.
3. Use Clean Data Sources
Avoid duplicate or inconsistent data.
4. Focus on Relevant KPIs
Track only the most important metrics.
5. Use Visuals Wisely
Keep charts simple and easy to read.
6. Monitor Trends Continuously
Analyze trends regularly for better planning.
Who Can Benefit from This Dashboard?
Click to Buy Stem Cell Banks KPI Dashboard in Power BI
This dashboard is ideal for:
- Stem Cell Bank Managers
- Laboratory Analysts
- Healthcare Data Analysts
- Hospital Administrators
- Compliance Teams
How Does This Dashboard Improve Healthcare Operations?
This dashboard improves operations in multiple ways:
- Enhances efficiency
- Improves patient service quality
- Supports compliance tracking
- Reduces operational risks
- Enables data-driven decisions
Conclusion
Click to Buy Stem Cell Banks KPI Dashboard in Power BI
The Stem Cell Banks KPI Dashboard in Power BI is a powerful tool that simplifies complex healthcare data and transforms it into actionable insights. It helps organizations monitor performance, improve efficiency, and ensure compliance.
Moreover, with its interactive pages, detailed KPI tracking, and user-friendly design, it enables better decision-making and operational excellence.
If you want to take your stem cell bank operations to the next level, this dashboard is the perfect solution.
Visit our YouTube channel to learn step-by-step video tutorials
Click to Buy Stem Cell Banks KPI Dashboard in Power BI


