Introduction
The Vocational Schools KPI Dashboard is a powerful tool designed to help educational institutions monitor and improve their key performance indicators (KPIs) effectively. This ready-to-use template consolidates all critical KPI data into an interactive and easy-to-navigate format, allowing administrators and stakeholders to track progress, analyze trends, and make data-driven decisions.
Key Features of Vocational Schools KPI Dashboard
- Seven comprehensive worksheets covering all aspects of KPI monitoring and data input.
- User-friendly navigation with dedicated buttons on the home sheet for quick access.
- Dynamic dashboard with monthly selections that update actual, target, and historical data.
- Visual conditional formatting to highlight performance trends with up/down arrows for quick insight.
- Trend analysis charts for MTD (Month-To-Date) and YTD (Year-To-Date) values comparing actual against targets and previous year.
- Dedicated sheets for inputting actual numbers, target values, and previous year data for accurate tracking.
- KPI definitions with formulas, types, and detailed descriptions for clear understanding.
Dashboard Pages Explanation
1. Home Sheet
This serves as the index page with six navigational buttons. Users can jump directly to respective dashboard sheets, making navigation intuitive and seamless.
 Home Page
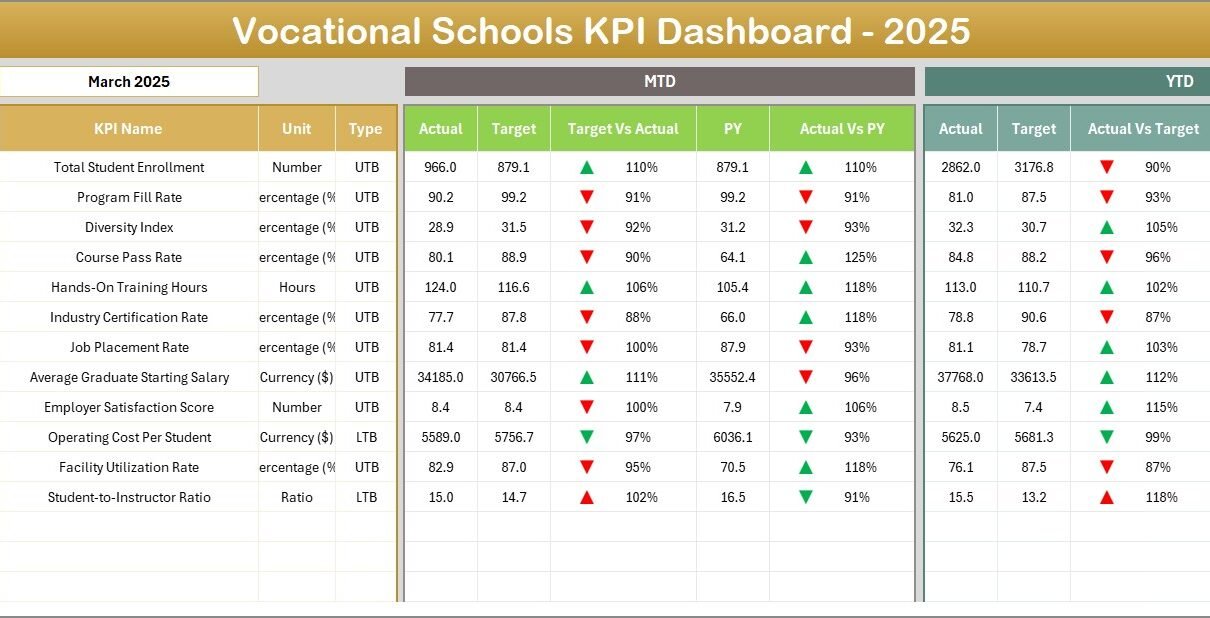
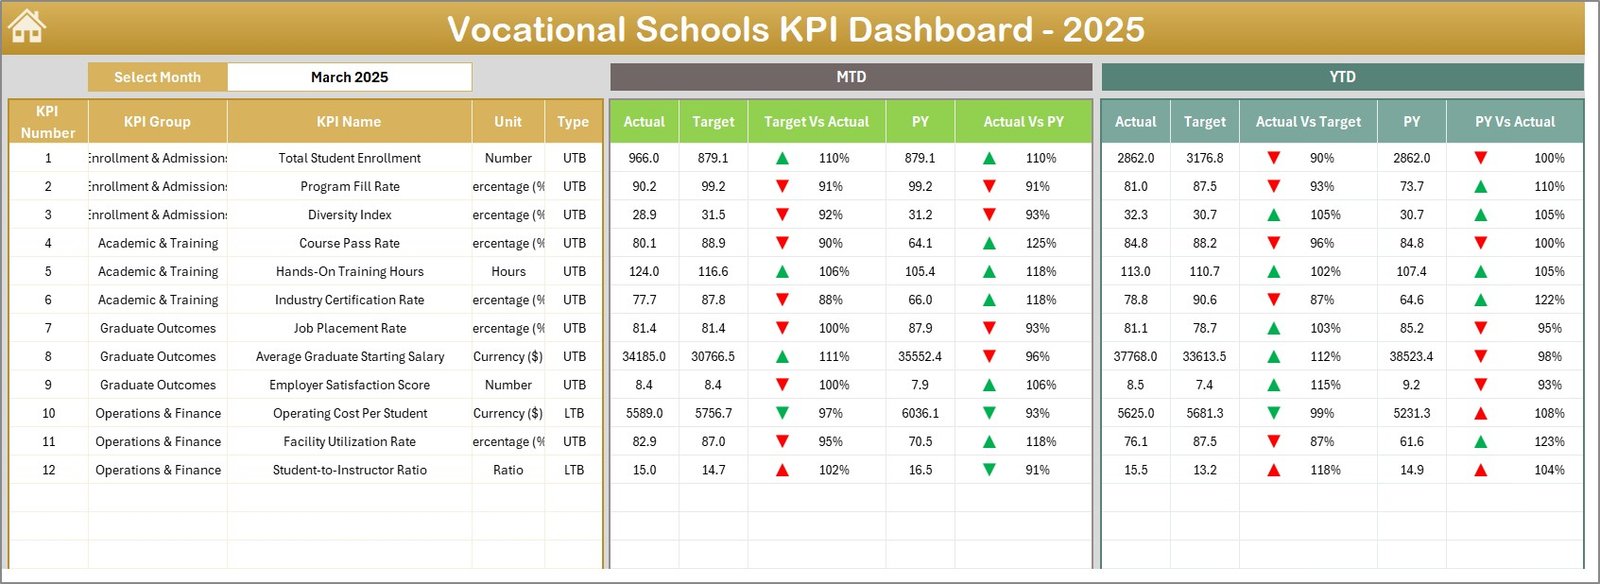
2. Dashboard Sheet
The core of the KPI tracking system. Here you can select the month from the drop-down in cell D3, updating all dashboard figures accordingly. Key metrics displayed include:
- MTD Actual, Target, and Previous Year numbers.
- Target vs Actual and Previous Year vs Actual comparisons with conditional formatting using up and down arrows.
- YTD Actual, Target, and Previous Year details along with comparisons and conditional formatting.
 Vocational Schools KPI Dashboard
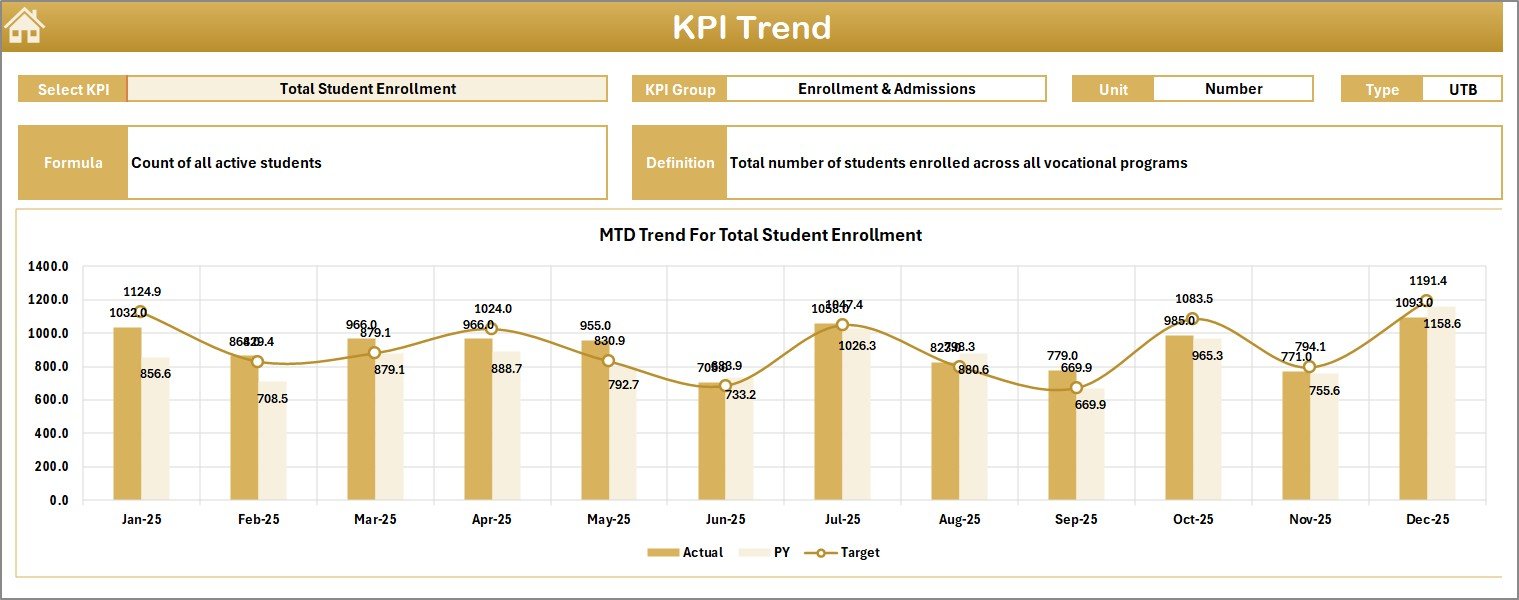
3. KPI Trend Sheet
This sheet lets you select a KPI name from the drop-down at cell C3 to reveal detailed information and trends:
- KPI Group, Unit, KPI Type (Lower the Better or Upper the Better), Formula, and Definition.
- MTD and YTD trend charts illustrating actual, target, and previous year data visually.
 KPI Trend Sheet
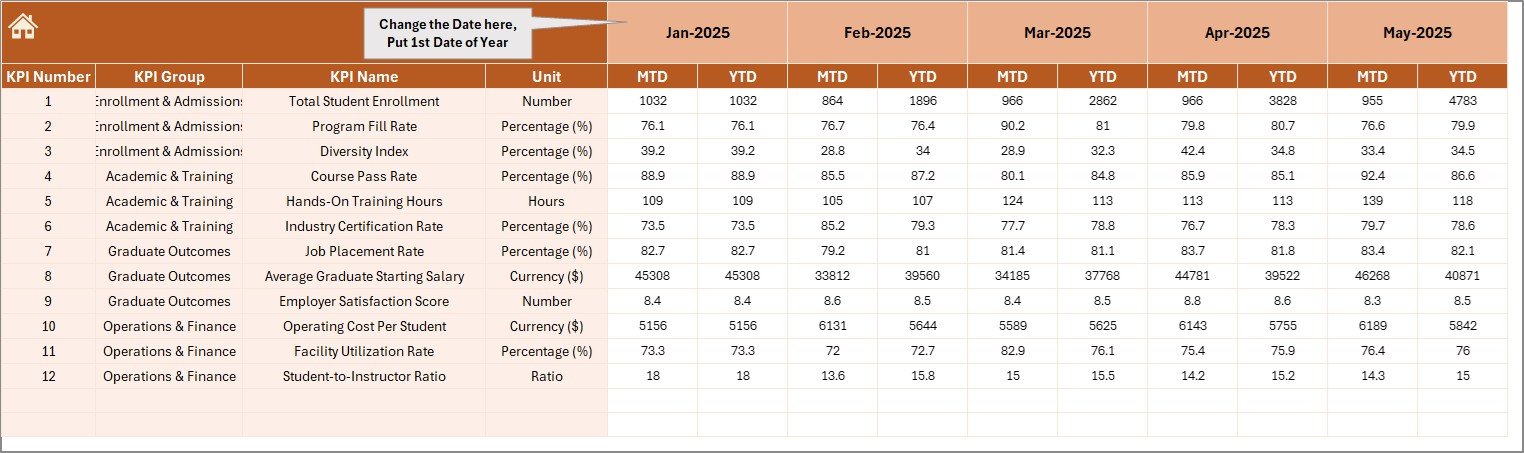
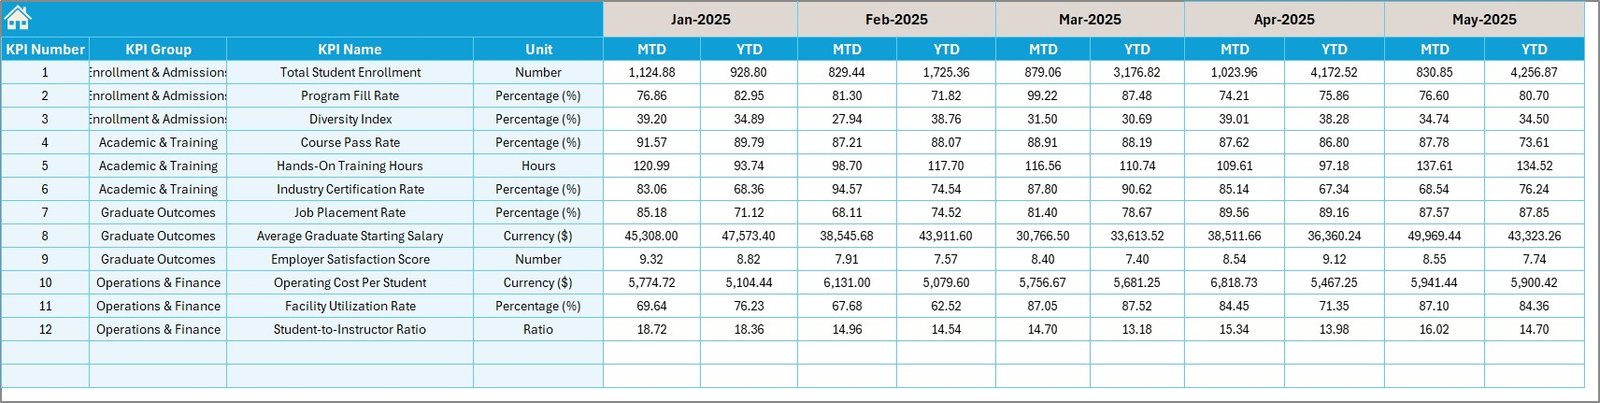
4. Actual Numbers Input Sheet
Here, input the actual performance figures for MTD and YTD for the selected month. You can change the first month of the year by updating the value in cell E1, which dynamically adjusts the data input period.
 Actual Numbers Input sheet
5. Target Number Input Sheet
Use this sheet to enter the monthly target values (both MTD and YTD) for each KPI. Consistent input ensures accurate benchmarking and performance tracking.
 Target Number Input sheet
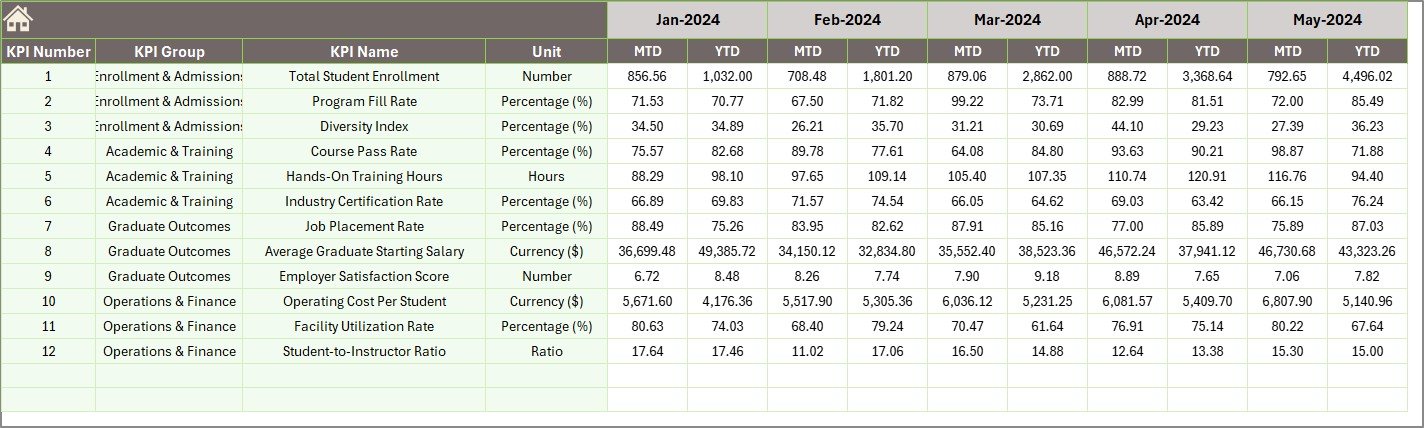
6. Previous Year Number Sheet
This sheet is for inputting the previous year’s corresponding KPI data, allowing year-over-year performance comparisons.
 Previous Year Number Input sheet
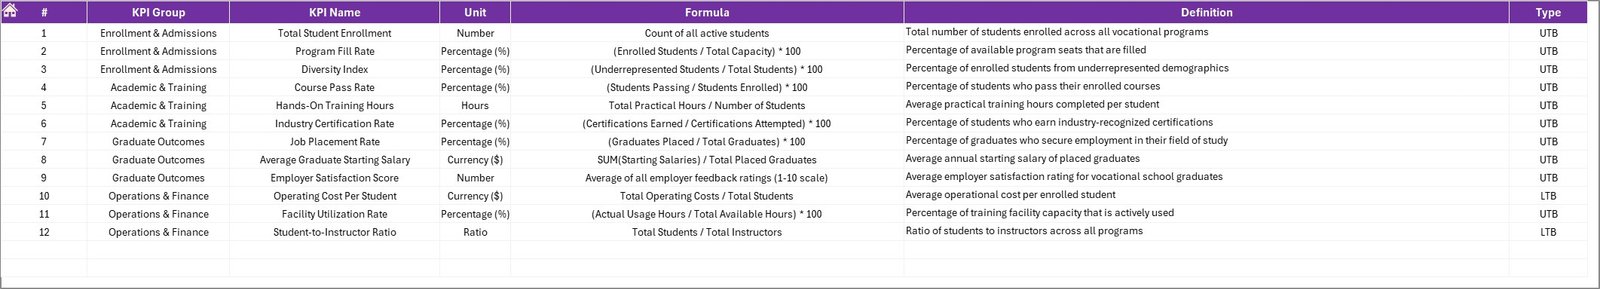
7. KPI Definition Sheet
Maintain detailed definitions for each KPI on this sheet, including:
- KPI Name and Group
- Unit of measurement
- Formula for calculation
- Definition
- KPI Type – whether Lower The Better (LTB) or Upper The Better (UTB)
 KPI Definition sheet
Advantages of Vocational Schools KPI Dashboard
- Centralized Monitoring: All KPI data is consolidated in a clear, accessible dashboard.
- Time-saving: Ready-made templates reduce the time needed to set up monitoring systems.
- Data Accuracy: Dedicated input sheets minimize errors and ensure consistency.
- Interactive Insights: Conditional formatting and trend charts make interpreting data straightforward.
- Customizable: The dashboard adapts to multiple KPIs and periods for flexible use.
Opportunities for Improvement
Click to Buy Vocational Schools KPI Dashboard in Excel
- Integrating automated data imports from institution databases to reduce manual input.
- Adding predictive analytics to forecast KPI trends and outcomes.
- Enhancing mobile responsiveness for on-the-go KPI monitoring.
- Including notifications and alerts for KPI deviations or milestones.
Best Practices
Click to Buy Vocational Schools KPI Dashboard in Excel
- Regularly update actual, target, and previous year data for real-time accuracy.
- Ensure KPI definitions are clear and accessible to all stakeholders.
- Use monthly comparisons to identify patterns and areas for improvement.
- Train users on interpreting dashboard visuals and conditional formatting cues.
- Backup input data periodically to avoid loss.
FAQs
Click to Buy Vocational Schools KPI Dashboard in Excel
What KPIs are included in the Vocational Schools KPI Dashboard?
The dashboard supports customizable KPIs related to vocational education performance, including enrollment, graduation rates, skill assessments, and financial metrics.
Can I add more KPIs to this dashboard?
Yes, the KPI definition and input sheets allow you to add additional KPIs by entering appropriate data and definitions.
Is this dashboard compatible with Excel versions?
It is compatible with Excel versions supporting drop-down lists, conditional formatting, and charting features.
How do I change the reporting month?
You can change the reporting month on the Dashboard sheet by selecting from the drop-down at cell D3. This updates all associated metrics dynamically.
Conclusion
Click to Buy Vocational Schools KPI Dashboard in Excel
The Vocational Schools KPI Dashboard is an essential asset for vocational education institutions aiming to track their performance efficiently and effectively. Its comprehensive features, interactive design, and user-friendly input mechanisms support data-driven decision-making and continuous improvement. Leveraging this dashboard can help schools maintain focus on strategic goals and achieve better educational outcomes.
For more information on Excel dashboards and similar tools, visit the official Microsoft Excel Support page.
Visit our YouTube channel to watch the demo.
Click to Buy Vocational Schools KPI Dashboard in Excel
