Introduction
The Test Lab Certifications KPI Dashboard is a comprehensive and ready-to-use Excel template designed to help organizations track, analyze, and improve their key performance indicators related to test lab certifications. Harnessing the power of intuitive design and dynamic data filtering, this dashboard offers a seamless experience for monitoring monthly and yearly KPI performance, ensuring data-driven decisions for continuous improvement.
Key Features of Test Lab Certifications KPI Dashboard
- Seven fully interactive worksheets covering different aspects of KPI tracking and data input.
- Dynamic month selection that updates all dashboard metrics instantly.
- Visual indicators including conditional formatting with up/down arrows to easily compare actual vs target and previous year values.
- Detailed input sheets for Actual, Target, and Previous Year data ensuring flexible and accurate data management.
- KPI definitions and formulas embedded to provide clarity on metrics being tracked.
- Trend analysis charts for both Month-to-Date (MTD) and Year-to-Date (YTD) comparisons.
- Clean navigation via home page buttons navigating directly to respective sheets.
Dashboard Pages Explanation
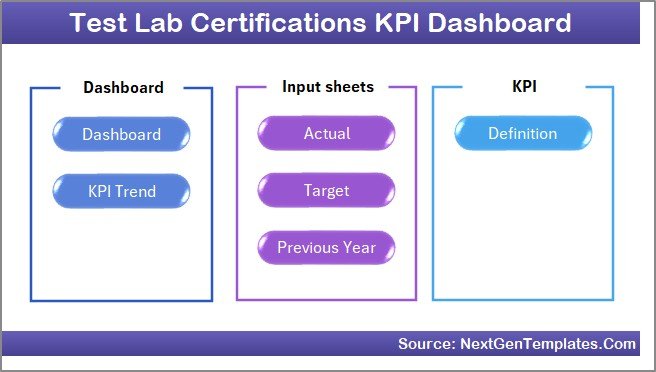
1. Home Sheet
This sheet acts as the index and primary navigation hub of the dashboard. It includes six buttons that act as shortcuts to the other dashboard sheets, allowing users to quickly move between sections.
 Caption: Home Page
Click to Buy Test Lab Certifications KPI Dashboard in Excel
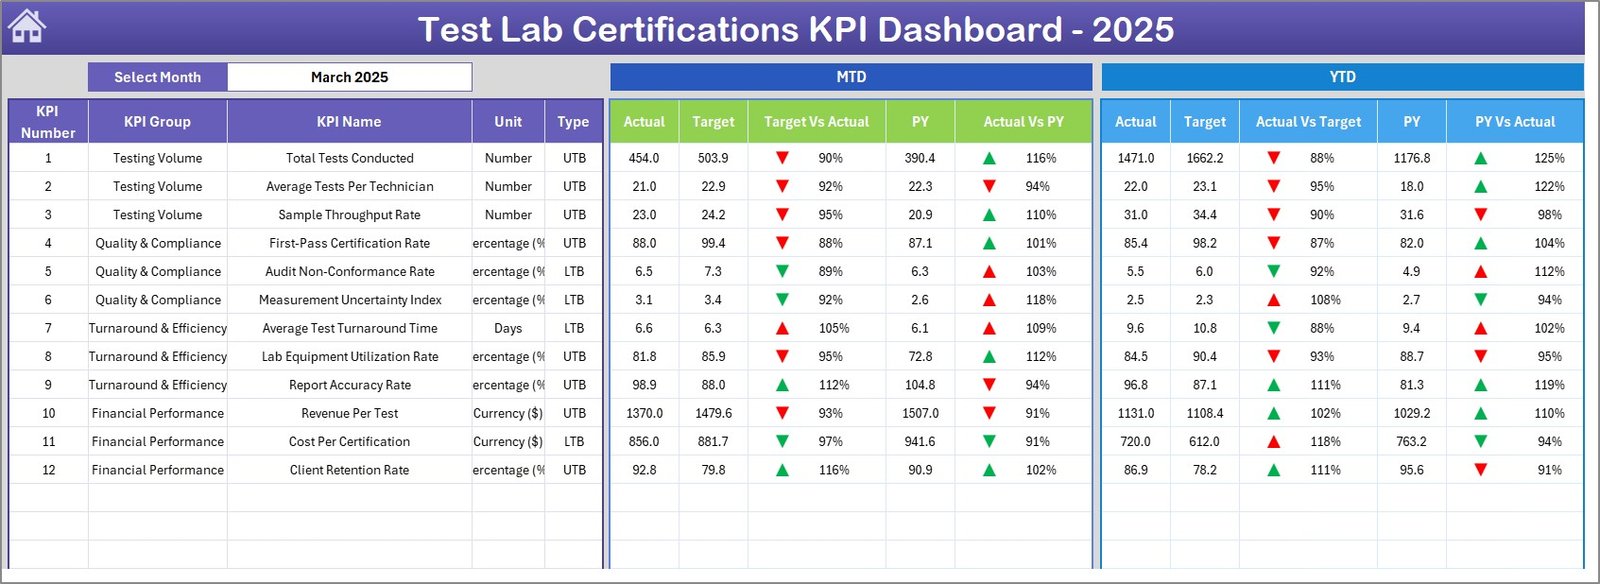
2. Dashboard Sheet
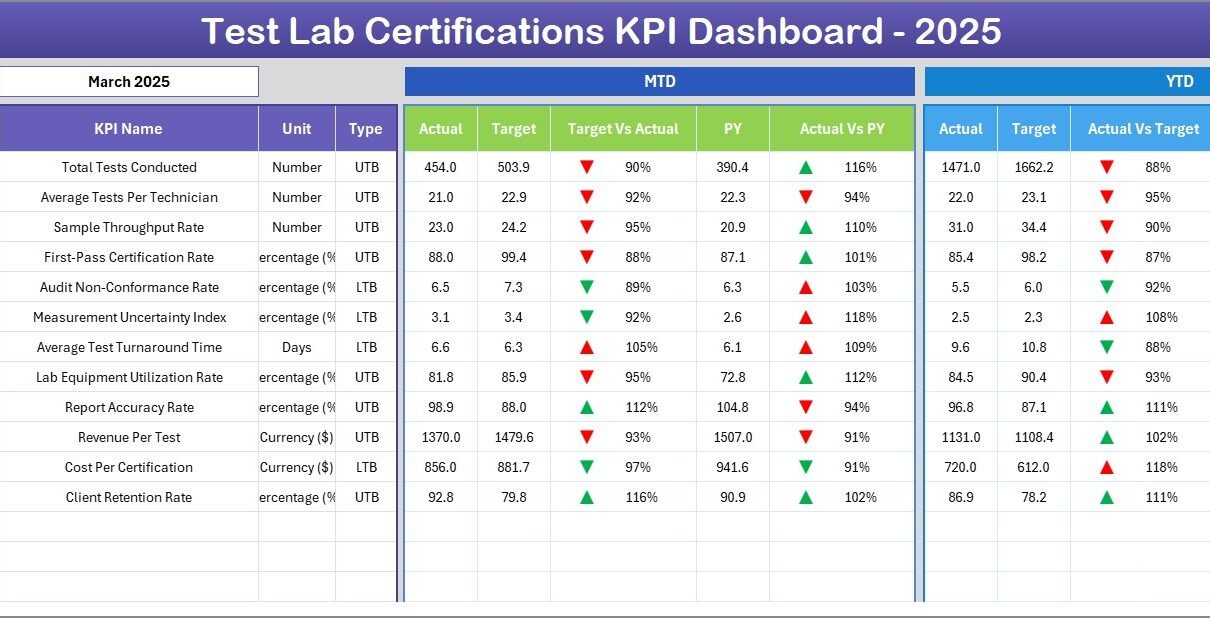
This is the core page where all KPI data is consolidated and visualized. Users can select a specific month (dropdown on cell D3) and instantly see updated figures across key metrics. It presents:
- Month-to-Date (MTD) Actual, Target, Previous Year data
- Comparative visual cues for Target vs Actual and Previous Year vs Actual using conditional formatting arrows
- Year-to-Date (YTD) Actual, Target, Previous Year data with similar comparisons and visual indicators
 Caption: Test Lab Certifications KPI Dashboard
Click to Buy Test Lab Certifications KPI Dashboard in Excel
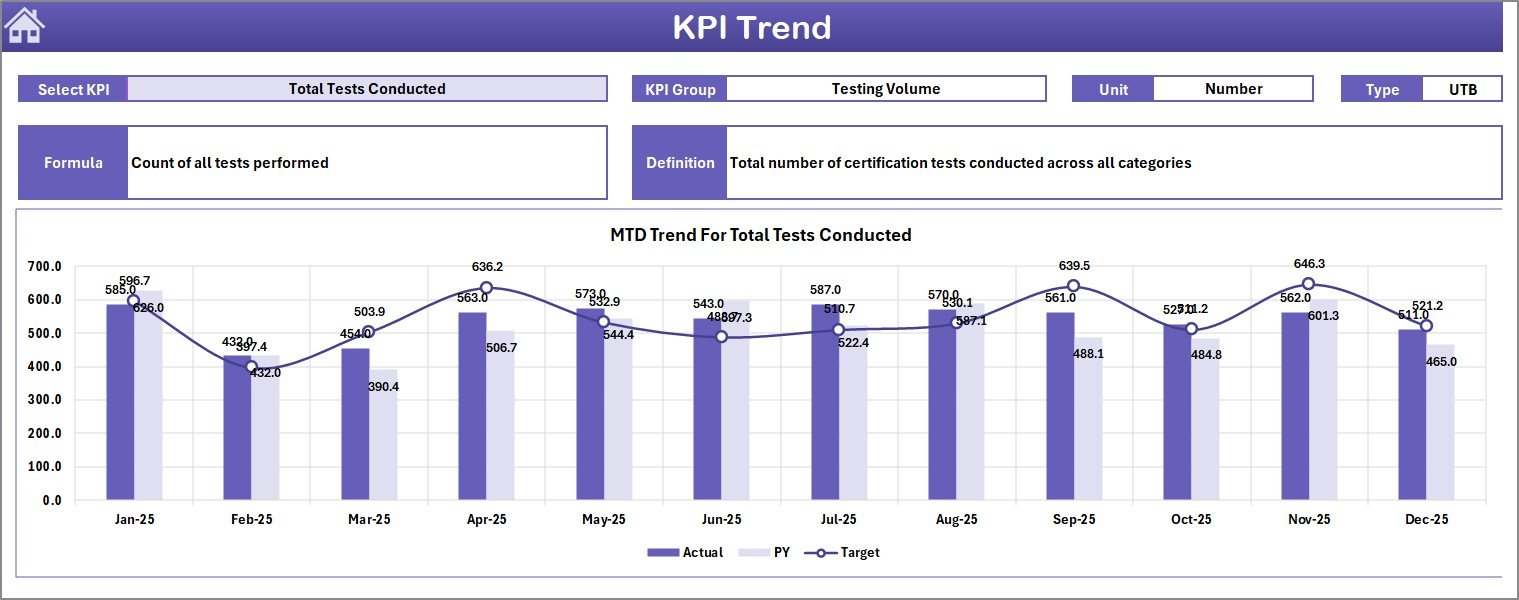
3. KPI Trend Sheet
This sheet is tailored for a deeper dive into the performance trends of individual KPIs. By selecting a KPI name from the dropdown (cell C3), users can see detailed KPI metadata, including group, units, type (Lower the Better or Upper the Better), formulas, and definitions. Additionally, MTD and YTD trend charts visualize Actual, Target, and Previous Year numbers to identify patterns over time.
 Caption: KPI Trend Sheet
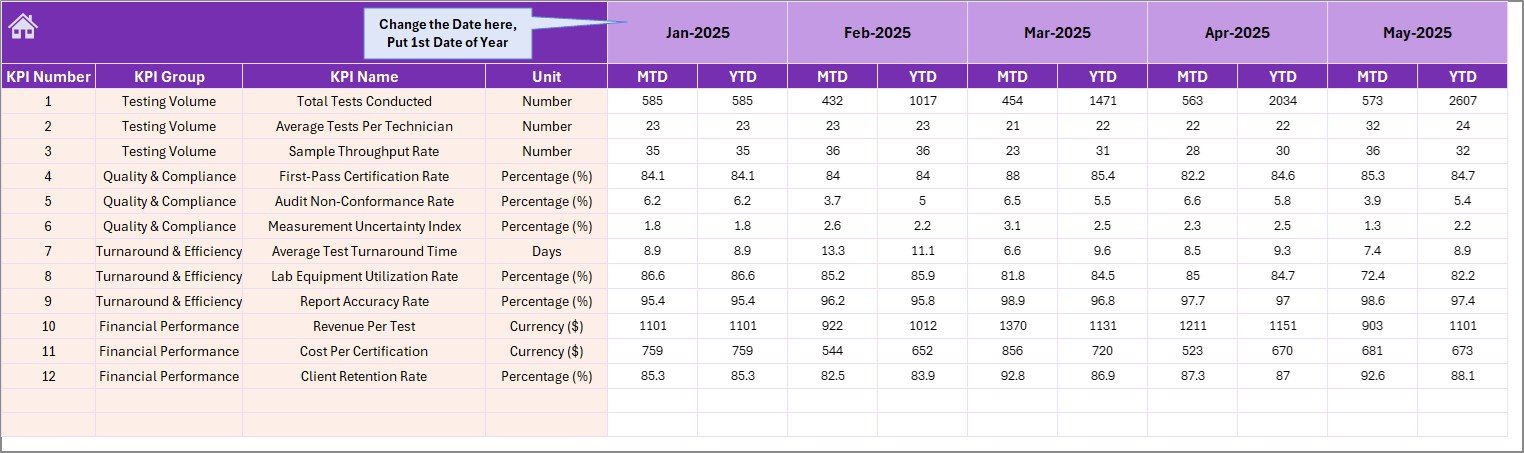
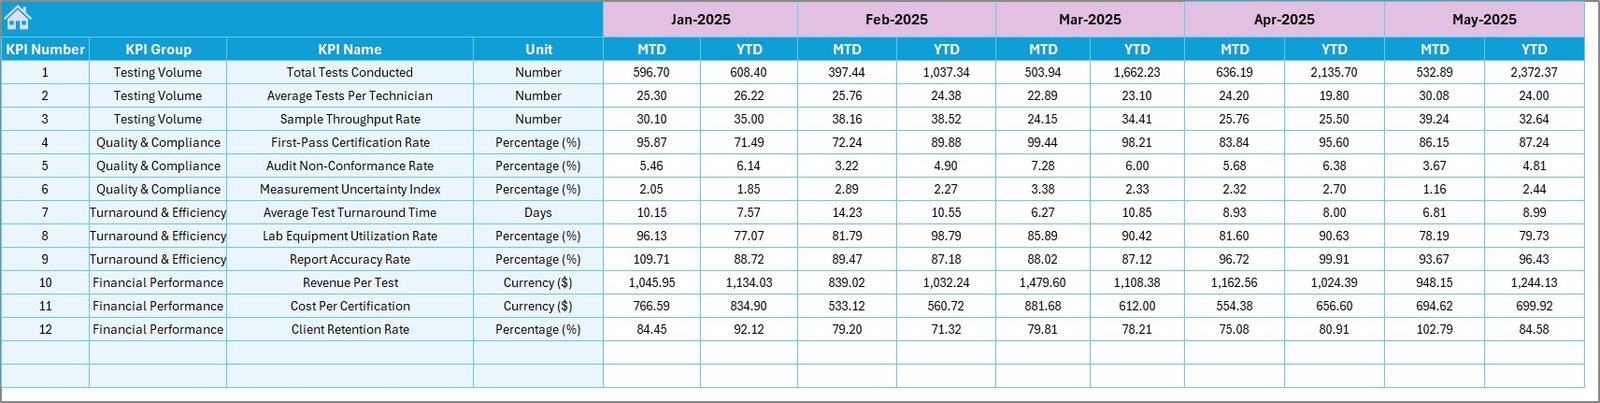
4. Actual Numbers Input Sheet
This input sheet is where users enter the actual performance numbers for KPIs on an MTD and YTD basis. The month can be adjusted dynamically by changing the first month of the year in cell E1.
 Caption: Actual Numbers Input sheet
Click to Buy Test Lab Certifications KPI Dashboard in Excel
5. Target Number Input Sheet
This tab is dedicated to inputting target numbers for each KPI for the month, both Month-to-Date (MTD) and Year-to-Date (YTD), allowing goal-setting aligned with organizational objectives.
 Caption: Target Number Input sheet
Click to Buy Test Lab Certifications KPI Dashboard in Excel
6. Previous Year Number Input Sheet
For comparative analysis, this sheet allows entering KPI values from the previous year. Having this historic data helps pinpoint trends and variances against current year performance.
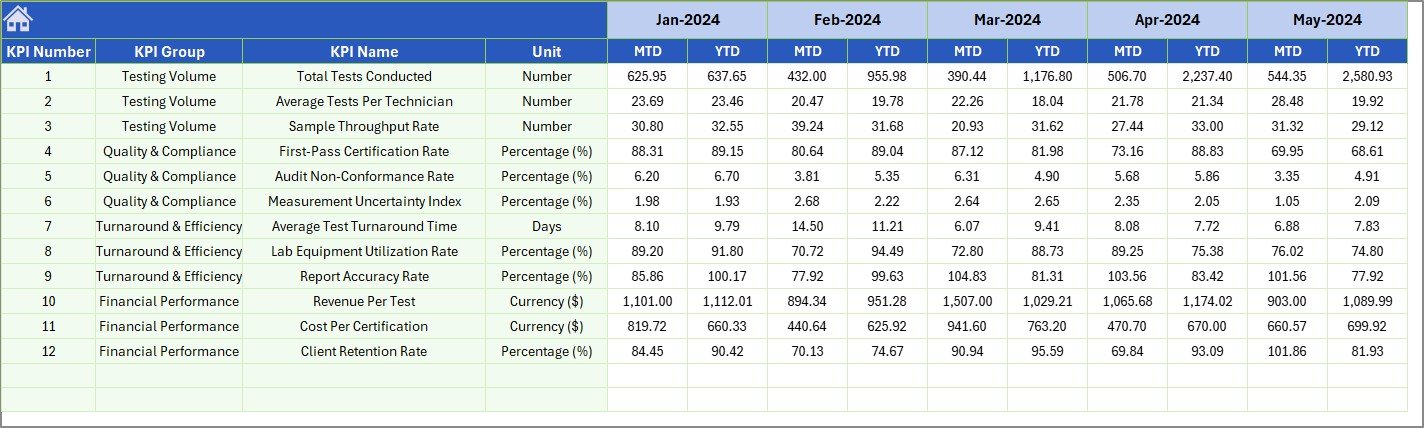 Caption: Previous Year Number Input sheet
Click to Buy Test Lab Certifications KPI Dashboard in Excel
7. KPI Definition Sheet
This sheet acts as the knowledge base for every KPI tracked in the dashboard. It contains columns for KPI Name, KPI Group, Unit, Formula, and a detailed KPI definition. The last column specifies the KPI type as either LTB (Lower The Better) or UTB (Upper The Better), guiding users for accurate interpretation.
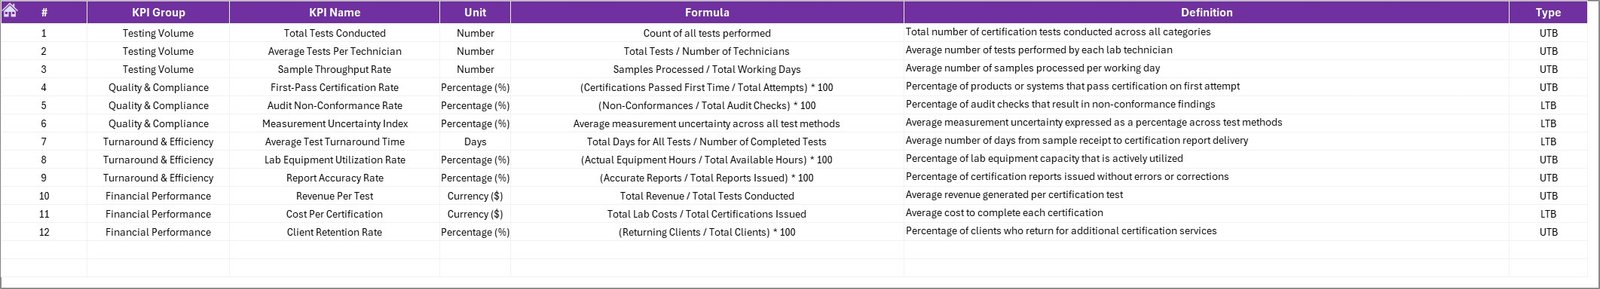 Caption: KPI Definition sheet
Click to Buy Test Lab Certifications KPI Dashboard in Excel
Advantages of Test Lab Certifications KPI Dashboard
- Customized Insights: Tailored KPI tracking specifically for test lab certifications guarantees relevant and actionable data.
- Time Efficiency: Automated calculations and dynamic filtering reduce manual work and save time.
- Data-Driven Decisions: Visual cues and trend analysis enhance decision-making with clear performance signals.
- User-Friendly Navigation: Home sheet buttons and logical tab structure improve usability.
- Comprehensive Historical Comparison: Inclusion of previous year data helps identify progress and areas needing attention.
Opportunities for Improvement
Click to Buy Test Lab Certifications KPI Dashboard in Excel
- Integrate automated data import capabilities from lab management systems to minimize manual inputs.
- Add predictive analytics or alerts for underperforming KPIs to facilitate proactive management.
- Include more interactive charts with drill-down capabilities for advanced user interaction.
- Enable collaborative features by linking the dashboard to cloud-based platforms for real-time updates across the team.
Best Practices
Click to Buy Test Lab Certifications KPI Dashboard in Excel
- Regular Data Updates: Ensure actual, target, and previous year data inputs are consistently refreshed for accurate reporting.
- Clear KPI Definitions: Maintain the KPI Definitions sheet accurately to avoid confusion among stakeholders.
- Monthly Review Meetings: Use the dashboard during periodic meetings to evaluate performance and set corrective actions.
- Train Users: Provide users with a clear understanding of navigating and interpreting the dashboard to maximize its benefits.
FAQs
Click to Buy Test Lab Certifications KPI Dashboard in Excel
Q: Can I customize the KPIs in the dashboard?
A: Yes, the KPI Definition sheet allows you to add, modify, or remove KPIs as per your organizational needs.
Q: How do I update the month for analysis?
A: On the Dashboard sheet, use the dropdown in cell D3 to select the desired month. All related data and charts will update accordingly.
Q: Is prior year data mandatory to fill?
A: While not mandatory, filling previous year data enhances trend analysis and comparative insights.
Q: Can this dashboard be used for other certifications or industries?
A: Absolutely. Though designed for test lab certifications, with minor adjustments in definitions and KPIs, it can fit other sectors as well.
Conclusion
Click to Buy Test Lab Certifications KPI Dashboard in Excel
The Test Lab Certifications KPI Dashboard is a powerful tool for organizations seeking an efficient, transparent, and user-friendly way to monitor their test lab performance metrics. The seamless integration of actual data, targets, past performance, and detailed KPI definitions empowers informed decision-making while encouraging continual improvement. Its modular design and dynamic features offer adaptability, making it a valuable asset for teams focused on quality and compliance.
For more information and detailed guides on Microsoft Excel dashboards, you can visit the official Microsoft Excel support page.
Visit our YouTube channel to watch the demo.
Click to Buy Test Lab Certifications KPI Dashboard in Excel