Sales and Revenue Command Center Dashboard in HTML – Build It with AI Using This Free Prompt Guide
Sales and Revenue Command Center Dashboard in HTML is one of the most popular premium dashboard templates on NextGenTemplates.com. In our latest YouTube tutorial, we demonstrated exactly how this dashboard was built using AI — and now we are making the complete AI prompt available as a free downloadable Word document. If you have ever wondered how to create a professional, multi-tab HTML sales dashboard using ChatGPT or Claude, this guide gives you the exact blueprint.Sales and Revenue Command Center DashboardSales and Revenue Command Center Dashboard
The free Sales and Revenue Command Center Dashboard AI Prompt Guide includes everything you need: the full structured prompt, color theme CSS variables, sample data schema with 50 records, tab-by-tab layout instructions for all 5 dashboard pages, and a troubleshooting section for common issues. This is not a generic tutorial — every detail in this guide is specific to the Sales and Revenue Command Center Dashboard.
Click to Sales and Revenue Command Center Dashboard – Free AI Prompt Guide
Key Features of the AI Prompt Guide
This free prompt guide is packed with detailed, sales-specific instructions that walk you through the entire dashboard creation process. The guide is structured as a professional Word document with NextGenTemplates branding and includes the following components.Sales and Revenue Command Center Dashboard
The complete prompt covers 5 major sections: Project Definition and Output Rules, Color Theme Specification, Sample Data Schema, Tab-by-Tab Layout Instructions, and UI/UX and Interactivity Rules. Together, these sections give the AI enough context to generate a fully functional single-file HTML dashboard with embedded CSS, JavaScript, Chart.js visualizations, and SheetJS-powered CSV export.
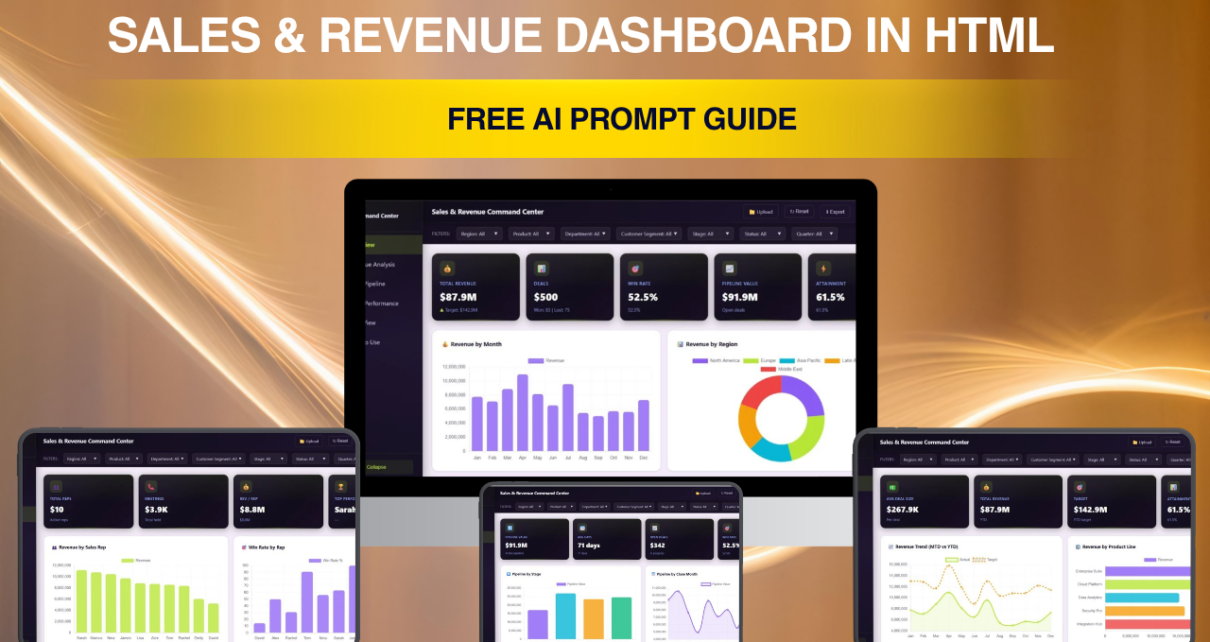
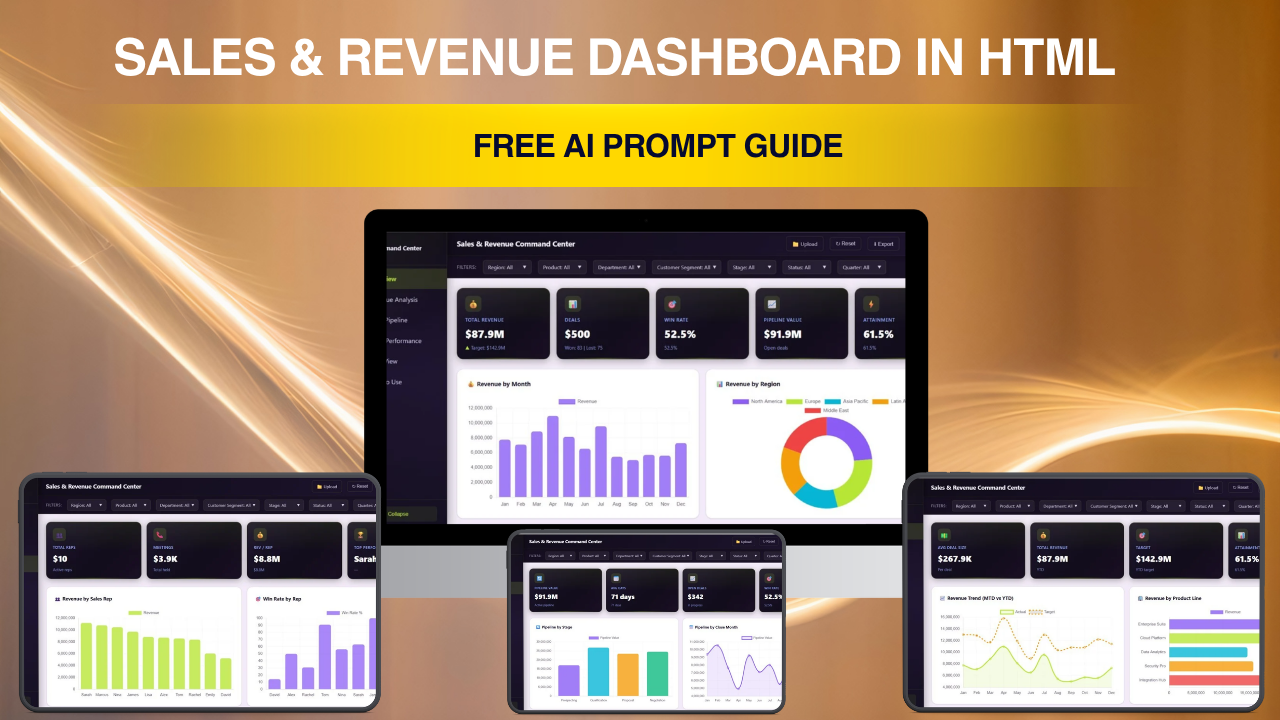
The prompt specifies exactly 5 interactive tabs — Overview, Revenue Analysis, Sales Pipeline, Team Performance, and Data View — each with defined KPI cards, chart types, and data relationships. The Overview page alone includes 5 KPI cards (Total Revenue, Total Deals, Win Rate, Pipeline Value, Attainment) and 4 charts (Revenue by Month, Revenue by Region, Target vs Actual by Department, Deal Status Distribution).Sales and Revenue Command Center Dashboard
Dashboard Pages Explained
Click to Sales and Revenue Command Center Dashboard – Free AI Prompt Guide
1. Overview Page
The Overview page serves as the executive command center. It displays 5 KPI cards at the top: Total Revenue formatted as currency, Total Deals as a count, Win Rate as a percentage, Pipeline Value summing all active deals, and Attainment comparing actual versus target revenue. Below the cards, 4 charts provide visual analysis: a bar chart showing Revenue by Month, a doughnut chart for Revenue by Region, a grouped bar chart comparing Target vs Actual by Department, and a horizontal bar chart showing Deal Status Distribution across pipeline stages. The prompt includes a global filter bar with dropdowns for Region, Department, Product Line, Quarter, and date range.
2. Revenue Analysis
The Revenue Analysis tab dives deeper into financial metrics with 4 charts: Revenue Trend (MTD vs YTD) as a dual-line chart, Revenue by Product Line as a bar chart across 5 product lines, Average Deal Size by Quarter showing Q1 through Q4 trends, and Revenue by Customer Segment as a pie chart covering Enterprise, Mid-Market, SMB, and Startup segments.Sales and Revenue Command Center Dashboard
3. Sales Pipeline
The Sales Pipeline tab visualizes active opportunities through 3 components: Pipeline by Stage as a horizontal bar chart from Prospecting through Negotiation, Pipeline by Close Month as a stacked bar chart, and a Top Deals by Value HTML table showing the 10 highest-value deals with colored stage badges and probability progress bars.Sales and Revenue Command Center Dashboard
4. Team Performance
The Team Performance tab provides rep-level analytics with Revenue by Sales Rep as a horizontal bar chart, Win Rate by Rep with color-coded performance indicators, and a Department Ranking table with attainment percentages and status badges (On Track, At Risk, Behind).
5. Data View
The Data View tab presents every record in a searchable, sortable data table with pagination and one-click CSV export using the SheetJS library. Columns include Deal ID, Deal Name, Company, Sales Rep, Department, Region, Product Line, Stage, Deal Value, Close Date, Probability, and Customer Segment.
How to Use the AI Prompt Guide
Click to Sales and Revenue Command Center Dashboard – Free AI Prompt Guide
Using this prompt guide is straightforward. First, download the free Word document from NextGenTemplates.com. Open the document and copy the complete AI prompt. Paste it into ChatGPT (GPT-4 or GPT-4o recommended) or Claude. The AI will generate a single HTML file with approximately 2,000 to 3,000 lines of code. Copy the output, save it as an HTML file, and open it in any modern browser. Use the troubleshooting section if you encounter any issues with chart rendering, filter functionality, or theme toggling.Sales and Revenue Command Center Dashboard
AI-Generated Version vs Premium Version
It is important to understand the differences between what the free AI prompt generates and the premium Sales and Revenue Command Center Dashboard available on NextGenTemplates.com. The AI-generated version includes approximately 50 sample records, basic chart rendering, and may require debugging for filter functionality and responsive design. The premium version includes 500+ realistic records, pixel-perfect design with smooth animations, fully tested filters that update all charts instantly, print-optimized CSS, cross-browser compatibility, and clean, optimized code.Sales and Revenue Command Center Dashboard
Advantages of This AI Prompt Guide
Click to Sales and Revenue Command Center Dashboard – Free AI Prompt Guide
- Completely Free — Download and use without any cost or registration
- Educational Value — Learn how structured prompts produce professional dashboard output from AI tools
- YouTube Companion — Follow along with our step-by-step video tutorial for a guided learning experience
- Sales-Specific — Every KPI, chart, data field, and layout instruction is tailored for sales operations analytics
- Instant Results — Generate a working HTML dashboard in minutes by pasting a single prompt
Best Practices
- Use GPT-4 or GPT-4o — These models produce the most accurate and complete HTML output from the prompt
- Paste the Entire Prompt at Once — Do not split the prompt into parts; the AI needs the full context to generate a cohesive dashboard
- Test in Chrome First — Chrome has the best Chart.js rendering and developer tools for debugging
- Check the Troubleshooting Section — The guide covers the 5 most common issues with quick fixes
- Upgrade to Premium When Ready — Once you understand how the dashboard works, the premium version on NextGenTemplates.com saves you hours of debugging and polishingSales and Revenue Command Center Dashboard
Explore Relevant Templates
Click to Sales and Revenue Command Center Dashboard – Free AI Prompt Guide
If you are interested in HTML dashboard templates, explore these related products on NextGenTemplates.com:
- Sales and Revenue Command Center Dashboard in HTML (Premium) — The production-ready version with 500+ records and fully tested interactivity
- Digital Marketing Campaign Dashboard in HTML — Track marketing campaigns across channels with interactive charts
- Nonprofit Fundraising Dashboard in HTML — Monitor donations, campaigns, and donor analytics in your browser
- Hospital Patient Flow Dashboard in HTML — Healthcare analytics dashboard with patient flow, bed occupancy, and department metrics
- Construction Project Cost Dashboard in HTML — Track construction budgets, timelines, and cost overruns
Frequently Asked Questions
What is the Sales and Revenue Command Center Dashboard AI Prompt Guide?
The Sales and Revenue Command Center Dashboard AI Prompt Guide is a free downloadable Word document from NextGenTemplates.com that contains a complete, structured AI prompt to generate a 5-tab HTML sales dashboard using ChatGPT or Claude. It includes KPI definitions, chart specifications, color theme CSS variables, data schema, and troubleshooting tips.Sales and Revenue Command Center Dashboard
Can I use this prompt to build any type of dashboard?
No. This prompt is specifically designed for the Sales and Revenue Command Center Dashboard. It contains hardcoded sales metrics like deal pipeline stages, win rate calculations, sales rep definitions, and revenue attainment formulas. Building a different dashboard type such as HR, Finance, or Marketing would require an entirely different prompt with different KPIs, data models, and page layouts.
Is the AI-generated dashboard the same as the premium version?
No. The AI-generated version from this prompt produces a basic working dashboard with approximately 50 sample records and may require debugging. The premium version on NextGenTemplates.com includes 500+ realistic records, polished design, fully tested filters, responsive layout, print-optimized CSS, and cross-browser compatibility.
Do I need any coding experience to use this guide?
No coding skills are required. The guide provides a copy-paste prompt that you enter into ChatGPT or Claude. The AI generates the complete HTML code which you save as a file and open in your browser. The troubleshooting section covers common issues with simple solutions.
Which AI tool should I use with this prompt?
ChatGPT with GPT-4 or GPT-4o produces the best results for HTML dashboard generation. Claude from Anthropic also works well. The prompt is optimized for these modern AI models and may produce varying quality with older or smaller models.
Where can I watch the full tutorial for this dashboard?
Watch the complete step-by-step video tutorial on our YouTube channel where we demonstrate the entire process of using this prompt to build the dashboard live. Visit Youtube.com/@PK-AnExcelExpert for the full tutorial and more HTML dashboard walkthroughs.
Conclusion
Click to Sales and Revenue Command Center Dashboard – Free AI Prompt Guide
The Sales and Revenue Command Center Dashboard AI Prompt Guide is a valuable free resource for anyone who wants to learn how AI tools like ChatGPT and Claude can be used to create professional HTML dashboards. With a structured prompt covering 5 dashboard tabs, 13 chart configurations, 5 KPI definitions, and a complete data schema, this guide demonstrates the power of prompt engineering for data visualization. Download the free AI Prompt Guide now and start building your own Sales and Revenue Command Center Dashboard today.
For the production-ready premium version with 500+ records and pixel-perfect design, visit Sales and Revenue Command Center Dashboard in HTML on NextGenTemplates.com.
For step-by-step video tutorials on dashboards and templates:
👉 Youtube.com/@PK-AnExcelExpert
Click to Sales and Revenue Command Center Dashboard – Free AI Prompt Guide


