Employee satisfaction is a key driver of productivity, retention, and overall organizational success. Understanding how employees feel about their work environment, compensation, management, and growth opportunities is crucial for maintaining a motivated workforce.
An Employee Satisfaction Report in Excel provides a ready-to-use, visual solution for tracking employee feedback and analyzing satisfaction trends across multiple dimensions.
In this article, we’ll explore the features, benefits, and best practices of using an Employee Satisfaction Report in Excel, helping HR managers and team leaders make informed decisions to enhance employee experience.
What is an Employee Satisfaction Report in Excel?
An Employee Satisfaction Report is an Excel-based tool that collects survey responses from employees and presents them in an organized, easy-to-analyze format. By consolidating survey data in one place, this report allows organizations to monitor overall satisfaction, identify areas for improvement, and implement targeted initiatives.
Key advantages include:
-
Quick visualization of employee satisfaction trends.
-
Comparison of satisfaction across departments, roles, or locations.
-
Identification of strengths and weaknesses in work environment, management, and compensation.
-
Data-driven decision-making to improve retention and engagement.
Key Features of the Employee Satisfaction Report
Click to Buy Employee Satisfaction Report in Excel
Our Employee Satisfaction Report in Excel includes multiple sheet tabs to provide detailed insights and allow for easy data management.
1. Summary Sheet Tab
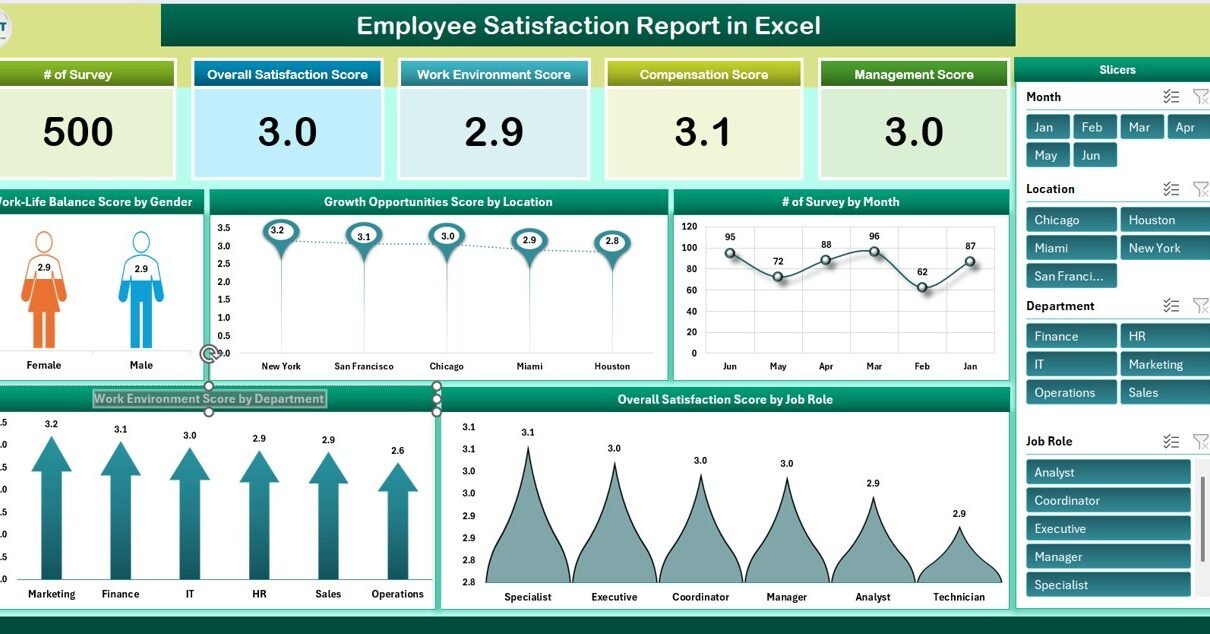
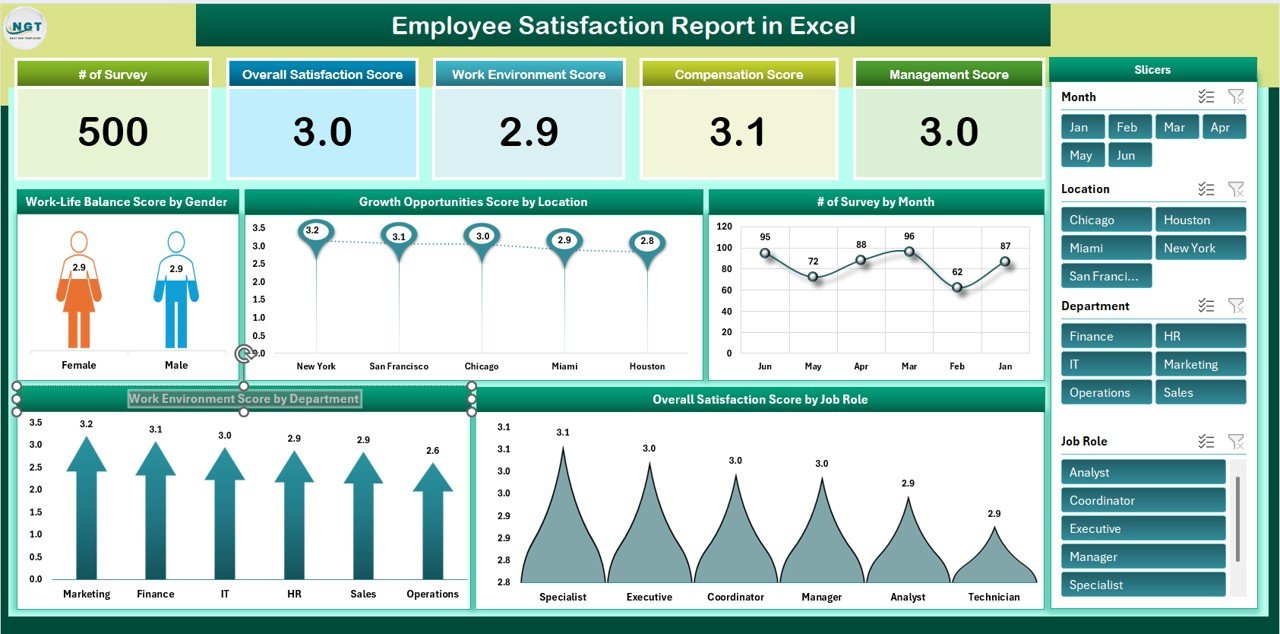
The Summary Sheet serves as the main dashboard for all survey results, providing cards, charts, and report views.
Cards: Key Metrics
-
# of Surveys: Total number of survey responses recorded.
-
Overall Satisfaction Score: Average satisfaction score across all participants.
-
Work Environment Score: Satisfaction related to the workplace environment.
-
Compensation Score: Employee perception of pay and benefits.
-
Management Score: Satisfaction with management and leadership.
Charts: Visualize Satisfaction Trends
-
Work-Life Balance Score by Gender: Compares satisfaction scores between male and female employees.
-
Growth Opportunities Score by Location: Displays perceived career growth opportunities across office locations.
-
# of Survey by Month: Tracks monthly survey participation trends.
-
Overall Satisfaction Score by Job Role: Highlights satisfaction differences among job roles.
-
Work Environment Score by Department: Compares work environment satisfaction across departments.
Click to Buy Employee Satisfaction Report in Excel
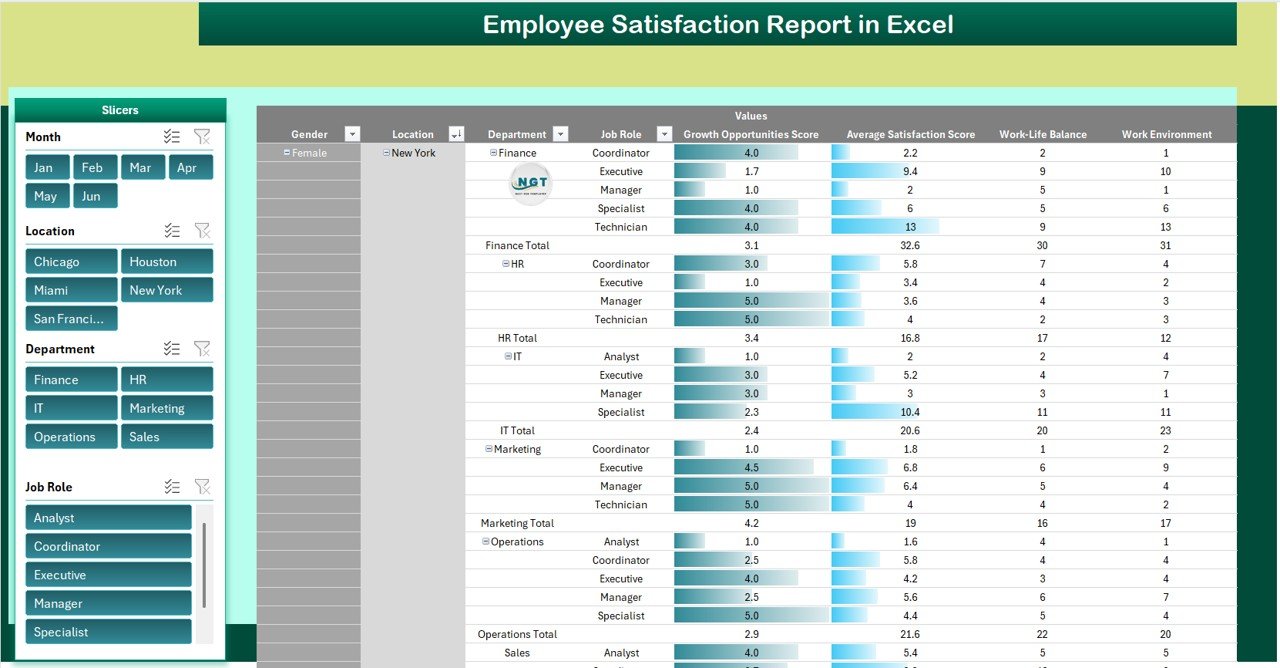
Report: Power Pivot View
The Power Pivot view allows interactive exploration of survey data. Users can filter by department, location, gender, or job role to drill down into specific insights. This dynamic feature makes it easy to generate customized reports for management and HR presentations.
Click to Buy Employee Satisfaction Report in Excel
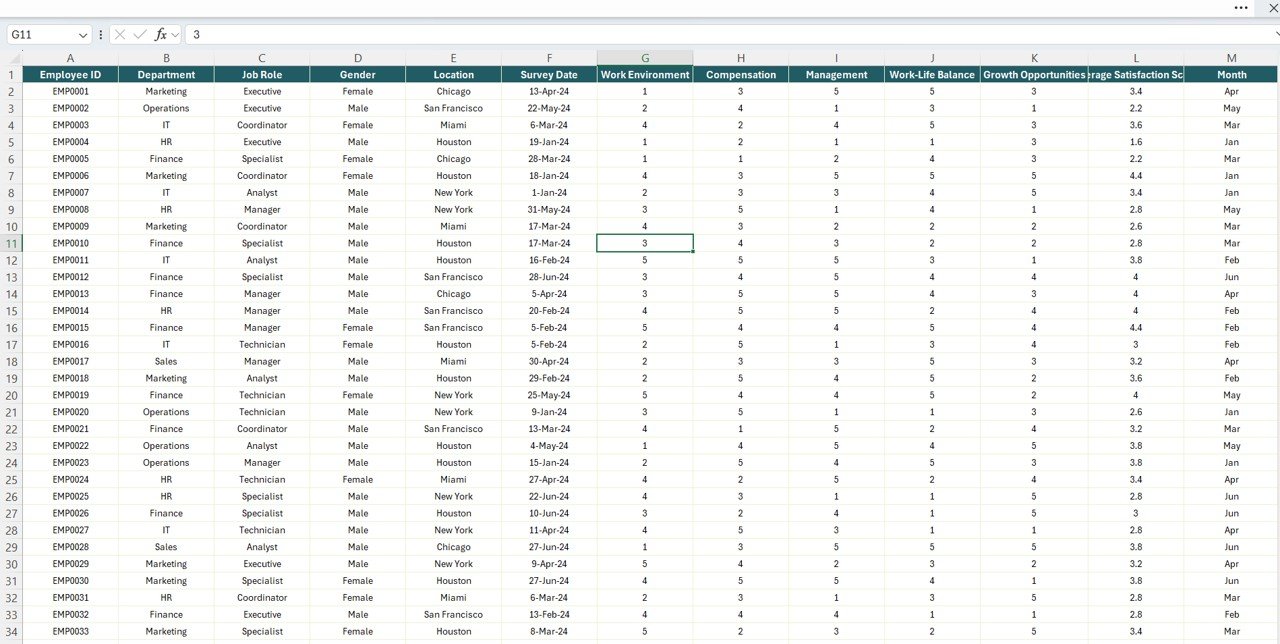
2. Data Sheet Tab: Centralized Data Input
The Data Sheet is the foundation of the report, where all survey records are entered. Typical columns include:
-
Employee ID / Name: Unique identifier or name of the survey participant.
-
Department: Employee department for comparative analysis.
-
Job Role: Employee job role for role-specific insights.
-
Location: Office or branch location.
-
Survey Date: Date the survey was completed.
-
Work Environment Score: Rating for workplace conditions.
-
Compensation Score: Rating for pay and benefits.
-
Management Score: Rating for leadership and supervision.
-
Work-Life Balance Score: Rating for balance between personal and professional life.
-
Growth Opportunities Score: Rating for career advancement opportunities.
This structured data allows the summary sheet to automatically calculate scores and populate visual charts.
Click to Buy Employee Satisfaction Report in Excel
Advantages of Using an Employee Satisfaction Report
-
Centralized Employee Feedback: All survey data is captured in one organized Excel sheet.
-
Visual Insights: Charts and cards make it easy to interpret satisfaction trends at a glance.
-
Department & Role Comparison: Quickly identify areas of improvement for specific departments or roles.
-
Power Pivot Reporting: Create interactive reports with filters to analyze satisfaction across multiple dimensions.
-
Data-Driven Decisions: Use insights to improve HR policies, compensation, and management practices.
-
Track Trends Over Time: Monitor changes in employee satisfaction month by month.
Best Practices for Employee Satisfaction Management
Click to Buy Employee Satisfaction Report in Excel
-
Conduct Regular Surveys: Measure employee satisfaction at consistent intervals to track trends.
-
Ensure Anonymity: Encourage honest feedback by keeping survey responses confidential.
-
Analyze by Segment: Break down results by department, location, and job role for precise insights.
-
Monitor Key Drivers: Focus on work environment, compensation, management, and growth opportunities.
-
Take Action: Address identified issues promptly to improve employee engagement and retention.
-
Communicate Results: Share insights with employees to demonstrate transparency and encourage participation in future surveys.
Opportunities for Improvement
-
Integrate Survey Tools: Sync with digital survey platforms to automate data collection.
-
Add Trend Analysis: Include monthly or quarterly trend charts for each KPI.
-
Benchmark Scores: Compare satisfaction scores against industry benchmarks.
-
Add Comments Section: Capture qualitative feedback alongside scores for deeper insights.
-
Custom Reports: Enable automated department-wise or location-wise report generation.
Conclusion
An Employee Satisfaction Report in Excel is a vital tool for understanding employee sentiment, improving workplace culture, and making informed HR decisions. With a structured data input sheet, dynamic summary sheet, and interactive Power Pivot view, organizations can efficiently track, analyze, and act on employee feedback.
Visit our YouTube channel to learn step-by-step video tutorials
Watch the step-by-step video Demo:
Click to Buy Employee Satisfaction Report in Excel

