Running a successful promotional campaign requires more than creative ads and catchy slogans. Every marketing effort must be measurable, trackable, and adjustable in real time. Businesses today operate in competitive markets, where even small decisions about budgets, channels, and timing can make or break a campaign. That is why companies rely on Promotional Campaign KPI Dashboards in Excel.
An Excel-based dashboard gives you a complete view of campaign performance in one place. It transforms raw data into insights, allowing marketing managers to monitor trends, compare actuals with targets, and make data-driven decisions. The best part is that Excel is already familiar to most professionals, which makes adoption smooth and cost-effective.
Click to buy Promotional Campaign KPI Dashboard In Excel
In this article, we will explore:
- What a Promotional Campaign KPI Dashboard isPromotional Campaign KPI Dashboard In Excel
- Why every business needs one
- Features of the Excel-based template
- Advantages of using this tool
- Opportunities for improvement
- Best practices for implementation
- Real-world use cases
- Frequently asked questions
What Is a Promotional Campaign KPI Dashboard in Excel?
A Promotional Campaign KPI Dashboard is a performance management tool designed to track, analyze, and visualize the success of promotional activities. Instead of relying on multiple reports, you get all campaign metrics in one central Excel file.Promotional Campaign KPI Dashboard In Excel
With this dashboard, you can track essential Key Performance Indicators (KPIs) such as:
- Conversion Rate
- Cost per Lead (CPL)
- Return on Investment (ROI)
- Campaign Reach
- Customer Acquisition Cost (CAC)
- Social Media Engagement
The dashboard provides monthly and yearly views, letting you compare actual results against set targets and previous year performance. In short, it helps marketers answer critical questions like:
- Which campaigns are delivering the highest ROI?
- Are we achieving our monthly and yearly targets?
- How do current results compare to last year?
Key Features of the Promotional Campaign KPI Dashboard
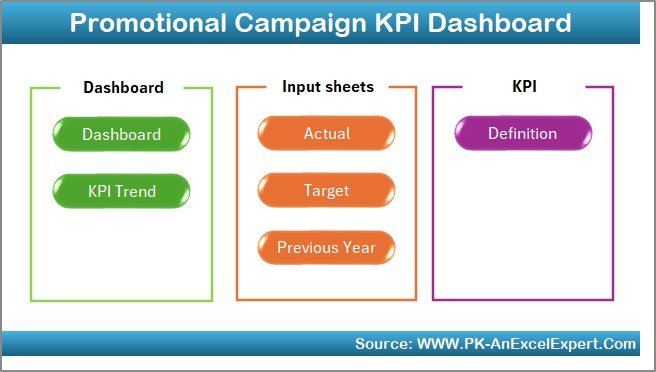
The dashboard comes with seven interconnected worksheets, each serving a specific purpose. Let’s go through them:
Home Sheet
- Acts as an index page.
- Includes buttons for easy navigation to other sheets.
- User-friendly design saves time.
Click to buy Promotional Campaign KPI Dashboard In Excel
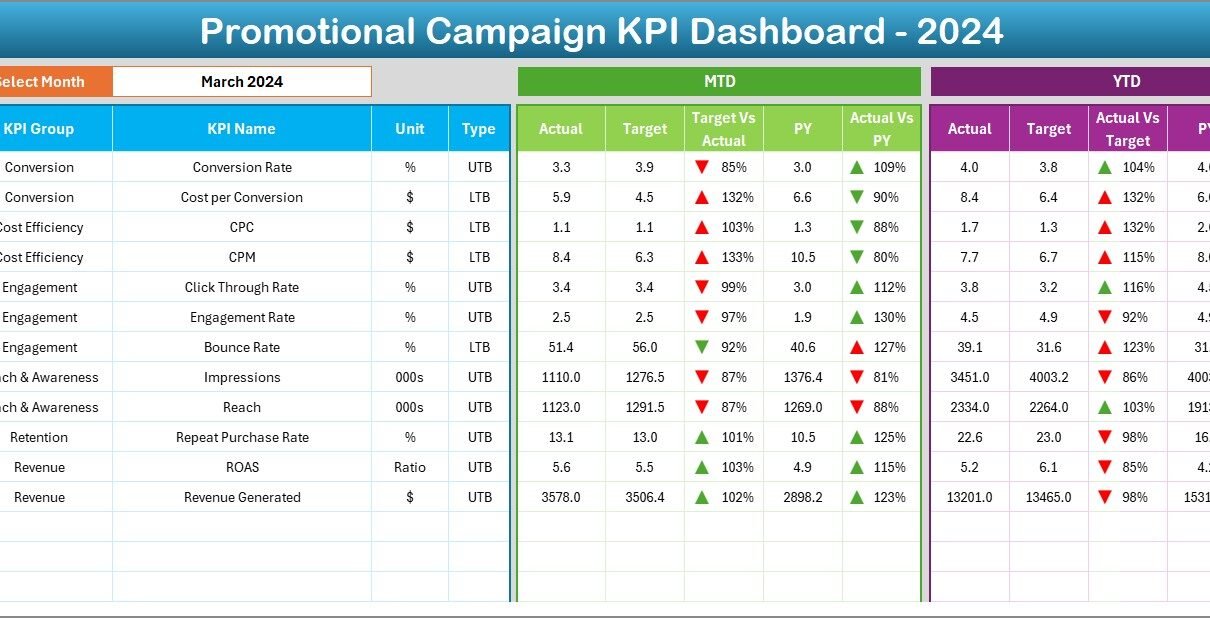
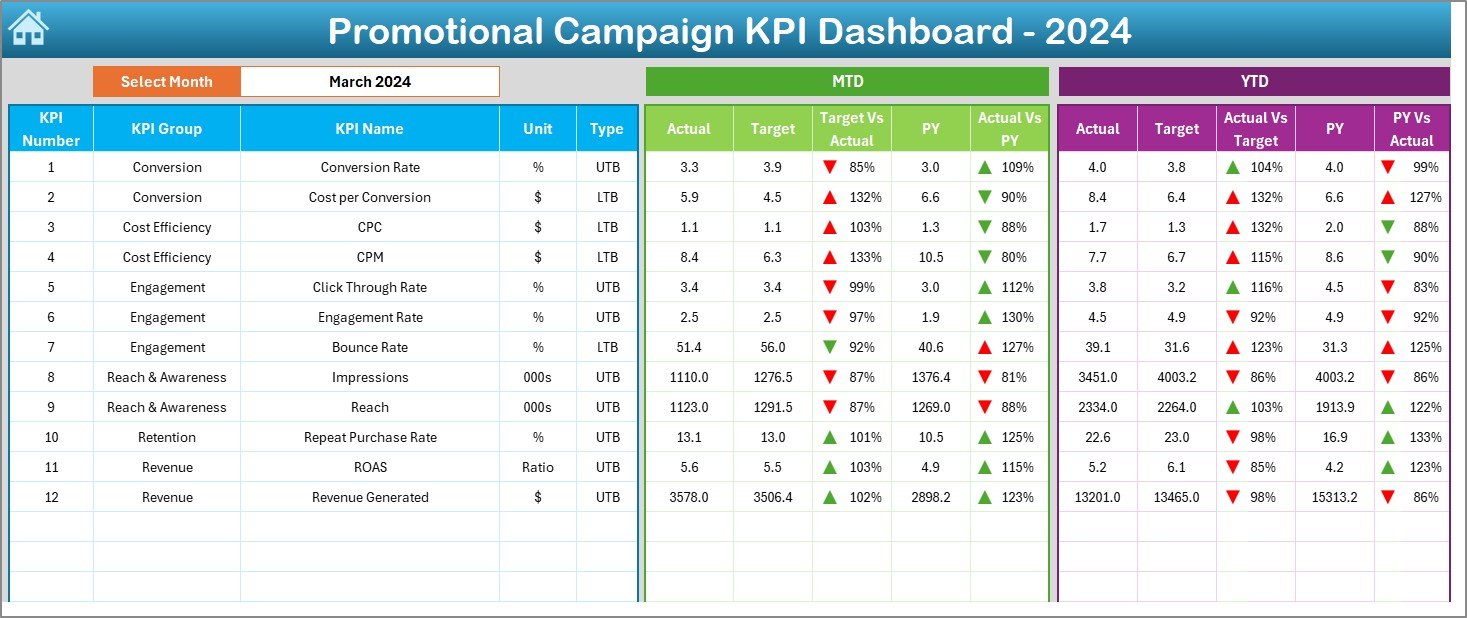
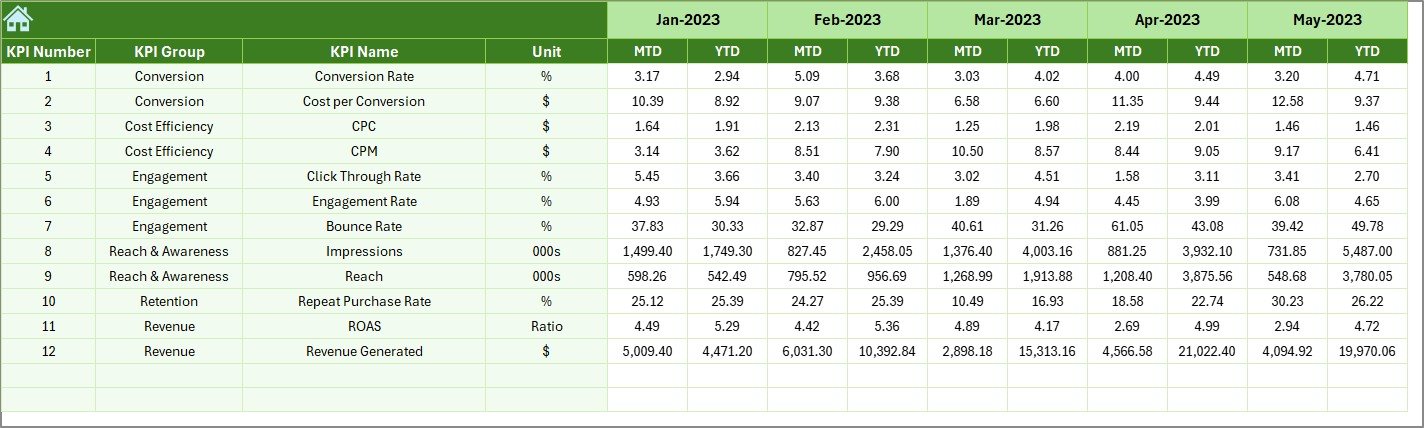
Dashboard Sheet Tab
- The main reporting sheet.
- Drop-down menu to select the month.
- Displays:
- MTD Actual, Target, Previous Year
- YTD Actual, Target, Previous Year
- Uses conditional formatting with up/down arrows to show performance trends.
Click to buy Promotional Campaign KPI Dashboard In Excel
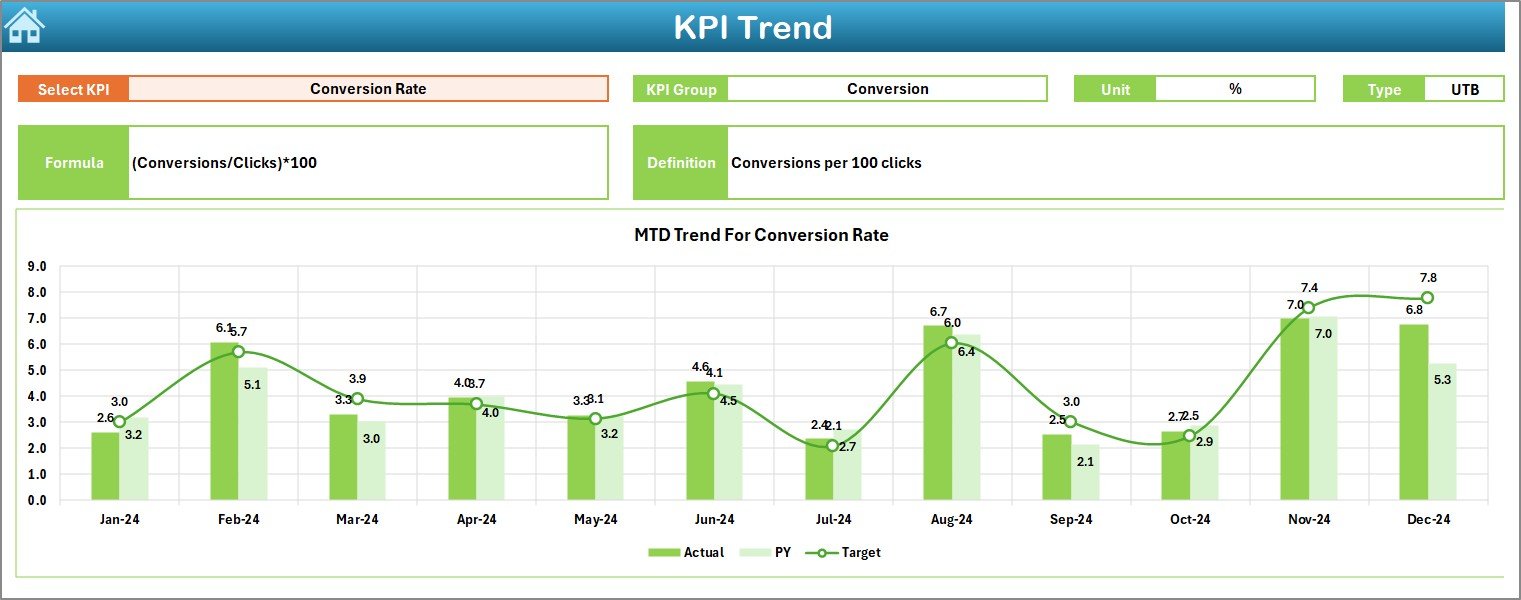
KPI Trend Sheet Tab
- Allows KPI selection from a drop-down list.
- Displays details such as KPI Group, Unit, Formula, and Type.
- Shows MTD and YTD trend charts for Actual, Target, and Previous Year numbers.
Click to buy Promotional Campaign KPI Dashboard In Excel
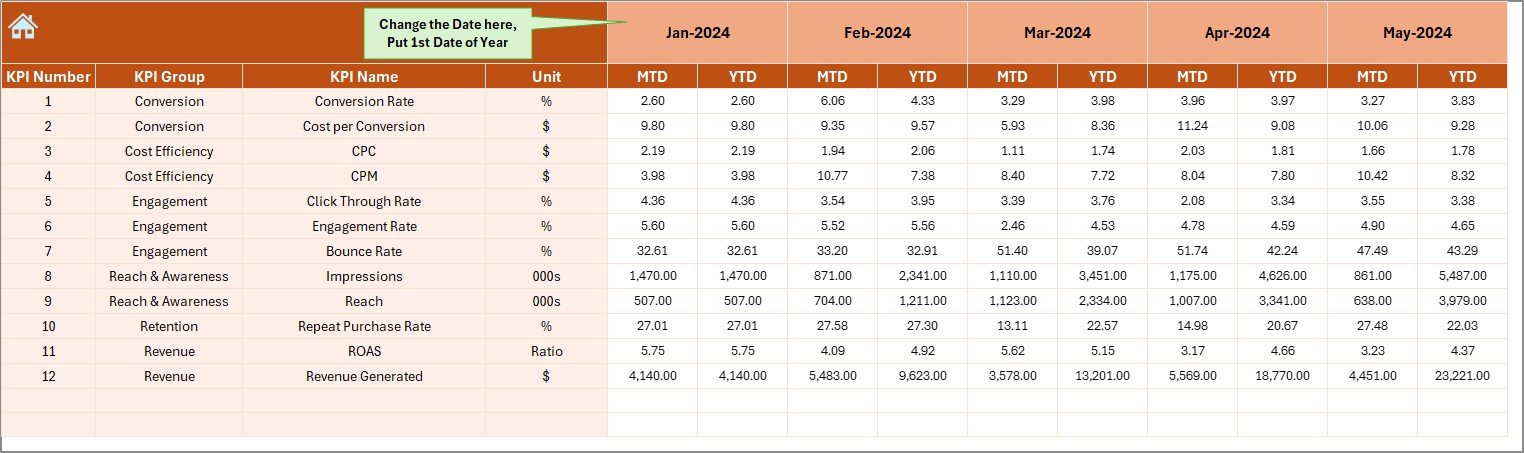
Actual Numbers Input Sheet
- Input sheet for real campaign numbers.
- Enter monthly and yearly data.
- Flexible design with control to set the starting month of the year.
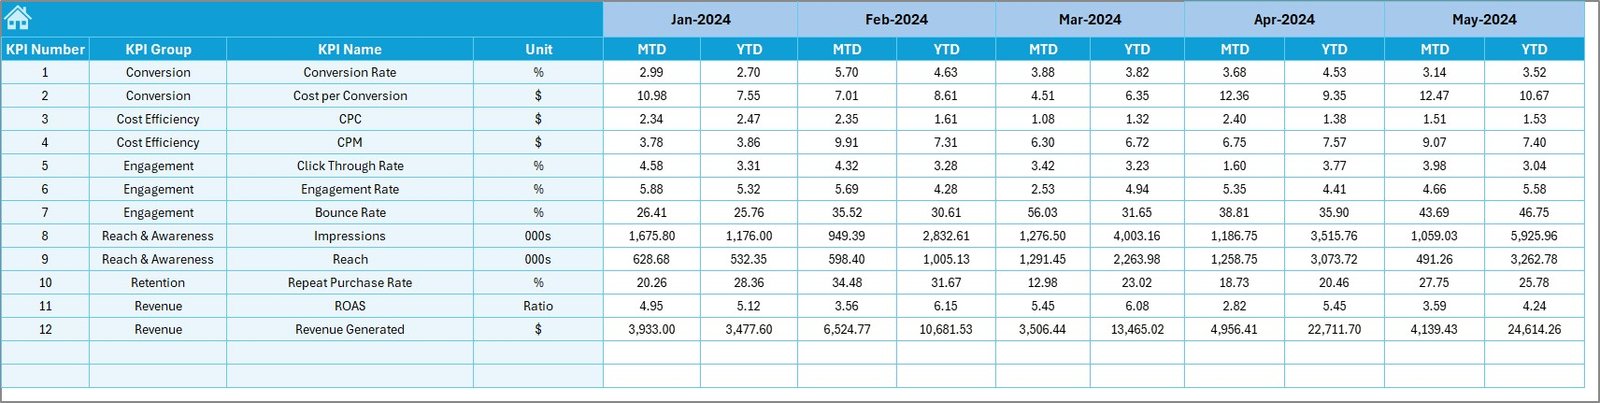
Target Sheet Tab
- Enter targets for each KPI on a monthly and yearly basis.
- Enables direct comparison with actuals.
Click to buy Promotional Campaign KPI Dashboard In Excel
Previous Year Numbers Sheet Tab
- Store and analyze historical campaign performance.
- Helps in identifying long-term trends.
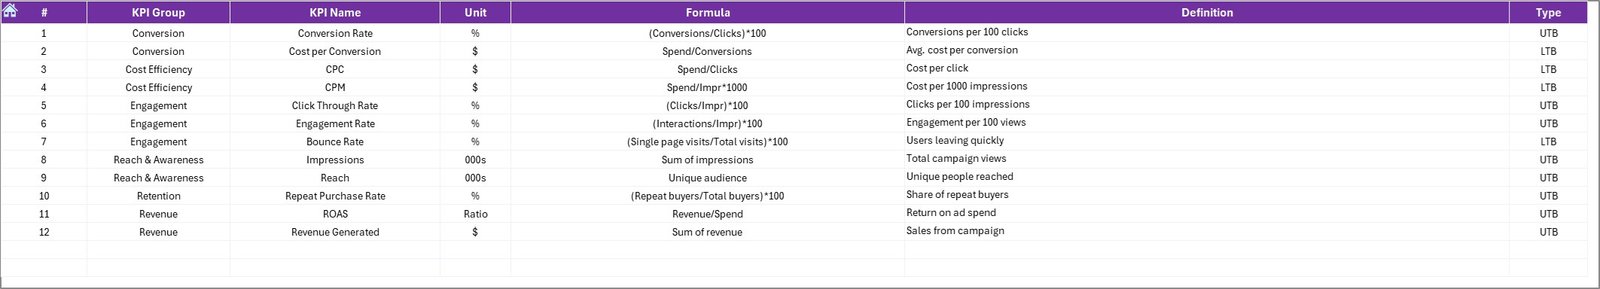
KPI Definition Sheet Tab
- Add KPI names, groups, formulas, and definitions.
- Provides clarity for teams and ensures everyone understands metrics the same way.
Click to buy Promotional Campaign KPI Dashboard In Excel
Why Do Businesses Need a Promotional Campaign KPI Dashboard?
Promotional campaigns involve multiple moving parts: budgets, platforms, creatives, customer responses, and timelines. Without a structured system, it is easy to lose sight of what works and what doesn’t.Promotional Campaign KPI Dashboard In Excel
A dashboard helps businesses:
- Measure ROI in real time.
- Optimize ad spend across different channels.
- Identify underperforming campaigns quickly.
- Align marketing activities with business goals.
- Provide leadership with transparent reporting.
Advantages of a Promotional Campaign KPI Dashboard
Using a KPI dashboard in Excel offers several advantages:
- Centralized Data: All campaign data in one file.
- Easy Tracking: Monitor MTD and YTD performance at a glance.
- User-Friendly: Works in Excel, so no extra software is needed.
- Customizable: Add or remove KPIs as per business needs.
- Visual Insights: Charts and conditional formatting highlight trends.
- Historical Comparison: Compare current campaigns with past results.
- Cost-Effective: No need for expensive analytics software.
Opportunities for Improvement
Even though Excel dashboards are powerful, there are areas for enhancement:
- Automation: Adding macros or Power Query can automate data refresh.
- Integration: Connecting with CRM tools can reduce manual input.
- Scalability: For very large campaigns, Power BI or Google Data Studio may offer more advanced visuals.
- Collaboration: While Excel works well for individuals, Google Sheets allows better team collaboration.
Best Practices for the Promotional Campaign KPI Dashboard
To get the most out of your dashboard, follow these best practices:
- Define Clear KPIs: Choose metrics aligned with campaign goals.
- Update Regularly: Enter actual numbers monthly without delay.
- Set Realistic Targets: Use historical data to define achievable benchmarks.
- Visualize Wisely: Keep charts simple and easy to understand.
- Use Conditional Formatting: Highlight success and problem areas quickly.
- Keep Documentation: Use the KPI Definition tab to avoid confusion.
- Review Monthly and Annually: Compare MTD and YTD results for balanced insights.
Real-World Use Cases
Different industries can apply this dashboard in unique ways:
- Retail: Track store-level promotions and seasonal discounts.
- E-commerce: Measure campaign performance across digital ads and email marketing.
- Hospitality: Monitor ROI of seasonal offers or festive campaigns.
- Education: Track admissions campaigns and lead conversion.
- Healthcare: Evaluate awareness campaigns for health programs.
Step-by-Step Guide to Using the Dashboard
- Start with the KPI Definition Tab: List all relevant KPIs with formulas and units.
- Set Targets: Enter MTD and YTD targets in the Target Sheet.
- Input Actuals: Add monthly actual data in the Actual Numbers sheet.
- Compare Past Data: Enter previous year numbers for better context.
- View Dashboard: Use drop-down filters to switch between months.
- Analyze Trends: Check charts in the KPI Trend sheet.
- Make Adjustments: If performance is below target, adjust campaigns quickly.
Conclusion
A Promotional Campaign KPI Dashboard in Excel is not just a reporting tool—it is a decision-making partner. By consolidating all KPIs in one place, it empowers marketing managers to track progress, analyze gaps, and maximize ROI. With clear visuals, monthly and yearly comparisons, and user-friendly navigation, this dashboard ensures campaigns stay on track and deliver results.
Every business that invests in promotions should adopt a KPI dashboard. It reduces guesswork, increases transparency, and supports data-driven growth.
Frequently Asked Questions (FAQs)
- What KPIs should I include in a Promotional Campaign Dashboard?
Include metrics like Conversion Rate, ROI, Cost per Lead, Campaign Reach, Customer Acquisition Cost, and Social Media Engagement.
- Can I customize the dashboard for my industry?
Yes, you can add or remove KPIs based on industry requirements. The template is flexible.
- How often should I update the dashboard?
Update monthly with MTD data and review YTD numbers quarterly or annually.
- Is Excel enough for large campaigns?
Excel works for small to mid-sized campaigns. For very large data sets, consider Power BI or Google Data Studio.
- Can multiple users work on the same dashboard?
Yes, if stored in a shared location like OneDrive or Google Drive. However, Google Sheets offers smoother collaboration.
Visit our YouTube channel to learn step-by-step video tutorials
Watch the step-by-step video tutorial:
Click to buy Promotional Campaign KPI Dashboard In Excel